

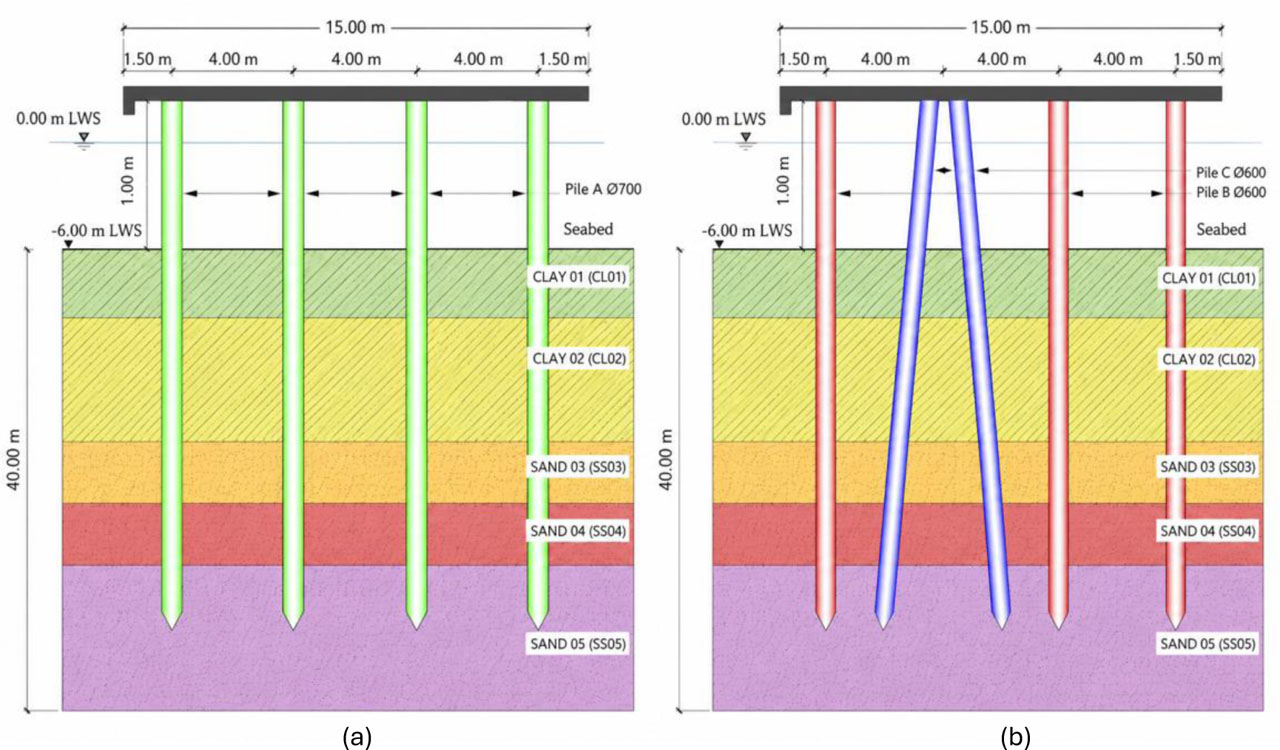
Figure 1:
The Geometry of Structure (a) PSW-A; (b) PSW-B
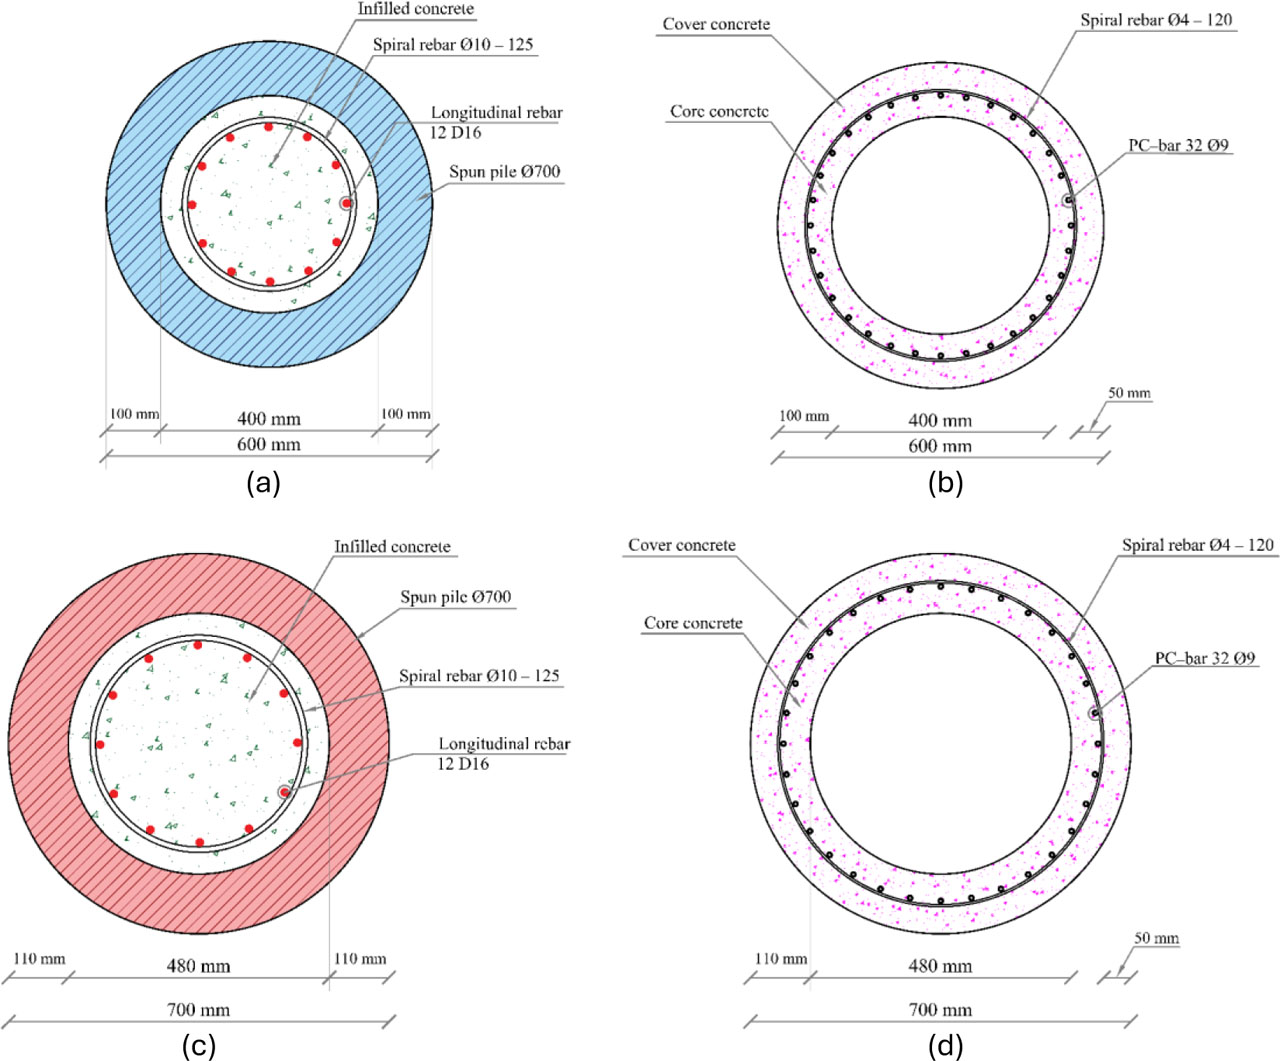
Figure 2:
Spun pile cross-sections (a) Pile A with infilled concrete; (b) Pile A; (c) Piles B and C with infilled concrete; (d) Piles B and C
Table 1:
Material properties of PSW
| Symbol | Description | Value |
|---|---|---|
| fco | Cover concrete compressive strength [MPa] | 52 |
| ɛco | Strain at peak compressive strength of cover concrete [-] | 0.00275 |
| fcc | Core concrete compressive strength [MPa] | 53.95 |
| ɛcc | Strain at peak compressive strength of core concrete [-] | 0.00323 |
| fc | Deck and infilled concrete compressive strength [MPa] | 30 |
| ɛc | Strain at peak compressive strength of deck/infilled concrete [-] | 0.00275 |
| fy−pc | Yield strength of PC bar [MPa] | 1275 |
| fu−pc | Ultimate strength of PC bar [MPa] | 1420 |
| σini | Initial stress in PC bar [MPa] | 781 |
| Es | Elastic modulus of PC bar [MPa] | 190,000 |
| fy−in | Yield strength of infilled concrete rebar [MPa] | 420 |
| fu−in | Ultimate strength of infilled concrete rebar [MPa] | 620 |
| Ein | Elastic modulus of infilled concrete rebar [MPa] | 200,000 |
Table 2:
Time-dependent corrosion degree ψ adopted in the analysis. (Refani & Nagao, 2023b)
| Exposure Time [years] | ψ for Pile A [%] | ψ for Piles B and C [%] | Interpretation |
|---|---|---|---|
| 0 | 0.00 | 0.00 | Initial uncorroded condition |
| 50 | 12.20 | 12.20 | Intermediate corrosion condition |
| 75 | 18.56 | 18.56 | Long-term corrosion condition |
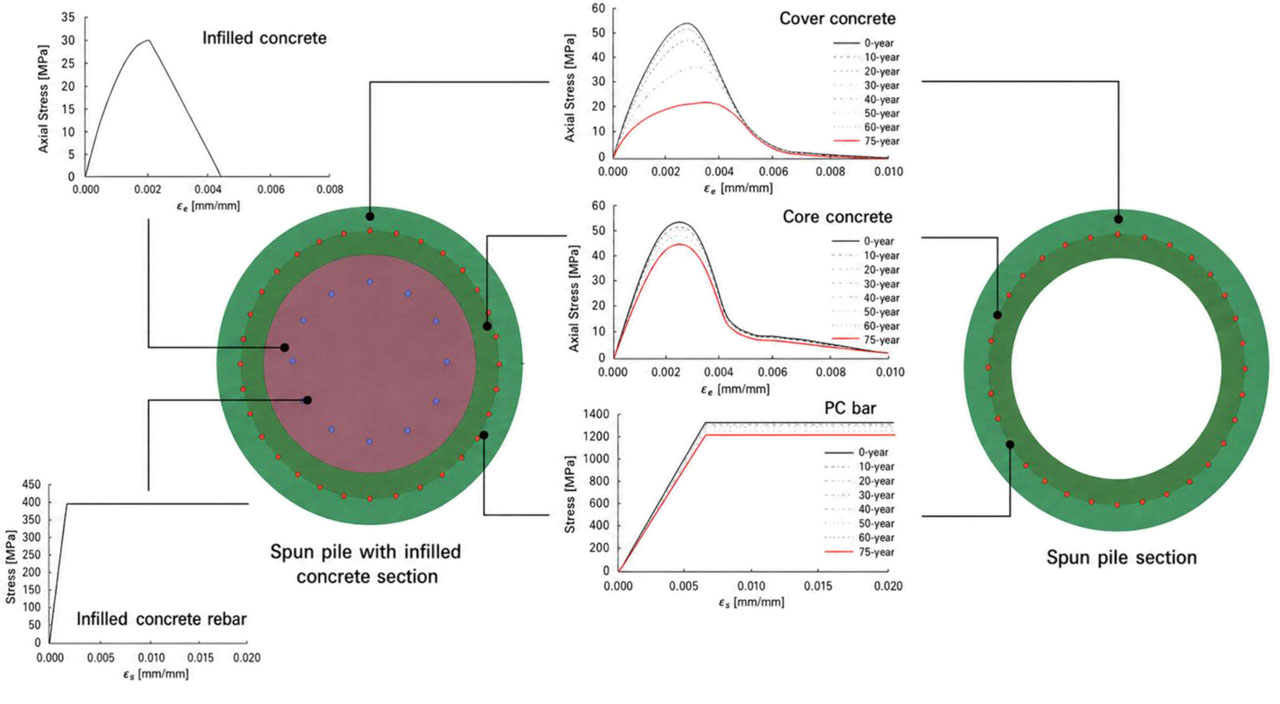
Figure 3:
Fiber discretization of spun pile section in FB-FEA (Refani & Nagao, 2023b)
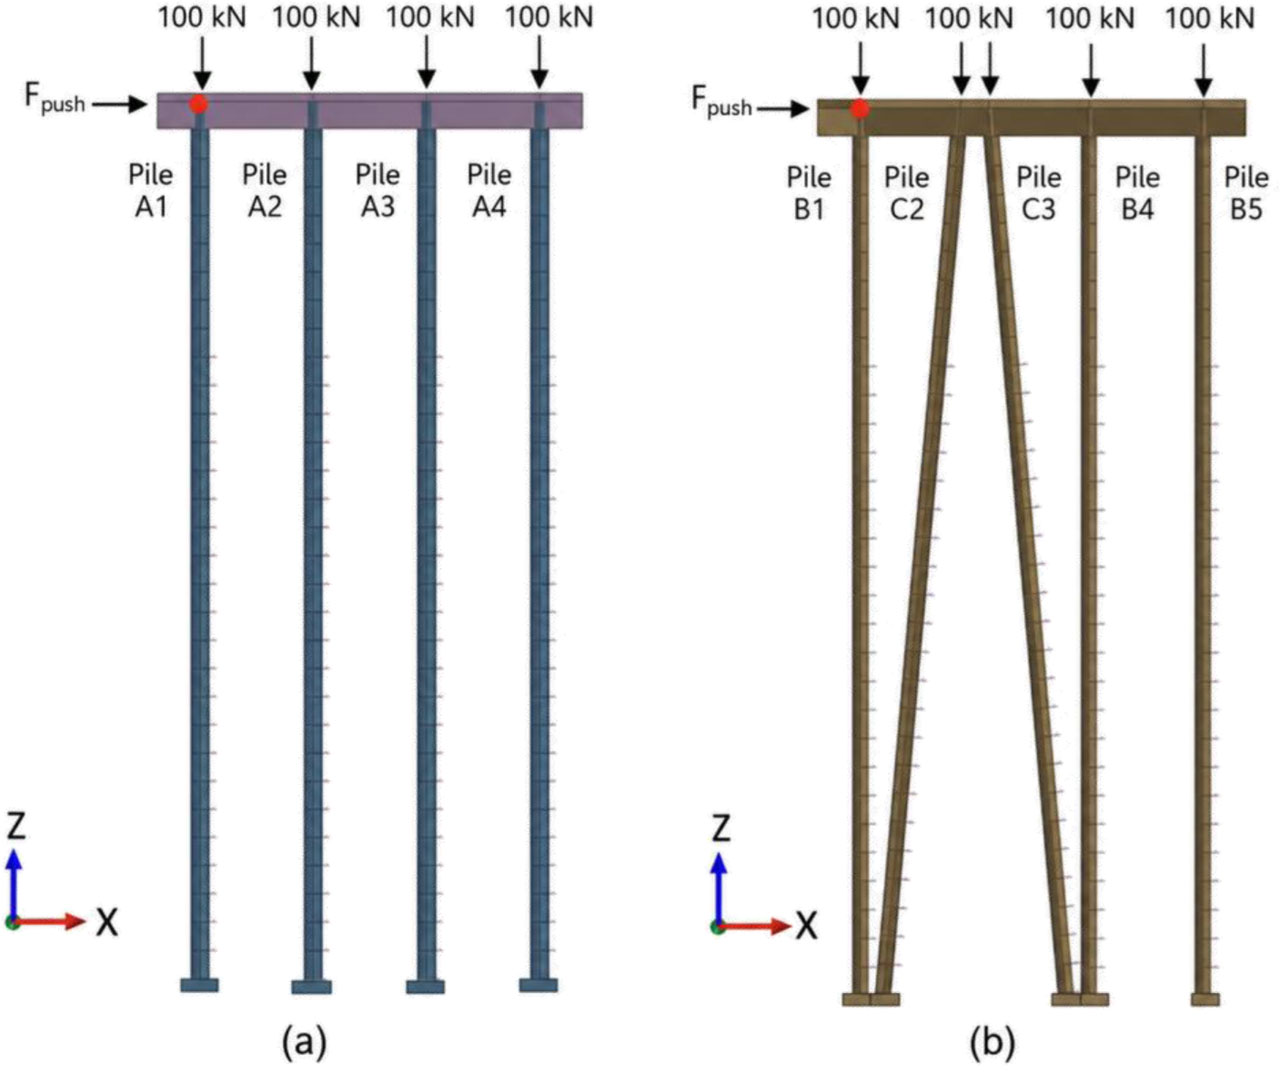
Figure 4:
2D FB-FEA models. (a) PSW-A; (b) PSW-B
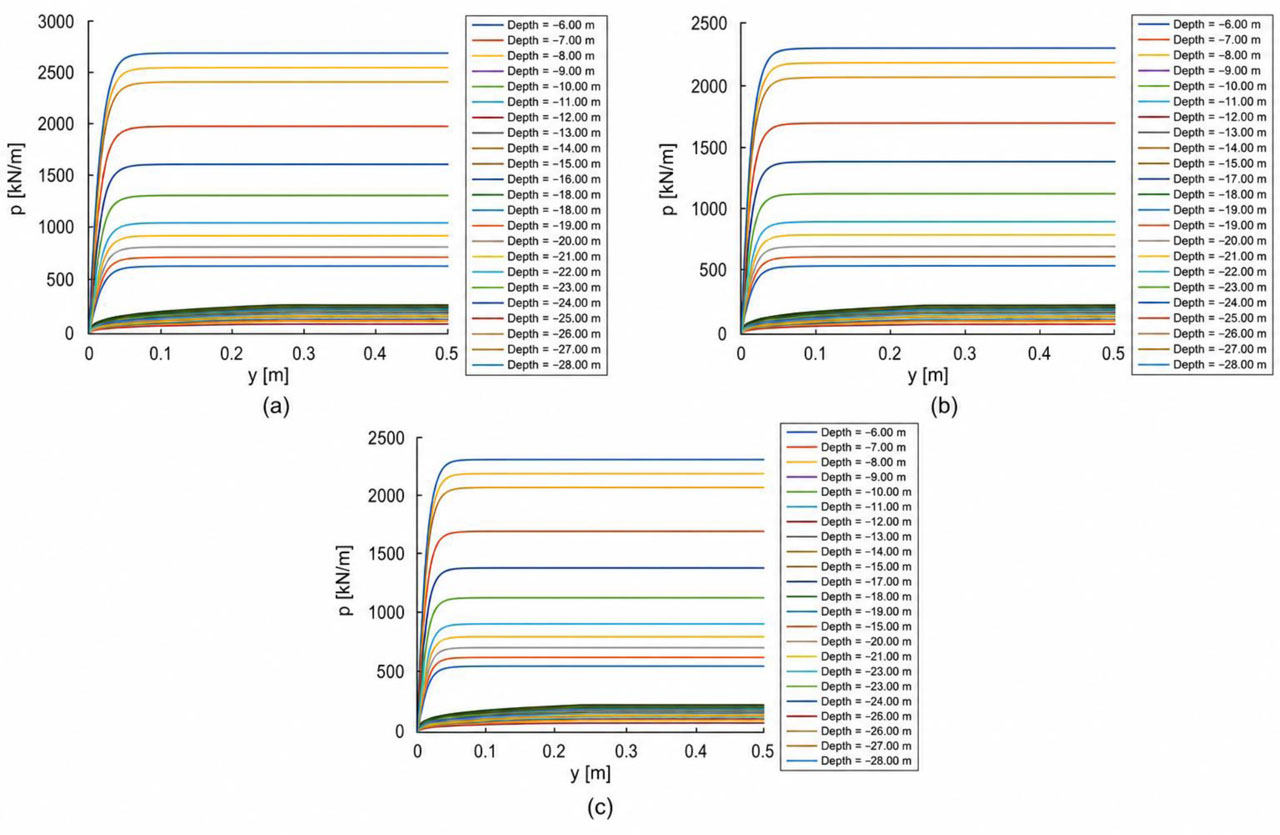
Figure 5:
p–y curve. (a) Pile A (Ø700 mm vertical); (b) Pile B (Ø600 mm vertical); (c) Pile C (Ø600 mm battered). (Refani & Nagao, 2023b)
Table 3:
Representative soil parameters used for p–y curve generation and numerical analysis. (Refani & Nagao, 2023b)
| Layer Code | Soil Type | N-SPT [-] | Layer Thickness [m] | Representative N-SPT | Unit Weight γn [kN/m3] | Friction Angle Φ [°] | Cohesion c [kN/m2] |
|---|---|---|---|---|---|---|---|
| CL01 | Very Soft Clay | 2–4 | 3 | 3 | 10.07 | 6 | 41.19 |
| CL02 | Soft Clay | 5–6 | 9 | 5.5 | 10.33 | 7 | 42.22 |
| SS03 | Silty Sand | 11–19 | 4 | 15 | 10.75 | 22 | - |
| SS04 | Medium Sand | 28–33 | 4 | 30.5 | 11.09 | 30 | - |
| SS05 | Dense Sand | 35–60 | 20 | 47.5 | 11.89 | 34 | - |
Table 4:
Stiffness Reduction Factor (η) from FB-FEA at Various Corrosion Levels (Refani & Nagao, 2023b)
| Pile | Years | Corrosion Degree | Rust Thickness of PC Bar [mm] | Stiffness Reduction Factor η |
|---|---|---|---|---|
| Pile A | 0 | 0.00% | 0.000 | 1.000 |
| Pile A | 50 | 12.20% | 0.852 | 0.885 |
| Pile A | 75 | 18.56% | 1.144 | 0.789 |
| Piles B and C | 0 | 0.00% | 0.000 | 1.000 |
| Piles B and C | 50 | 12.20% | 0.669 | 0.950 |
| Piles B and C | 75 | 18.56% | 1.144 | 0.799 |
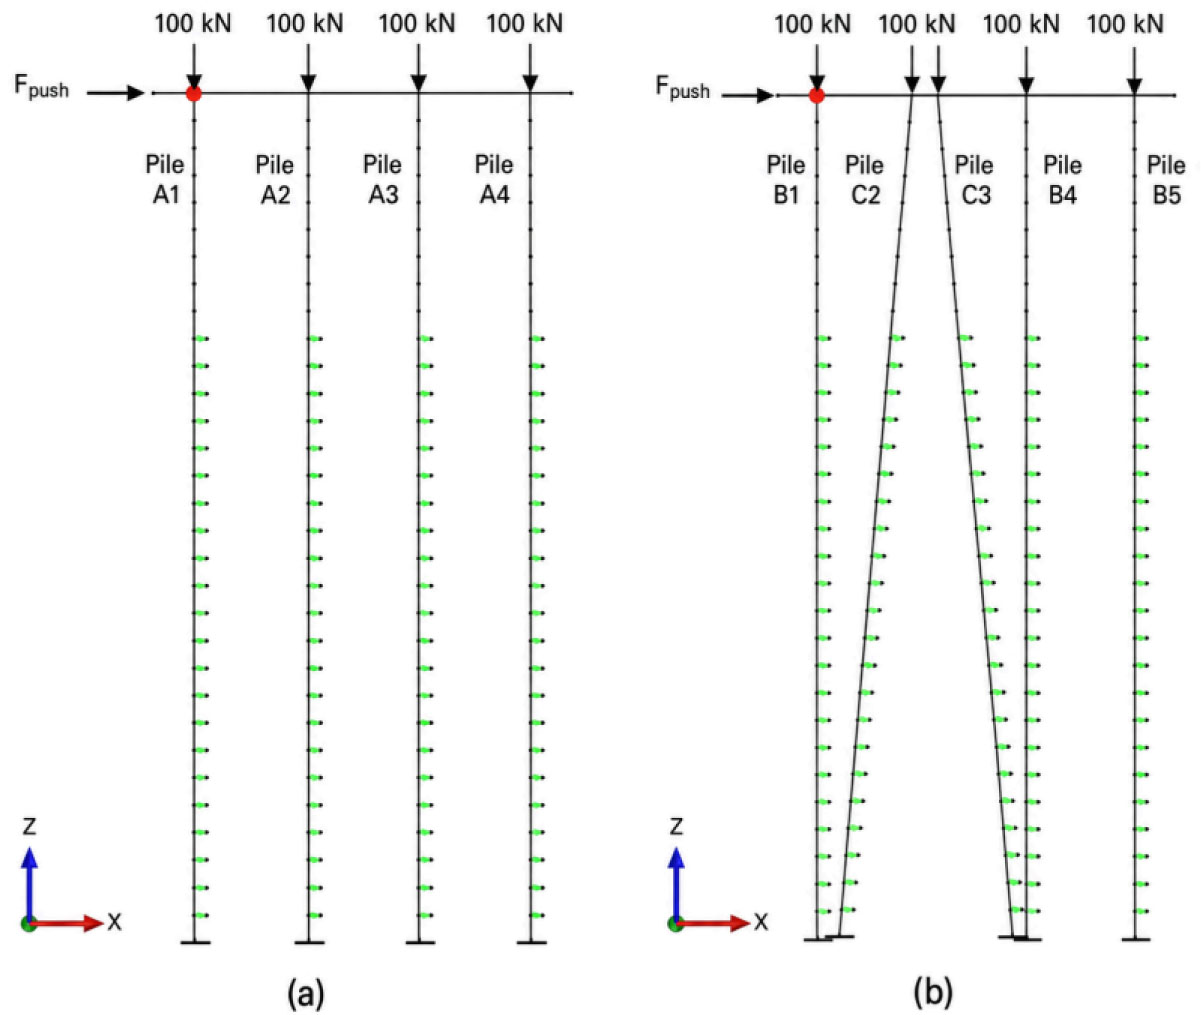
Figure 6:
Loading schematic of non-linear static pushover analysis; (a) PSW-A; (b) PSW-B
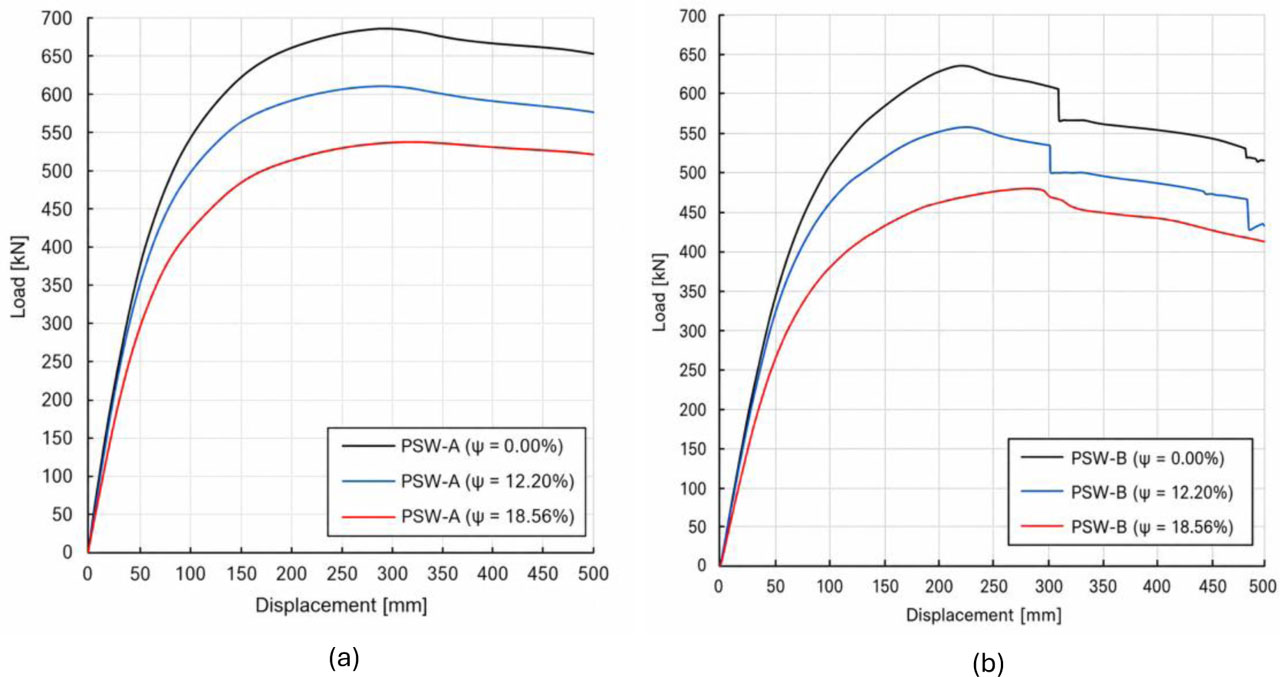
Figure 7:
The result pushover curves of corroded spun pile: (a) PSW-A; (b) PSW-B. The distinct force reduction in PSW-B around 300 mm deck displacement indicates the onset of local stiffness degradation and severe nonlinear damage-state behavior
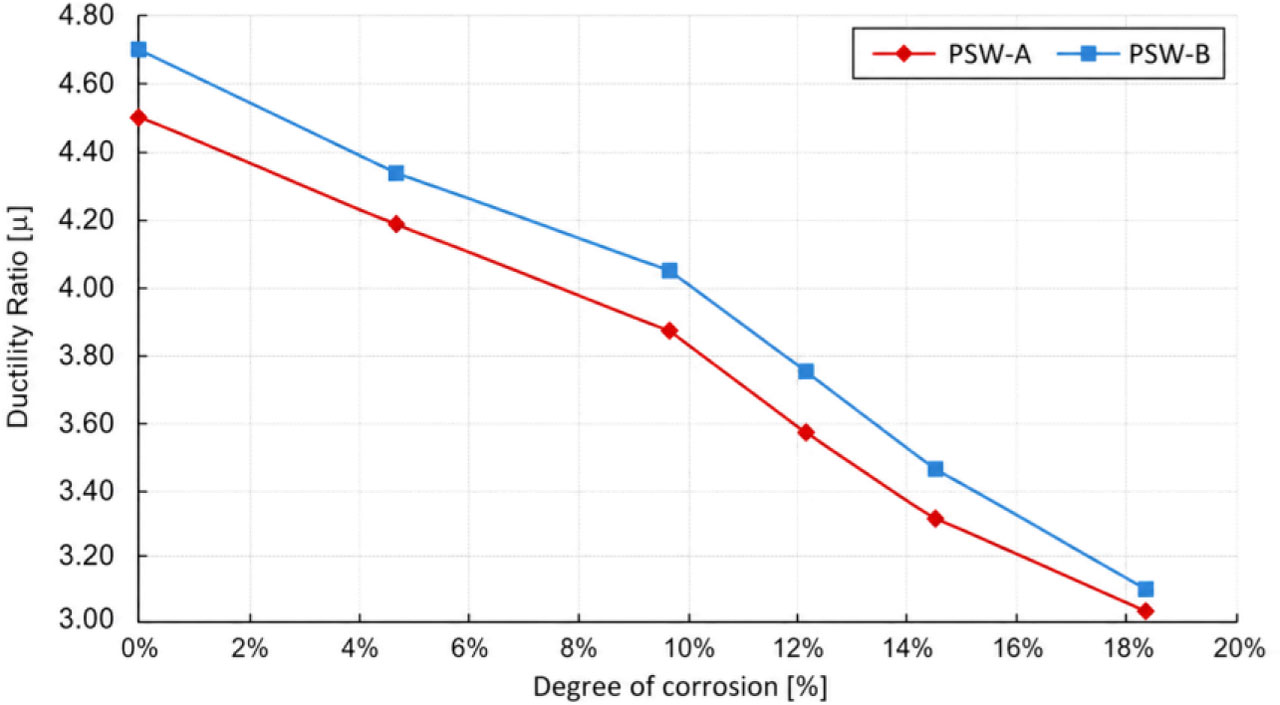
Figure 8:
Comparison of Ductility Ratios between PSW-A and PSW-B
Table 5:
Summary of Strain Limits per Damage Degree (PIANC, 2001)
| Damage Degree | Material | Strain Limit [-] | Remarks |
|---|---|---|---|
| Degree I – Serviceable | Concrete (extreme fibre compressive) | 0.004 | Minor, no significant damage |
| Degree I – Serviceable | Rebar (reinforcing bar) | 0.010 | Crack control limit |
| Degree I – Serviceable | Prestressing strand (incremental) | 0.005 | Serviceability limit |
| Degree II – Repairable | Concrete (pile-deck hinge) | 0.025 | Typically ∼0.007–0.025 |
| Degree II – Repairable | Concrete (in-ground hinge) | 0.008 | Typically ∼0.005–0.008 |
| Degree II – Repairable | Rebar (pile–deck hinge) | 0.050 | Yield-level ductility |
| Degree II – Repairable | Rebar (in-ground hinge) | 0.010 | Serviceability-level ductility |
| Degree II – Repairable | Prestressing strand (pile-deck hinge) | 0.040 | Post-yield limit |
| Degree II – Repairable | Prestressing strand (in-ground hinge) | 0.015 | Pre-collapse behavior |
| Degree III – Near Collapse | Concrete | Not explicitly specified (≥ ∼0.025) | Double plastic hinges at limited piles |
| Degree III – Near Collapse | Rebar | Not explicitly specified, > 0.05 | Significant post-yield strain |
| Degree III – Near Collapse | Prestressing strand | Not explicitly specified, > 0.04 | Approaching failure |
| Degree IV – Collapse | All materials | Concrete: > ∼0.025; Rebar: > 0.050; Prestressing strand: > 0.040 | Complete structural failure, loss of capacity |
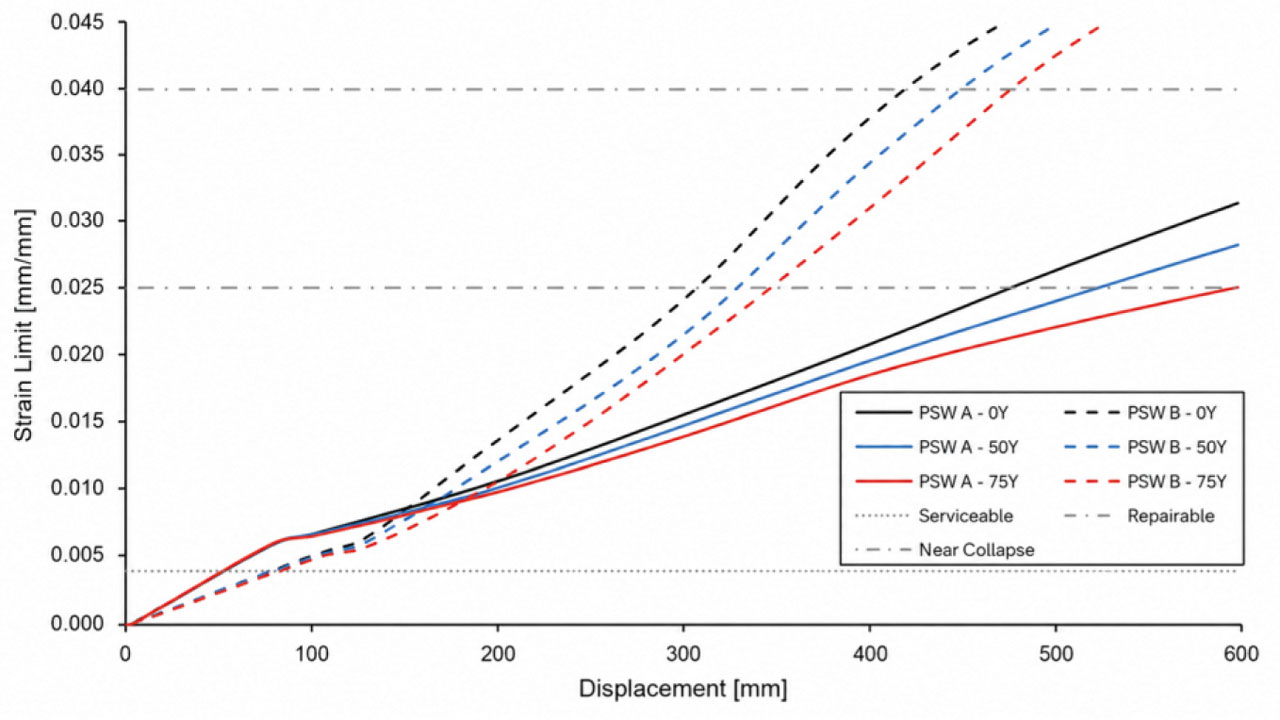
Figure 9:
Strain PC Bar - Deck Displacement Relationship
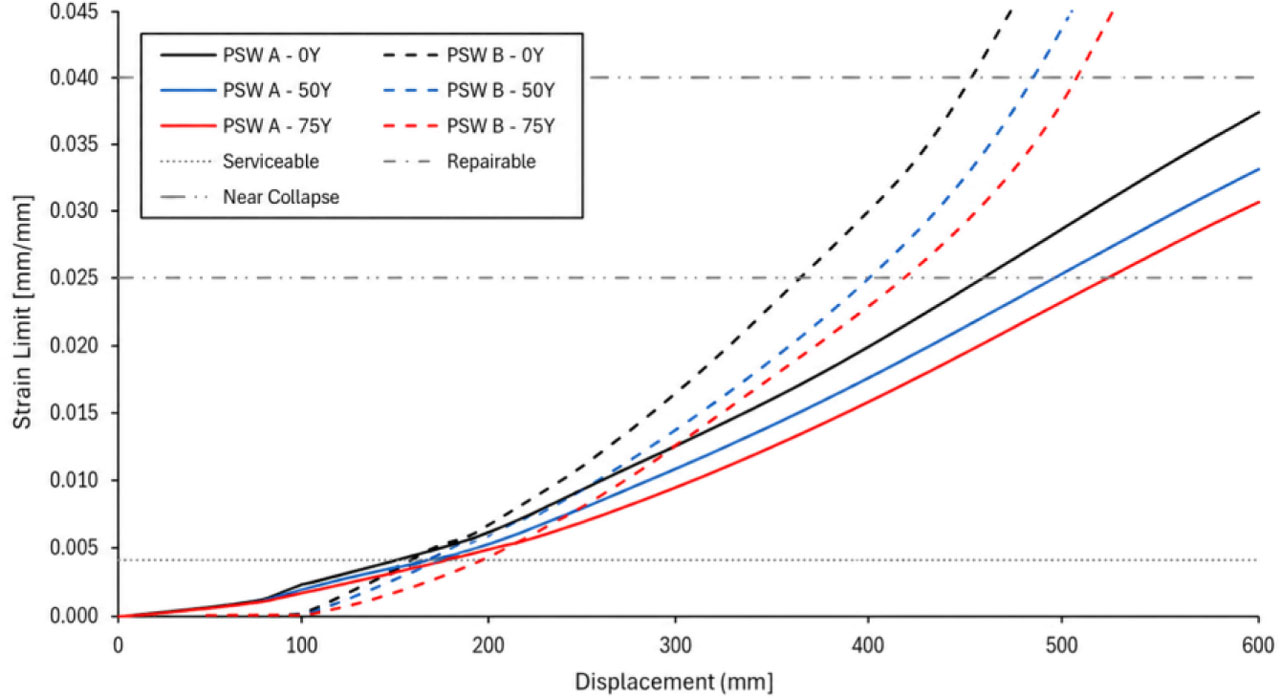
Figure 10:
Strain Concrete - Deck Displacement Relationship
Table 6:
Deck displacement at peak lateral resistance, Δpeak [mm]
| Configuration | Corrosion Year | Deck displacement at peak lateral resistance, Δpeak [mm] | Strain in PC Bar [mm/mm] | Strain in Concrete [mm/mm] |
|---|---|---|---|---|
| PSW-A | 0 | 413 | 0.022 | 0.023 |
| PSW-A | 50 | 385 | 0.020 | 0.021 |
| PSW-A | 75 | 372 | 0.018 | 0.020 |
| PSW-B | 0 | 336 | 0.035 | 0.025 |
| PSW-B | 50 | 329 | 0.032 | 0.023 |
| PSW-B | 75 | 324 | 0.030 | 0.022 |