

Table 1:
Section Properties of Validation Model (Zahrai & Jalali, 2014)
| Spec. | Web stiffeners | Knee | Brace | Beam | Column | Steel properties | ||||||
| Distance [mm] | Thickness [mm] | Length [mm] | Section | Length [mm] | Section | Length [mm] | Section | Length [mm] | Section | Fy [N/mm2] | Fu [N/mm2] | |
| KBF 1 | 100 | 10 | 800 | IPE140 | 4300 | 2UNP80 | 3600 | IPE180 | 3500 | 2IPE140 | 333.9 | 482.7 |
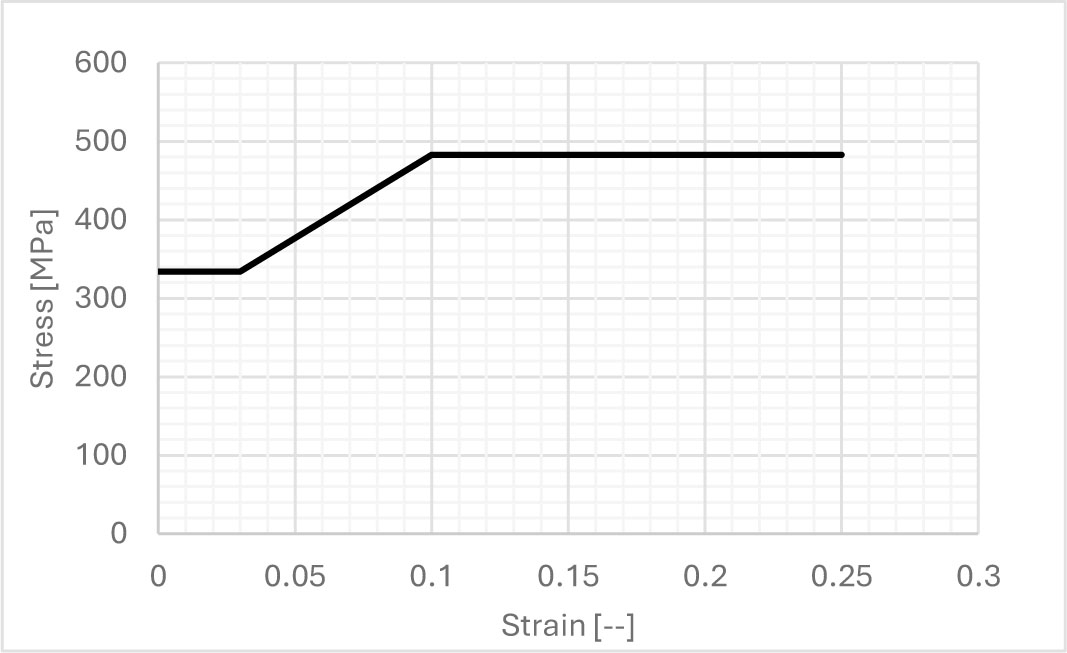
Figure 1:
Uniaxial Stress-Strain Relationship for Steel Material
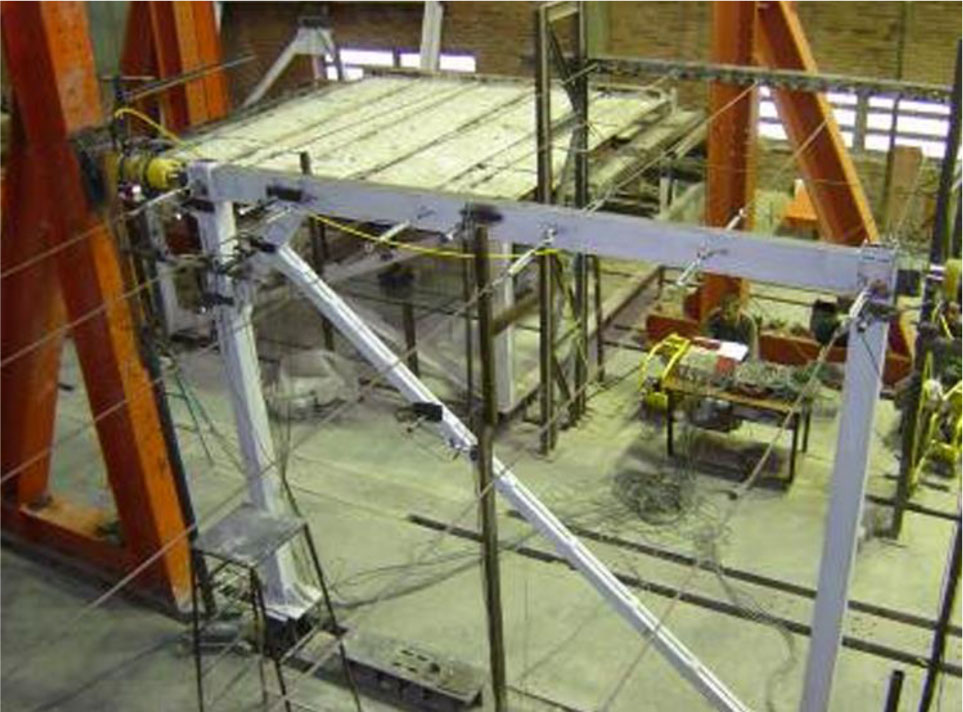
Figure 2:
Experimental Test Setup Configuration (Zahrai & Jalali, 2014)
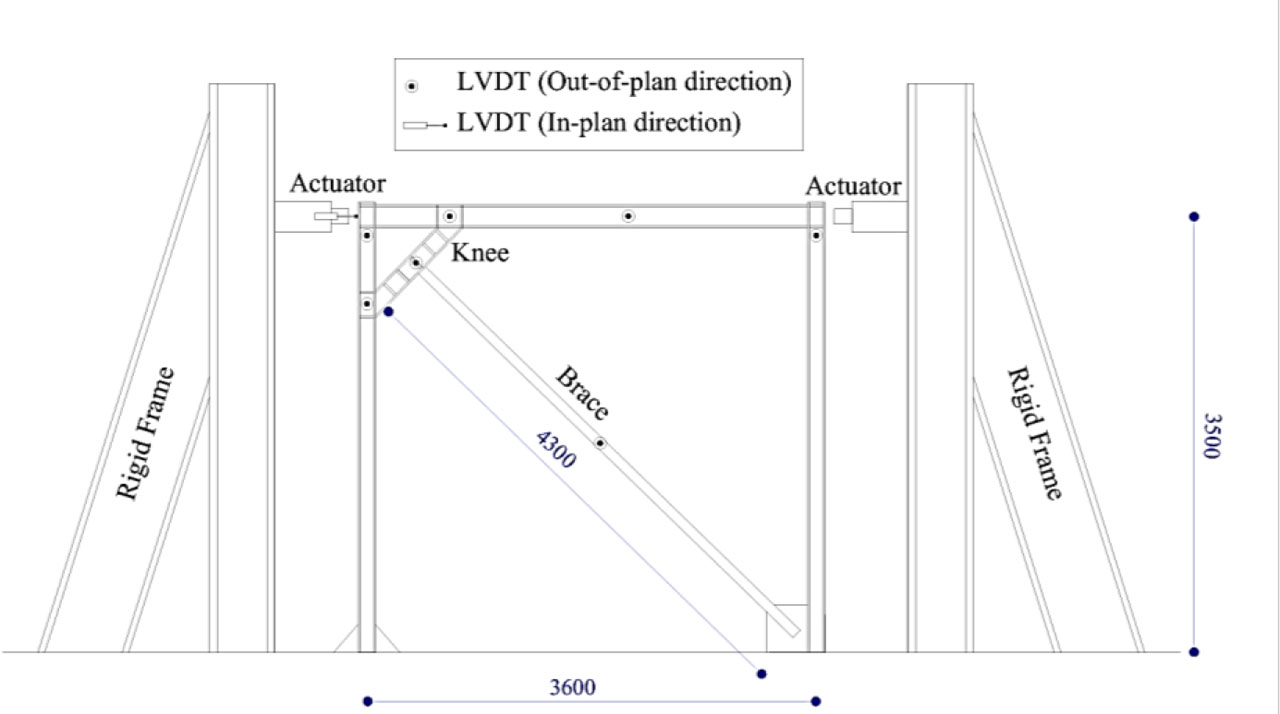
Figure 3:
Analytical Model of Knee-Braced Frame with Component Identification (Zahrai & Jalali, 2014)
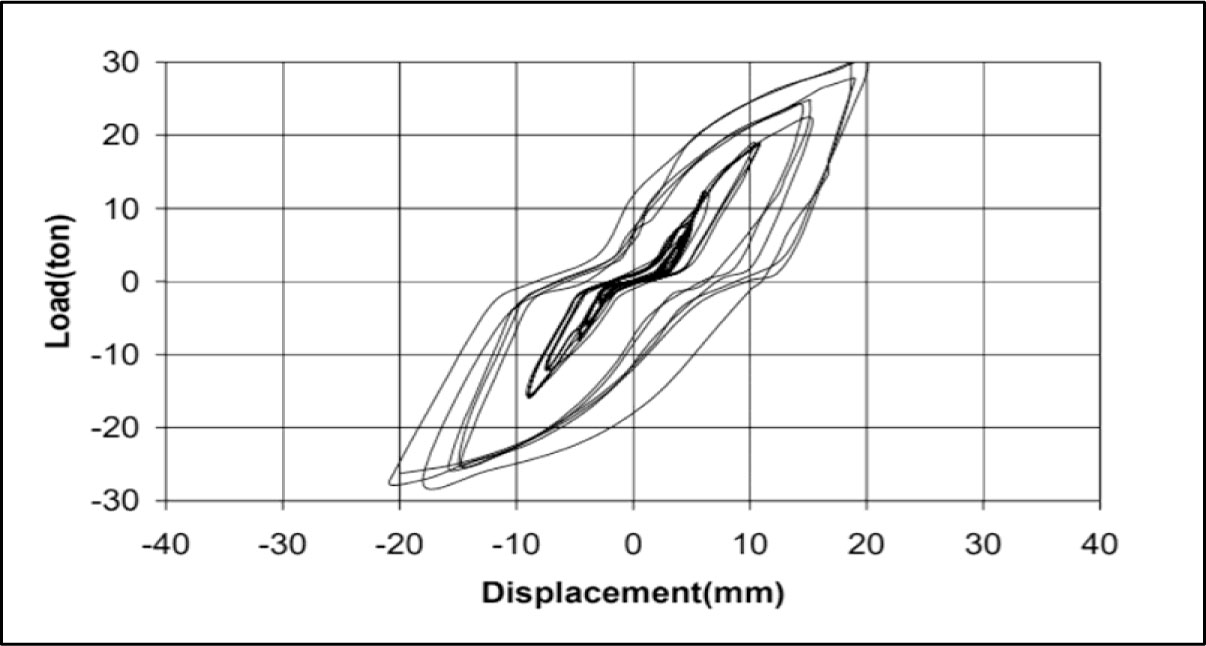
Figure 4:
Experimental Hysteresis Loop Validation (Zahrai & Jalali, 2014)
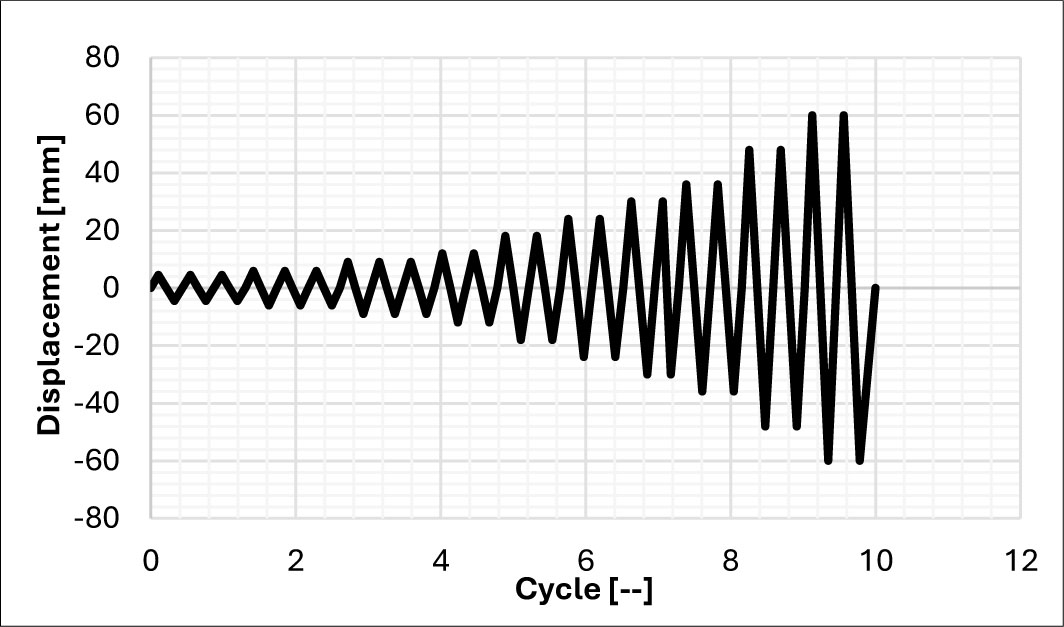
Figure 5:
Quasi-Static Cyclic Loading Protocol Following ATC-24 Guidelines
Table 2:
Section Properties and Material Characteristics of Numerical Models
| Sample | Knee Elem./ Length | Brace | Beam | Column | Fy [Mpa] | Fu [Mpa] | E [Mpa] |
|---|---|---|---|---|---|---|---|
| KBF01-T | IPE140 / 800mm | 2UNP80 | IPE180 | 2IPE140 | 333.9 | 482.7 | 210000 |
| KBF02-T | IPE140 / 1400mm | 2UNP80 | IPE180 | 2IPE140 | 333.9 | 482.7 | 210000 |
| KBF03-T | IPE140 / 1800mm | 2UNP80 | IPE180 | 2IPE140 | 333.9 | 482.7 | 210000 |
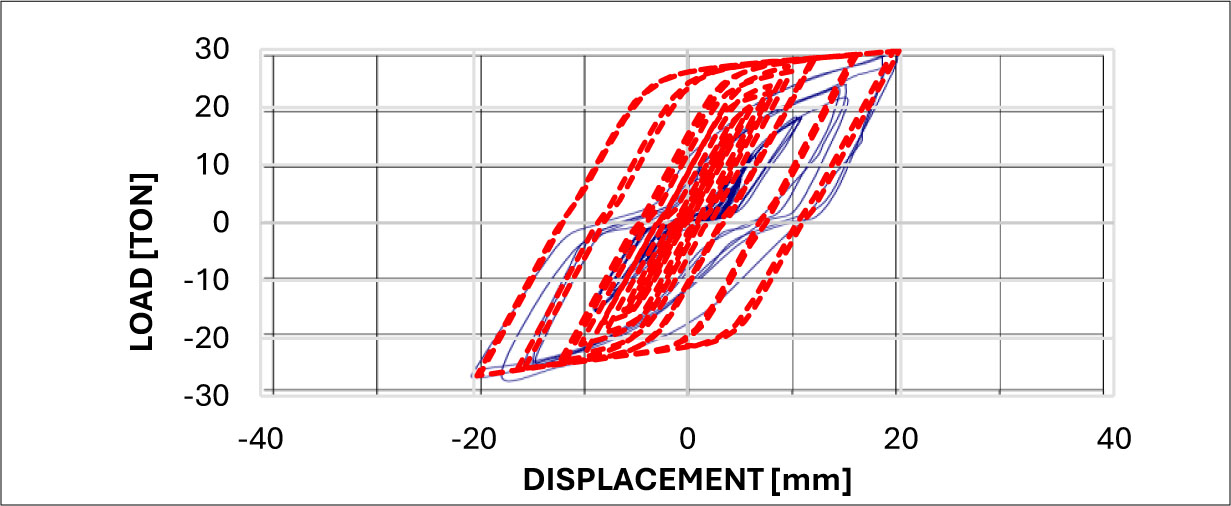
Figure 6:
Validation of Hysteretic Response: Experimental versus Numerical Simulation
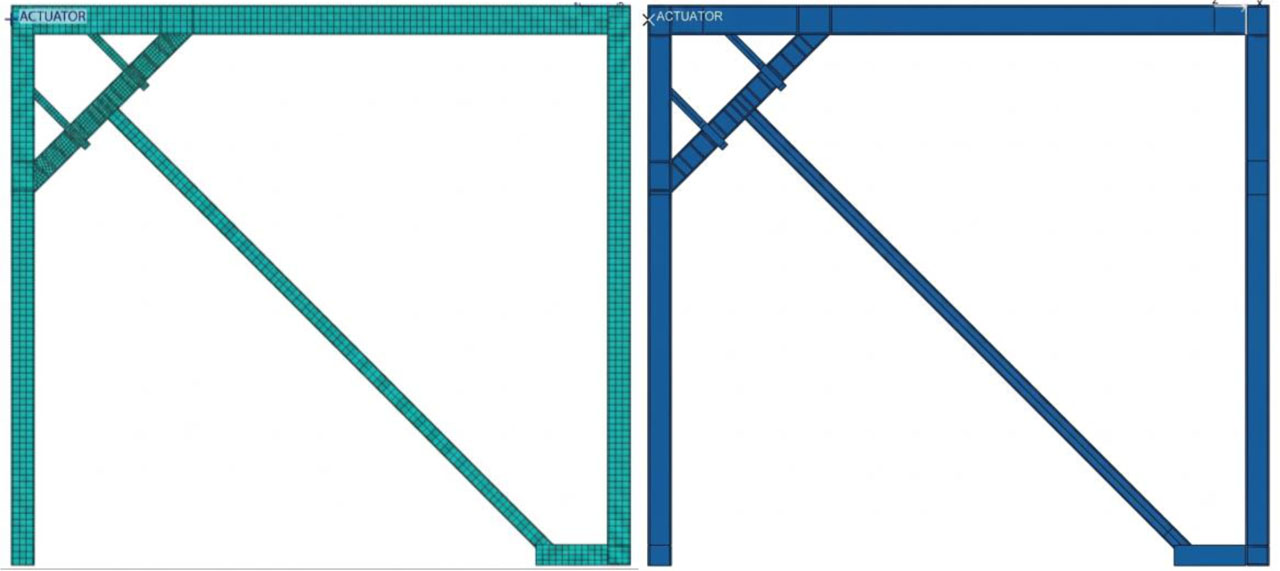
Figure 7:
Finite Element Model of Enhanced KBF System: Mesh (Left); Geometry (Right)
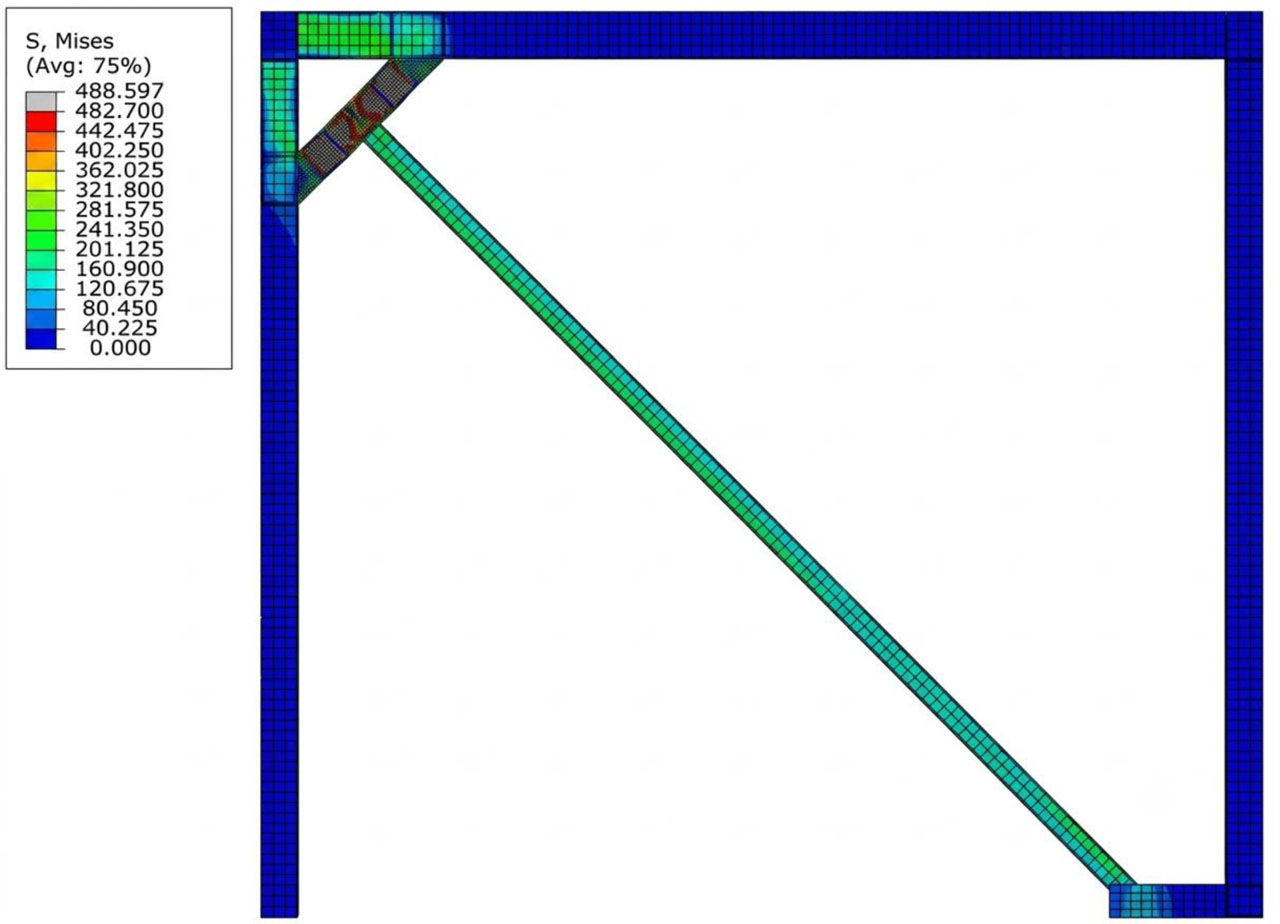
Figure 8:
von Mises Stress Distribution in KBF01-T Model
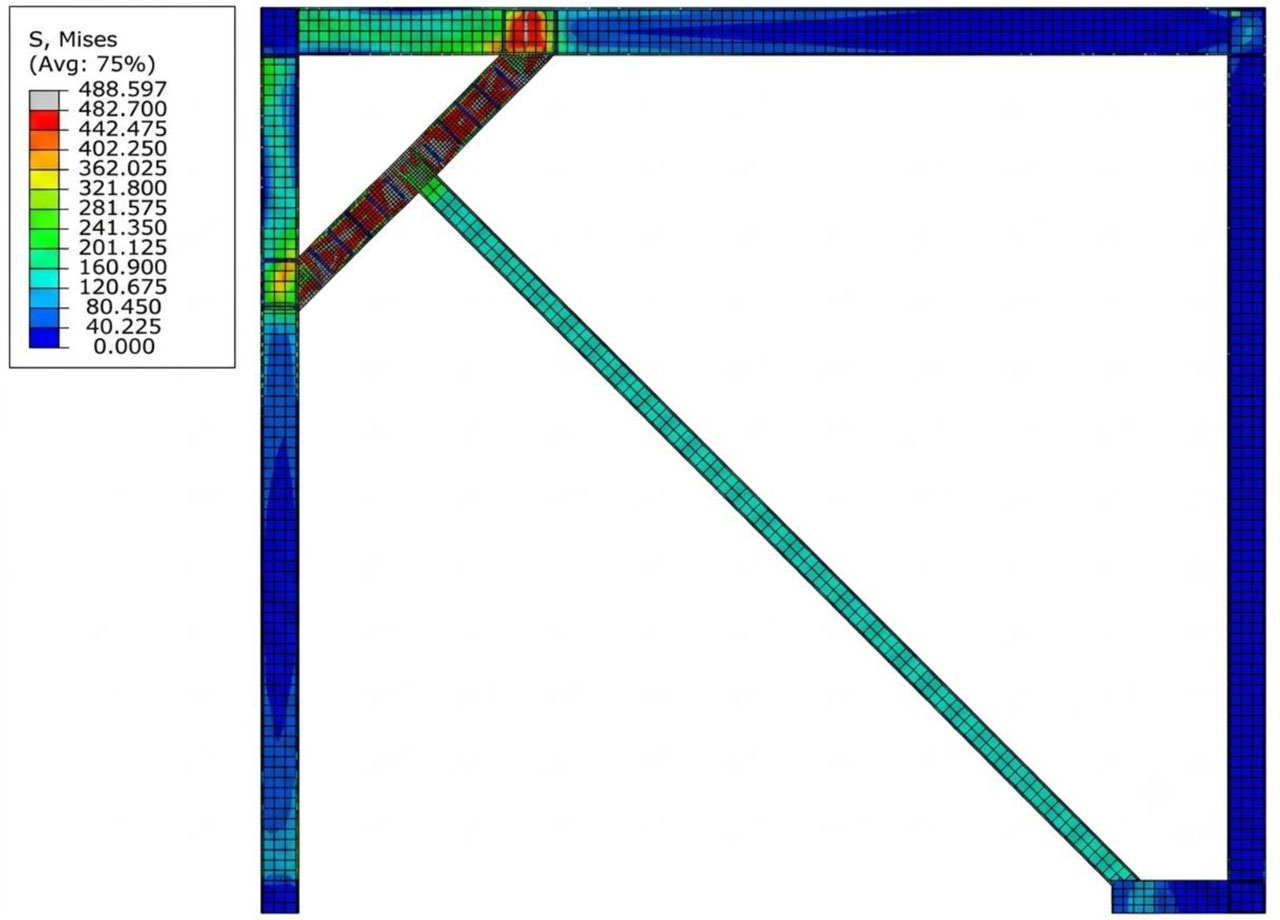
Figure 9:
von Mises Stress Distribution in KBF02-T Model
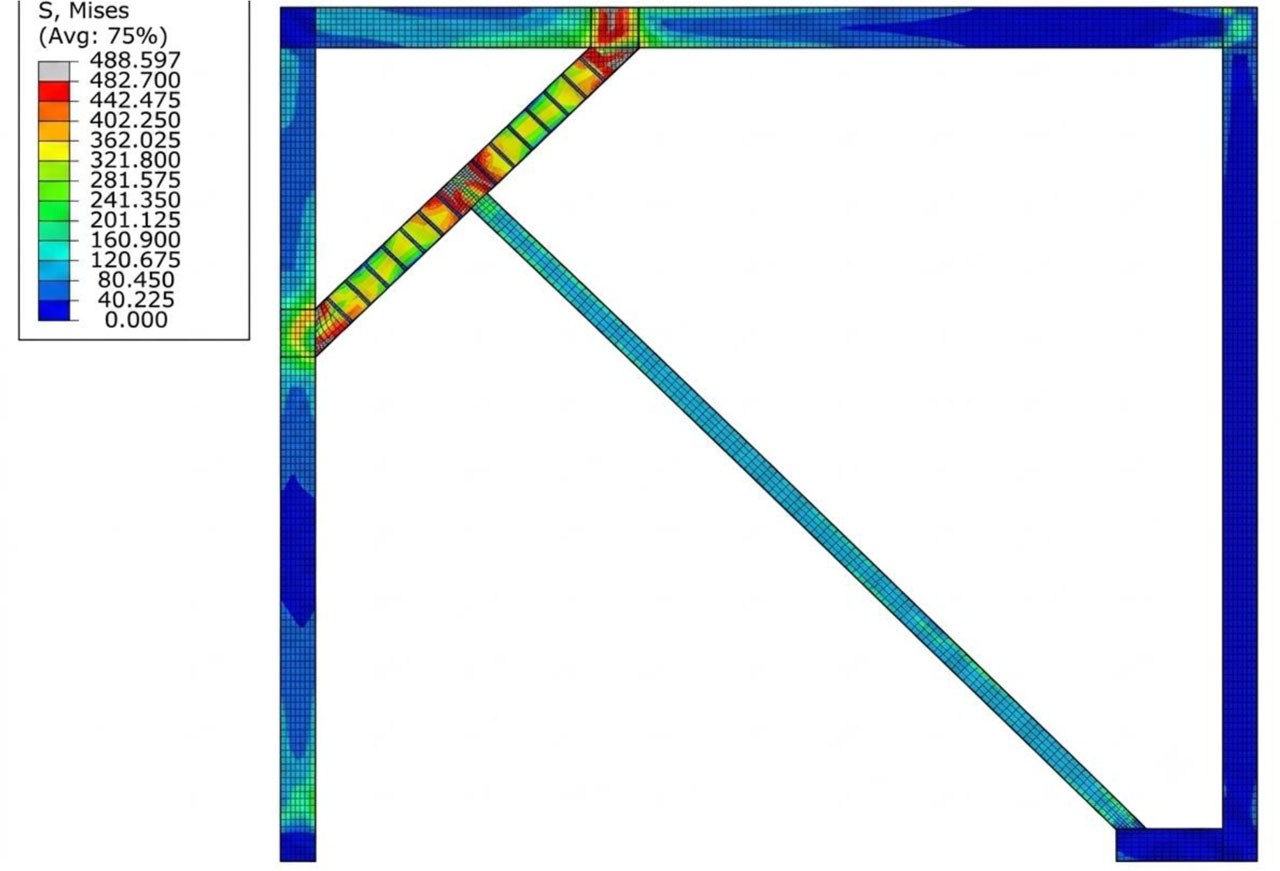
Figure10:
von Mises Stress Distribution in KBF03-T Model
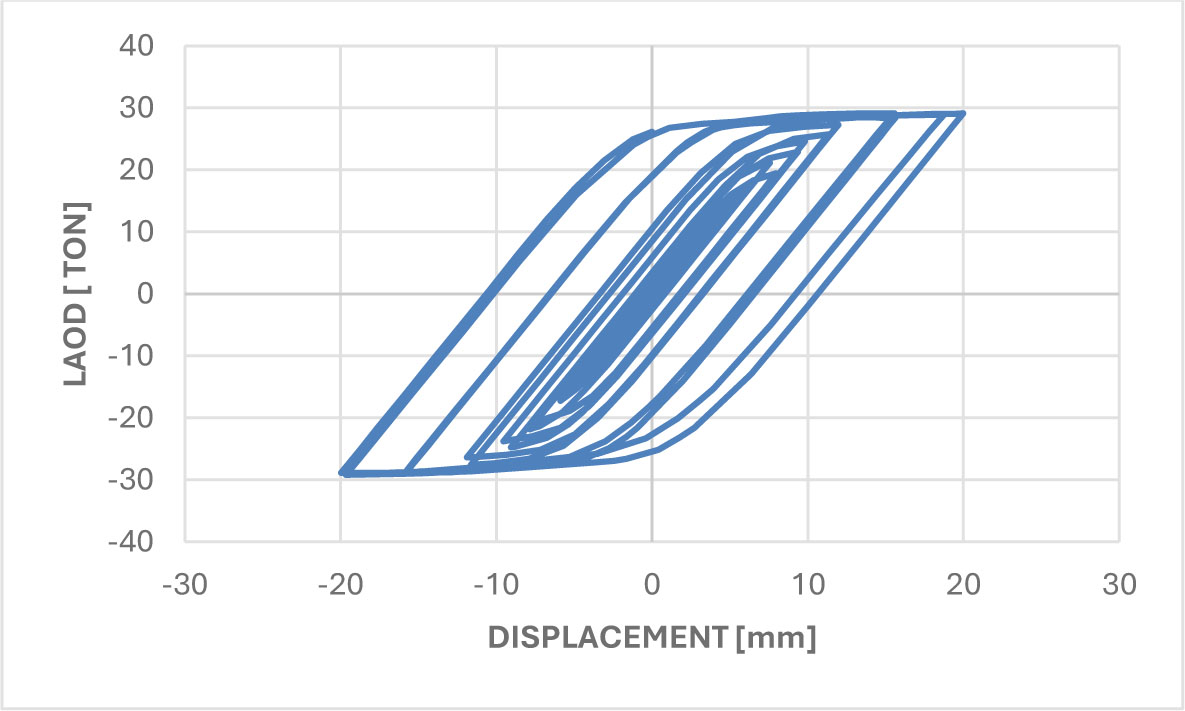
Figure 11:
Hysteretic Response of KBF01-T Under Quasi-Static Cyclic Loading
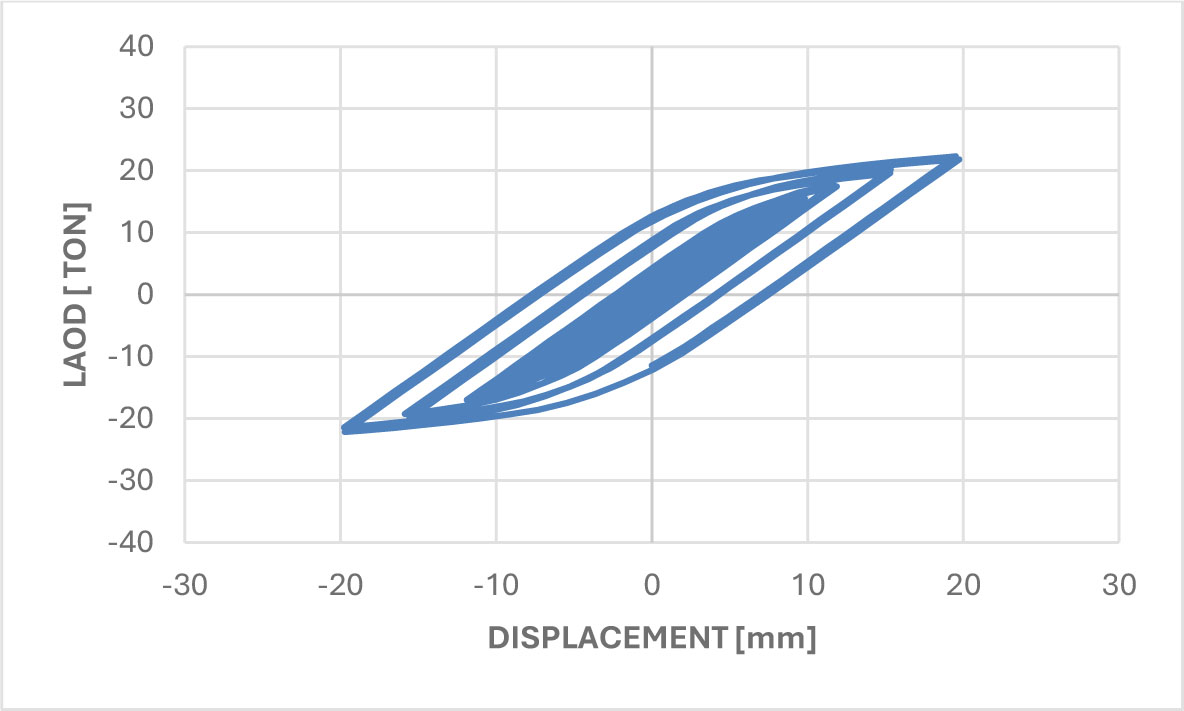
Figure12:
Hysteretic Response of KBF02-T Under Quasi-Static Cyclic Loading
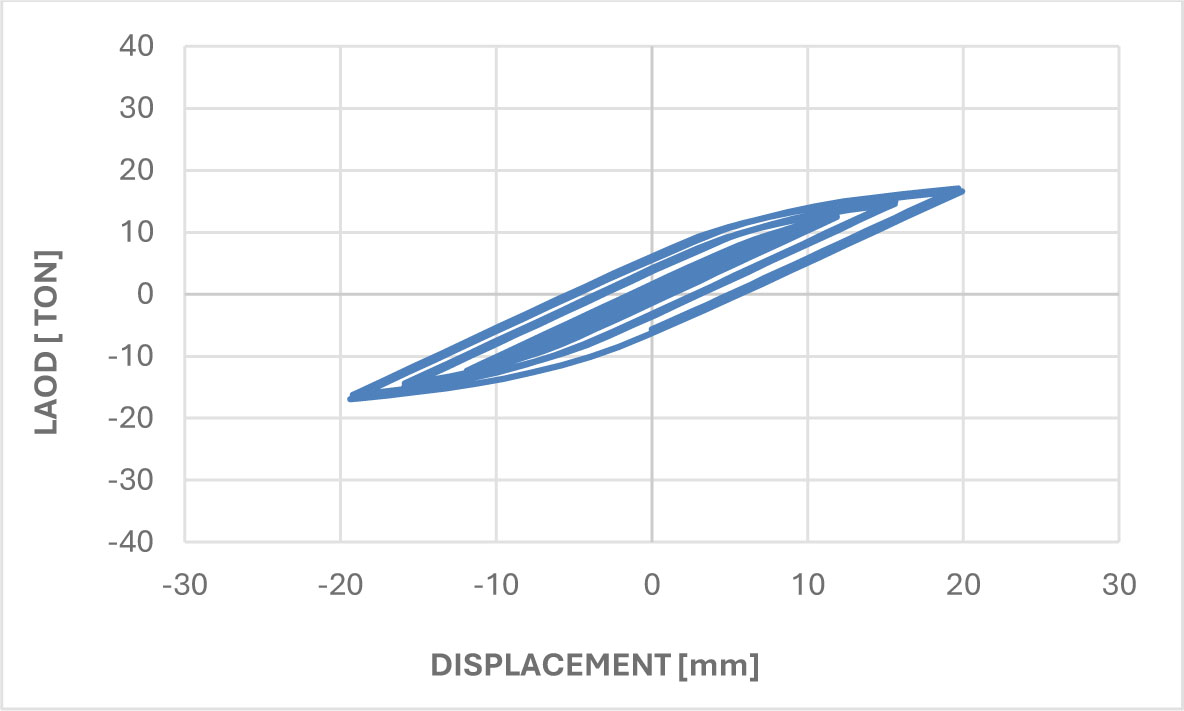
Figure13:
Hysteretic Response of KBF03-T Under Quasi-Static Cyclic Loading
Table 3:
Structural Performance Degradation: Stiffness and Energy Dissipation Ratios
| SAMPLE | FORCE [TON] | RATIO [%] | ENERGY [KN.M] | RATIO [%] |
|---|---|---|---|---|
| KBF01-T | 29 | 100 | 46.36 | 100 |
| KBF02-T | 22 | 77 | 20.53 | 44 |
| KBF03-T | 17 | 59 | 9.85 | 21 |
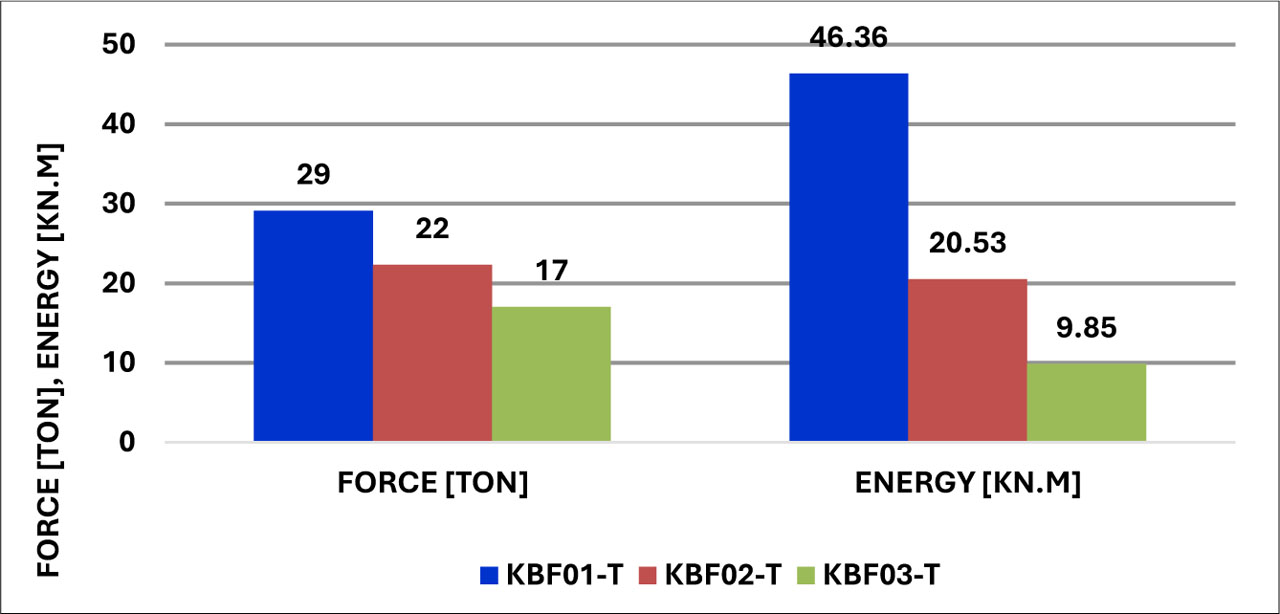
Figure 14:
Performance Degradation: Stiffness and Energy Dissipation Ratios
Table 4:
Geometric and Material Properties of Supplemental Supports in Enhanced KBF System
| Sample | H [mm] | B [mm] | W [mm] | F [mm] | D [mm] | S [mm] | Fy [Mpa] | Fu [Mpa] |
|---|---|---|---|---|---|---|---|---|
| KNF01-N | 188 | 92 | 6 | 17 | 7 | 260 | 333.9 | 482.7 |
| KNF02-N | 194 | 92 | 6 | 17 | 10 | 520 | 333.9 | 482.7 |
| KNF03-N | 194 | 92 | 6 | 17 | 10 | 690 | 333.9 | 482.7 |
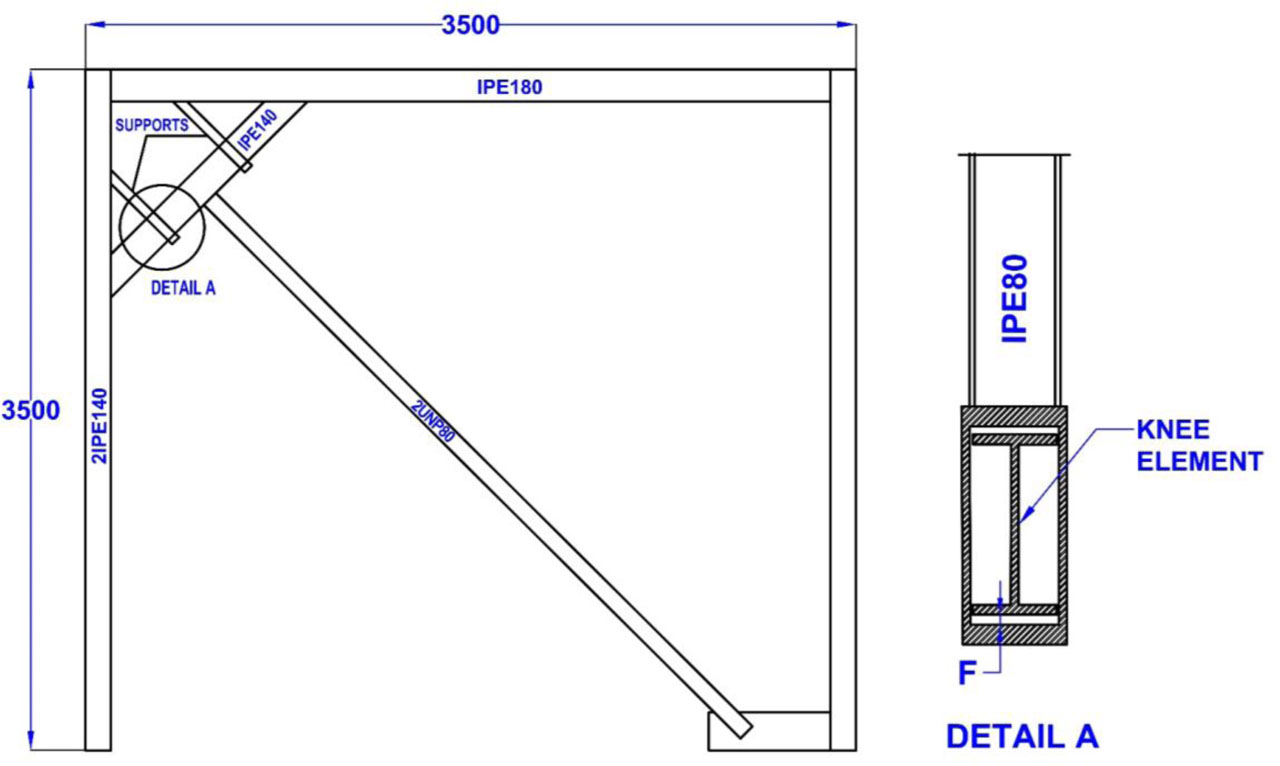
Figure 15:
Proposed dual-phase knee-braced frame (KBF-N) system
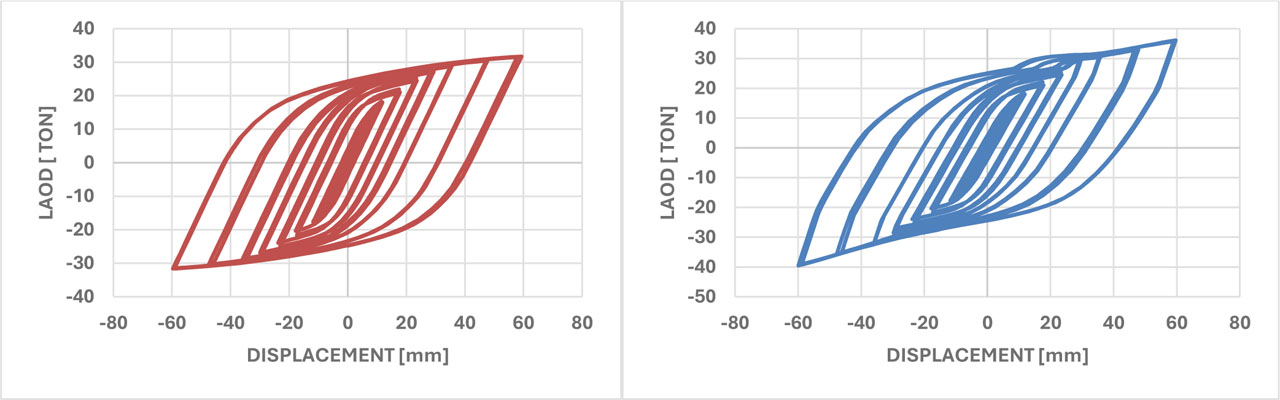
Figure 16:
Comparative Hysteresis Response: (Left) Conventional KBF02-T and (Right) Enhanced KBF02-N
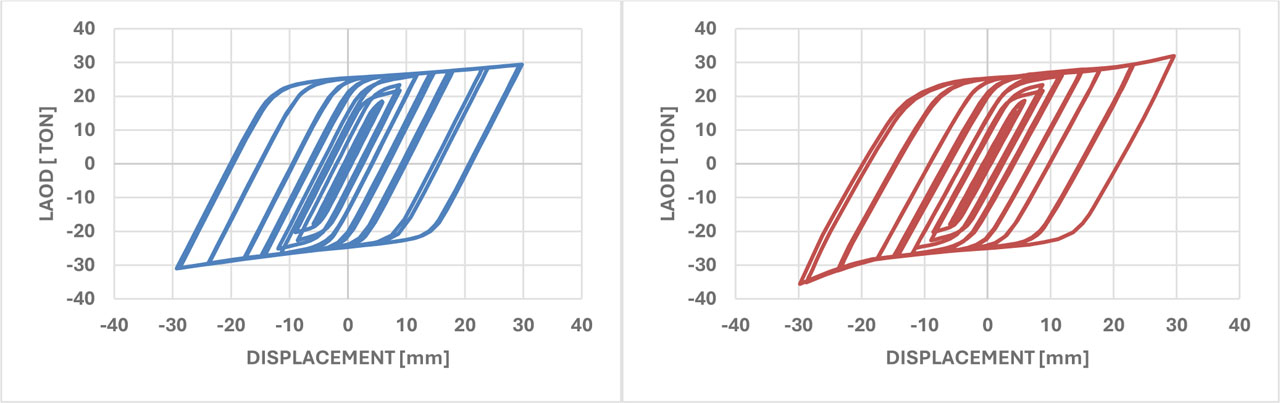
Figure 17:
Comparative Hysteresis Response: (Left) Conventional KBF01-T and (Right) Enhanced KBF01-N
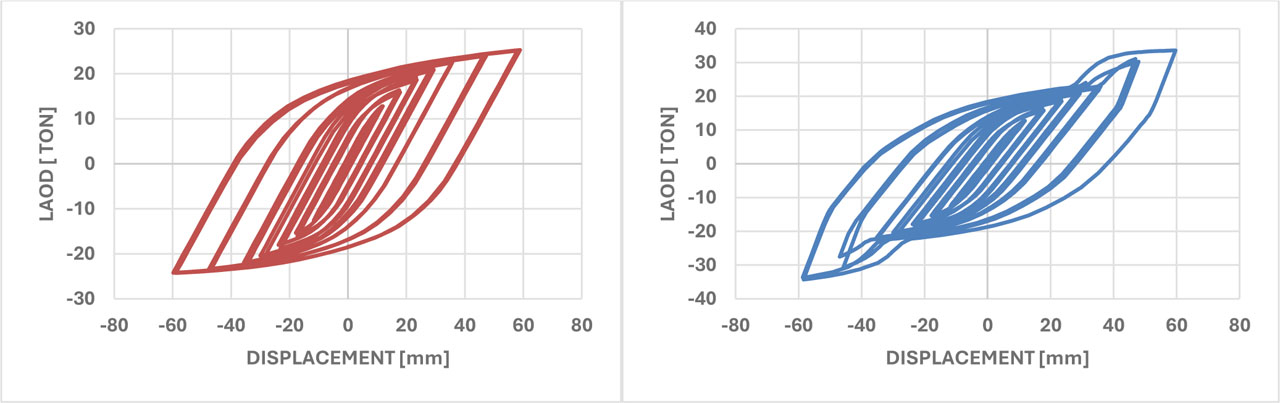
Figure 18:
Comparative Hysteresis Response: (Left) Conventional KBF03-T and (Right) Enhanced KBF03-N
Table 5:
Stiffness Enhancement in Conventional versus Novel KBF Systems
| SAMPLE | FORCE [TON] | RATIO [%] |
|---|---|---|
| KBF01-T | 31 | 13 |
| KBF01-N | 36 | |
| KBF02-T | 32 | 20 |
| KBF02-N | 40 | |
| KBF03-T | 25 | 26 |
| KBF03-N | 34 |
Table 6:
Gravitational Load Calculation
| Materials | Mass per unit volume [Kgf/m3] | Thickness [m] | Unit weight of surface [kgf/m2] |
|---|---|---|---|
| Cement mosaic | 2250 | 0.02 | 45 |
| Sand-cement mortar | 2100 | 0.03 | 63 |
| Concrete slab | 2500 | 0.05 | 125 |
| Concrete beam | 2500 | 2x(0.1x0.25) | 125 |
| Concrete block | - | - | 100 |
| Gypsum and soil | 1600 | 0.02 | 32 |
| White gypsum | 1300 | 0.01 | 13 |
| 503 |
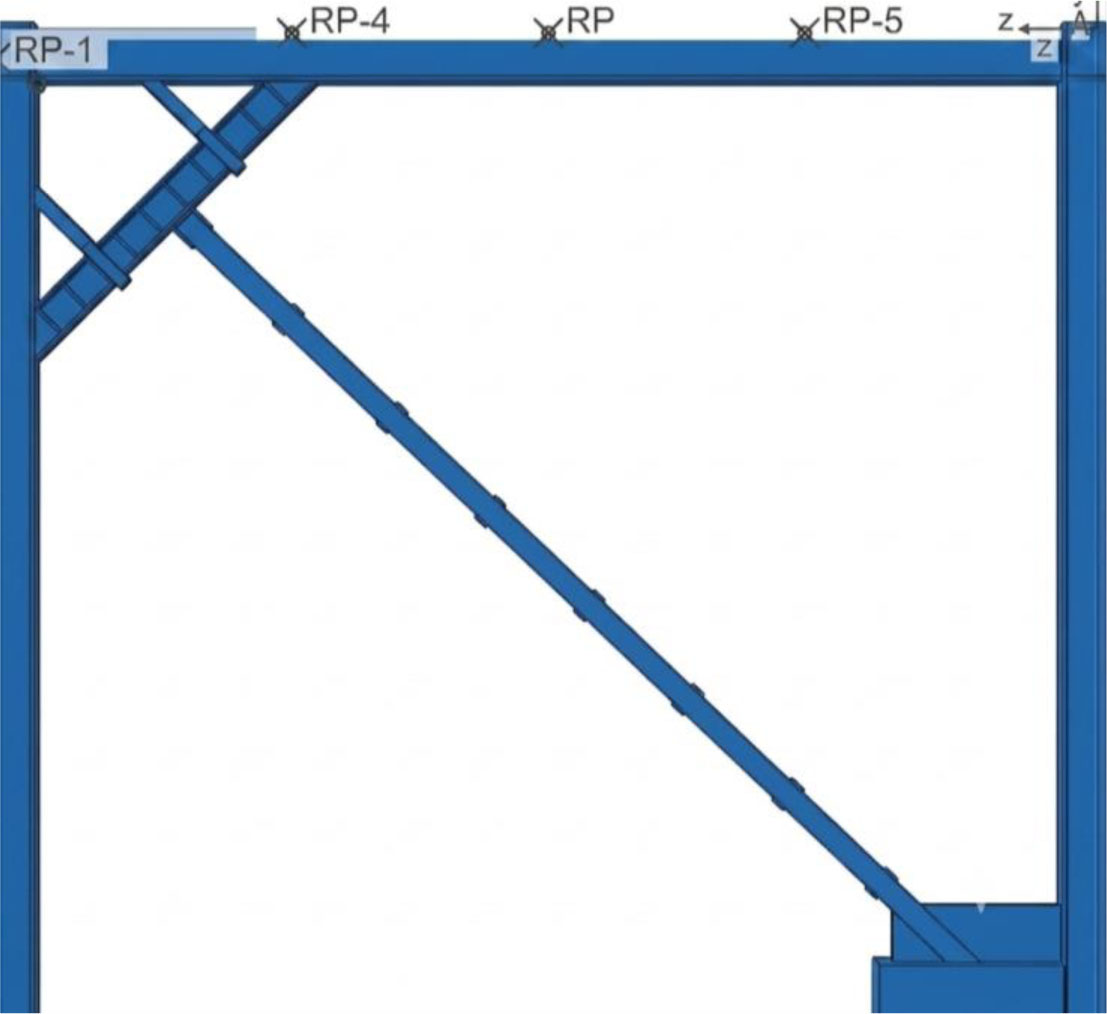
Figure 19:
Loading Configuration: Concentrated Load Application Points on Beam
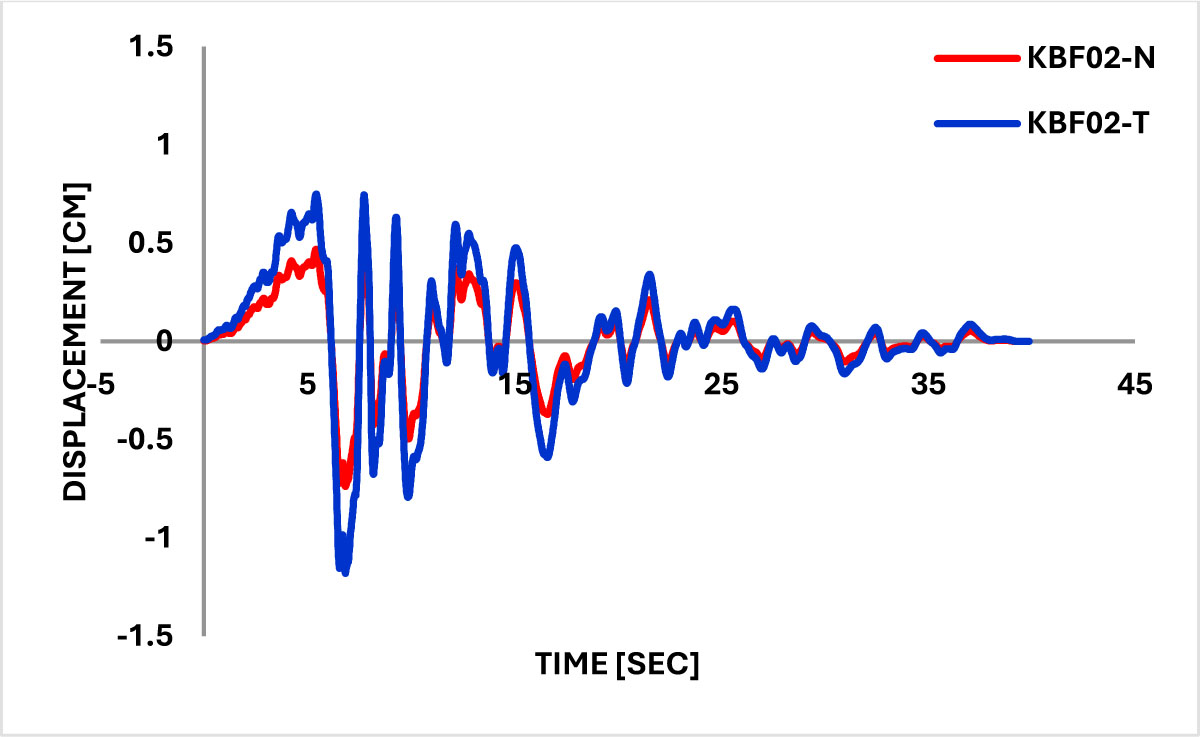
Figure 20:
Time-History Displacement Response: Enhanced vs. Conventional KBF Systems