

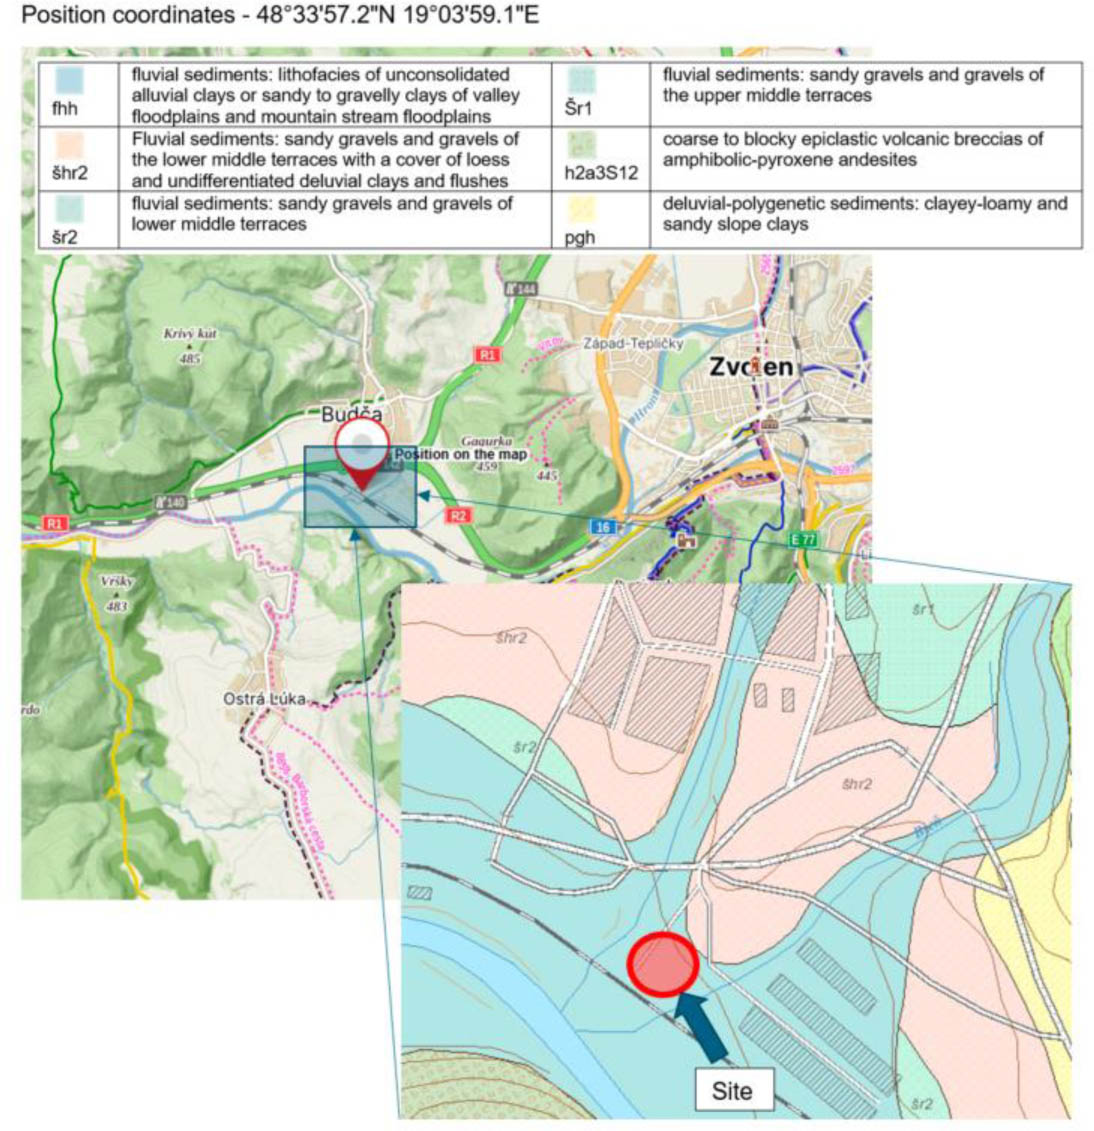
Figure 1:
Location of the testing site and general geological conditions (Gago et al. 2025)
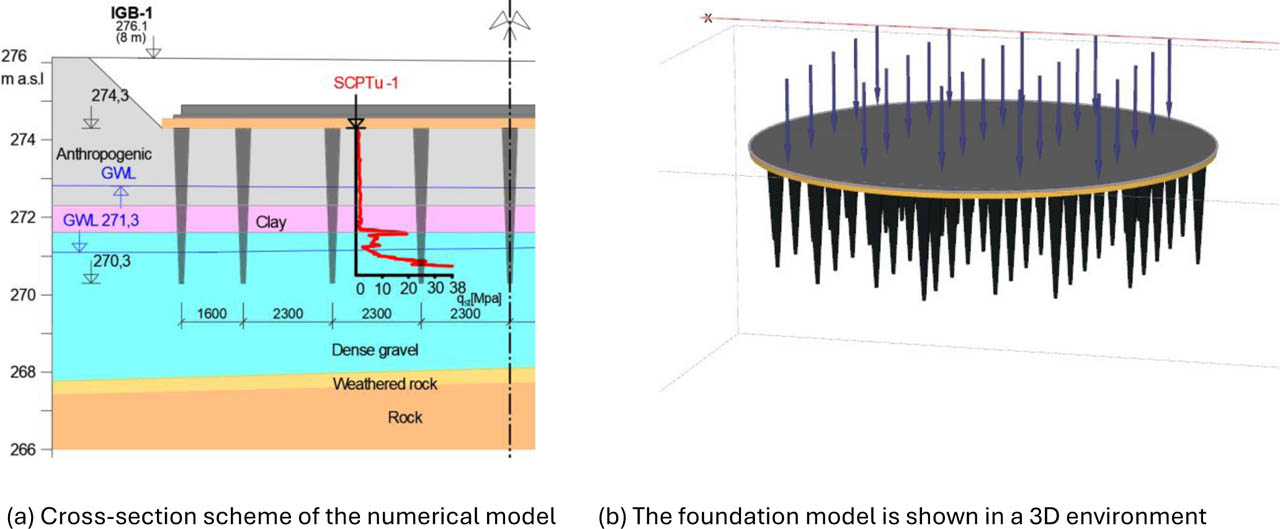
Figure 2:
Overview of numerical model compilation (Gago et al. 2025)
Table 1:
Overview of parameters used in the numerical model for MC model
| Name of layer | γun,sat [kN/m3] | E [MPa] | ν [-] | φ [°] | c [kPa] | ψ [°] | Rinter [-] |
|---|---|---|---|---|---|---|---|
| Anthropogenic | 20,5 | 6,0 | 0,4 | 18 | 18 | 0 | 0,7 |
| Clay | 20,5 | 6,0 | 0,4 | 18 | 18 | 0 | 0,7 |
| Dense gravel | 19,0 | 60,0 | 0,25 | 30 | 2 | 0 | 0,8 |
| Crushed gravel | 19,0 | 80,0 | 0,25 | 32 | 2 | 2 | 0,8 |
| Weathered Rock | 21,0 | 80,0 | 0,25 | 25 | 20 | 0 | 0,8 |
Table 2:
Overview of parameters used in the numerical model for HS model
| Name of layer | γun,sat [kN/m3] | E50ref [MPa] | Eeoedref [MPa] | Eurref [MPa] | m [-] | φ [°] | c [kPa] | ψ [°] | Rinter [-] |
|---|---|---|---|---|---|---|---|---|---|
| Anthropogenic | 20,5 | 6,0 | 6,0 | 18,0 | 0,7 | 18 | 18 | 0 | 0,7 |
| Clay | 20,5 | 6,0 | 6,0 | 18,0 | 0,7 | 18 | 18 | 0 | 0,7 |
| Dense gravel | 19,0 | 60,0 | 60,0 | 180,0 | 0,5 | 30 | 2 | 2 | 0,8 |
| Crushed gravel | 19,0 | 80,0 | 80,0 | 240,0 | 0,5 | 32 | 2 | 2 | 0,8 |
| Weathered Rock | 21,0 | 80,0 | 80,0 | 240,0 | 0,5 | 25 | 20 | 0 | 0,8 |
Table 3:
Table showing the measurement period and fill level over time
| Stages of measurements | Level of fulfilment [%] | Time line [h] |
|---|---|---|
| 1. | 0 (0.00 kPa) | 0 |
| 2. | 25 (13.75 kPa) | 72 |
| 3. | 50 (27,50 kPa) | 144 |
| 4. | 75 (41.25 kPa) | 216 |
| 5. | 100 (55.00 kPa) | 312 |
| 6. | 100 (55.00 kPa) | 528 |
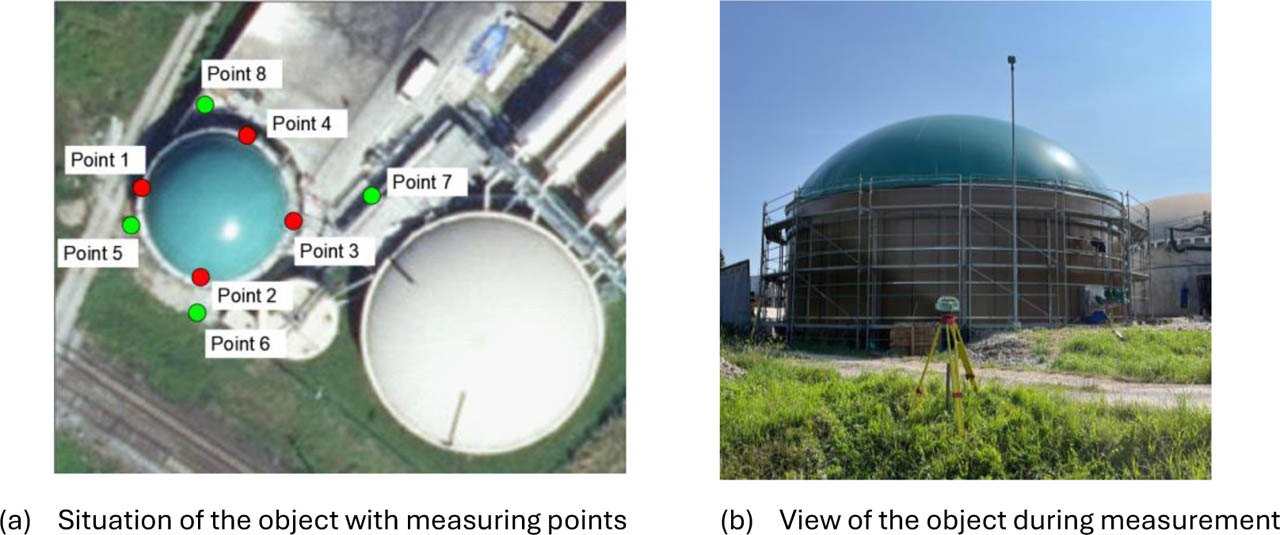
Figure 3:
Measured points and observed object
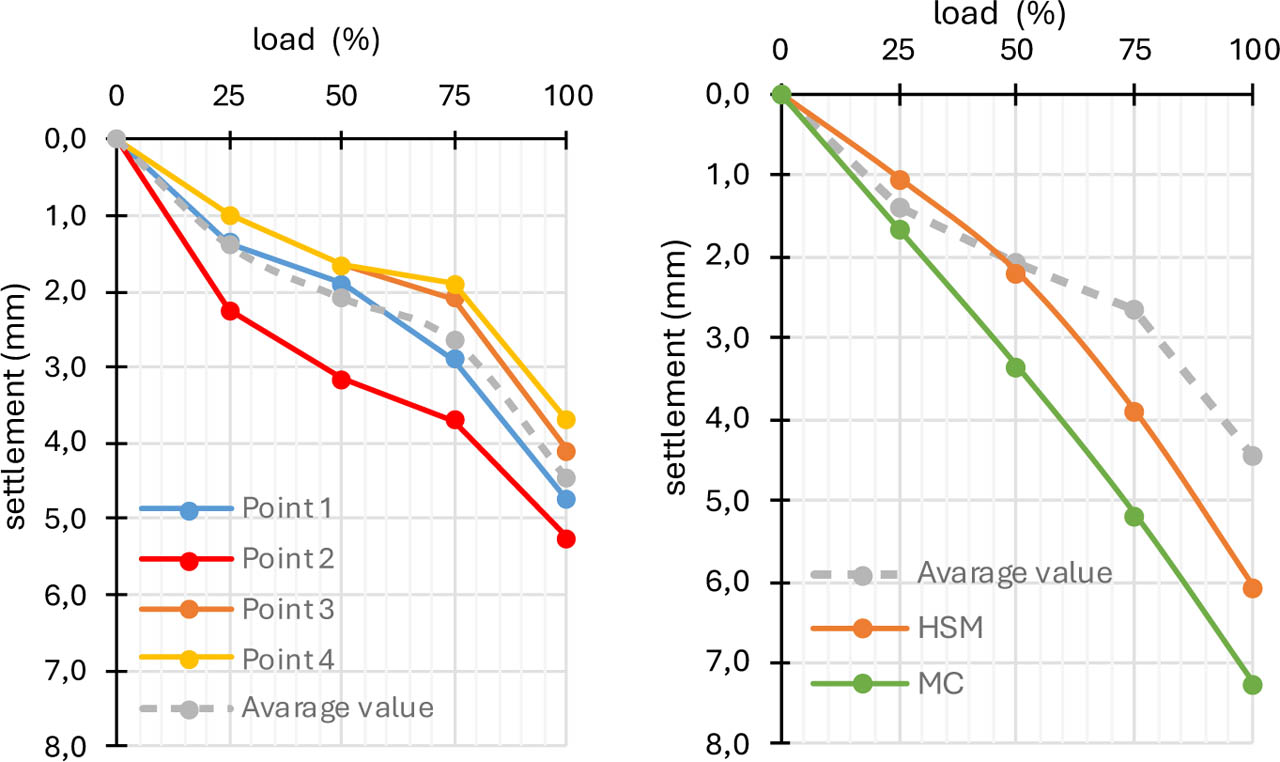
Figure 4:
Measurement field results