

1. Introduction
Biogas stations are important industrial facilities whose design and operational loads place specific demands on the design and implementation of foundation structures. The main structural elements of a biogas plant, especially fermenters and storage tanks, are large, often exceeding 20 meters in diameter and several tens of meters in height, which generates significant vertical loads on the foundation structures (Valašková and Vlček 2018). In addition to the static load from the weight of the structure itself and the stored material, the foundations are also subject to dynamic effects arising from the filling and emptying of tanks, thermal expansion of materials and, in many regions, seismic loads (Herbut et. al 2020). From a geotechnical point of view, these structures have similar characteristics to industrial silos, storage tanks, and large-capacity liquid tanks, which allows the application of analogous principles for foundation design and monitoring of their behaviour (Muszyński and Rybak, 2021). The issue of foundation settlement is a critical aspect that significantly affects the long-term functionality and safety of buildings. Uneven settlement can lead to loss of circularity of tanks, stress concentrations in structural elements, cracking of welded joints, loosening of anchor bolts, deformation of drain openings, and in extreme cases, even the risk of the entire structure overturning. In his dissertation focused on the development and innovation of technologies for monitoring deformations of engineering structures using high-precision measurement techniques. Beshr (2015) presented the monitoring of a large oil storage tank using a total station and demonstrated that geodetic methods can provide accurate results when monitoring the movements and settlement of tanks. Similarly, Beshr (2012) published a monograph on the monitoring of structural deformation of reservoirs, in which they systematically developed a methodology for the application of precise levelling and total station measurement for the detection of settlement and deformation trends.
Experience gained from monitoring industrial foundations provides valuable insights that can be applied to biogas plants. Research conducted in Ukraine presented a comprehensive approach to assessing the technical condition of the soil-foundation-silo system and highlighted the absence of standardized diagnostic methods for silo foundations, which complicates the prediction of remaining service life and ensuring safe operation (Vynnykov et al. 2025). The proposed two-level methodology combined analytical checks, finite element modelling, and field geodetic monitoring. The scientific contribution of the study was the development of an integrated diagnostic procedure with quantitative thresholds for key indicators such as settlement, tilt, and crack width, which enabled the algorithmic classification of silos according to technical condition categories. The practical effectiveness of the methodology was confirmed by a case study of a group of metal silos with a diameter of 23.78 m on unstable soils, where the decisive influence of the condition of the compacted backfill on stress distribution and deformation unevenness was identified. Yang et al. (2025) published at the end of 2025 focused on optimizing the design of pile foundations for large-scale silos using genetic algorithms. The project involved the construction of a new coal storage silo at a thermal power plant with a diameter of 33.60 m, a total height of 41.95 m, and a storage capacity of 25,000 tons. The pile foundation consisted of 178 bored piles with a diameter of 1.0 m, with a minimum pile length calculated at 13.3 m. The proposed method enabled coordinated optimization of topology, geometry, and dimensions, providing a clear and effective design framework for cost-effective pile foundations with settlement control. The permissible settlement value for the foundations was set at 200 mm, while the calculated tilt value between the different modules had to meet strict stability criteria (Yang et. al 2025). Geodetic methods provide a fundamental tool for the quantitative assessment of foundation behaviour during construction and operation. Modern total stations, especially robotic systems such as Leica TS30 and Trimble S6, achieve submillimetre measurement accuracy at distances up to 100 m, enabling the detection of even minimal vertical and horizontal displacements. In his work on deformation monitoring using total stations, Azeez et. al (2018) presented the results of static tests that confirmed the high accuracy of modern instruments, with accuracy values of 0.1 mm for the TS30 and 0.2 mm for the S6 achieved for distances less than 100 meters. The advantage of total stations is the possibility of continuous automated monitoring with high measurement speed, which allows even dynamic changes in the structure to be captured (Ižvoltová and Koťka 2014). The processing of measurement results may be subject to statistical evaluation, as used by Astill et al. (2014).
The integration of geodetic methods into the design, construction, and operation of biogas plants is a prerequisite for ensuring the long-term reliability and safety of these facilities. Systematic monitoring enables the early detection of adverse settlement trends, allowing preventive measures to be taken before critical deformation values are reached. This work presents the application of geodetic measurements during the construction of a specific biogas plant to verify the effectiveness of the designed foundation structures using FEM analysis, thereby providing a basis for optimizing the design of similar future structures.
2. Methodology
This study employs precise geodetic levelling measurements to verify the actual settlement behaviour of a biogas digester foundation system consisting of driven piles, compacted crushed gravel, and a concrete slab. A system of four reference points was established on surrounding stable structures (lightning rod foundations and concrete pavement), while four observation points were installed directly on the concrete foundation slab using chemical anchors. Precise levelling using a Leica LS15 instrument with an invar staff (guaranteed accuracy 0.20 mm) was conducted during five loading steps as the digester was progressively filled to 25%, 50%, 75%, and 100% capacity. The measurement methodology followed STN 731002 standards, where settlement was considered stabilized when vertical displacement increments did not exceed 0.05 mm over 15 minutes. Settlement data from each loading stage were processed to create load-settlement diagrams and compared with finite element predictions from PLAXIS 3D to validate the foundation design assumptions. The area of interest is near Budča village and is located between road E50 and the railway line, near the town of Zvolen. The Hron river flows around the site from the south side Fig. 1.
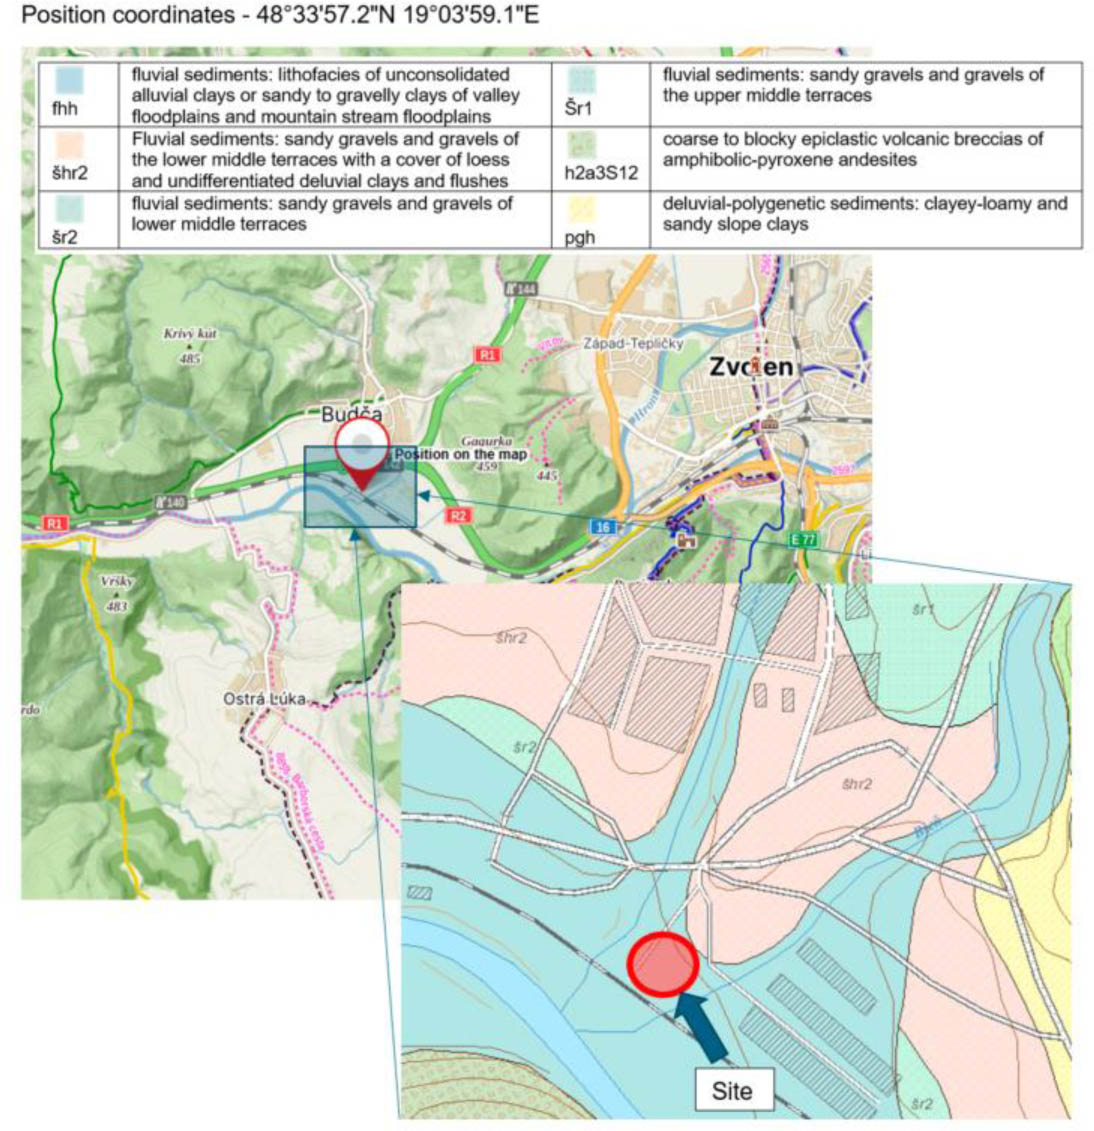
Figure 1:
Location of the testing site and general geological conditions (Gago et al. 2025)
2.1. Materials and Methods
The biogas digester foundation system consists of 49 driven prefabricated concrete piles arranged in a regular grid pattern, overlain by a 250 mm layer of compacted crushed gravel (fraction 0–63 mm), and topped with a 500 mm thick reinforced concrete slab. The compacted soil layer was verified by the LDD100 test, as in the study by Ižvolt et al. (2024). The original geological structure of the land consists of Quaternary sediments and is made up mostly of fluvial sediments of the nearby Hron river. It is represented by predominantly heterogeneous gravels, sandy clay to clay, with the occurrence of medium to coarse grains with a diameter of 2 to 10 cm in diameter. In the petrographic composition, granitoid rocks predominate, while crystalline shale and andesite are less represented. The surface of the gravel formation forms a cover of final loam, with a capacity of about 2–3.5 m. They are represented in the development of medium-plastic loams and clay soils. Neogene volcanic rocks are discordant and deposited on an older Mesozoic bedrock. Hydrogeological conditions are a reflection of the geological structure of the territory, and their determining factor is the power and permeability of Quaternary gravel sediments. The groundwater pressure level in the area is 5 m below the surface of the ground. The main horizon of the aquifer is gravel, which is fed by surface flows, further from the slopes and from precipitation. The free groundwater level is 3.0 m below the surface of the ground (Gago et al. 2025). Loading was applied in five steps (0%, 25%, 50%, 75% and 100%) by progressively filling the digester with process water from the biogas plant, with settlement measurements conducted when vertical displacement stabilized to less than 0.05 mm per 15 minutes per STN 731002. The maximum applied load of 55 kPa surface pressure plus 7,8 kN/m perimeter loading corresponded to the full operational capacity of the digester, with measurements extending over 26 days to capture both immediate and time-dependent settlement behaviour. Four observation points (Point 1–Point 4) were chemically anchored to the concrete slab surface along two perpendicular axes, while four reference points (Points 5–8) were established on adjacent stable structures outside the zone of influence. The geodetic monitoring utilized a Leica LS15 digital level with invar staff achieving ±0.20 mm precision per setup, with total levelling line misclosure not exceeding 0.40 mm, thus satisfying the requirements for very precise levelling (mH = 0.60 mm for n=4 setups) (Citra 2024).
2.2. Construction of a numerical 3D model
The model in geological space was created in the same way as in the studies by Mužík et al. (2015) Obradović et al. (2026). The finite element analysis of the biogas digester foundation system was performed using PLAXIS 3D software, a specialized geotechnical engineering platform capable of simulating complex soil-structure interaction problems. The computational model employed 10-noded tetrahedral elements, which provide quadratic shape functions and superior accuracy in representing stress and displacement fields compared to linear elements. The foundation design was developed using the Mohr-Coulomb and Hardening Soil constitutive models, as these are the most commonly used constitutive models for geotechnical structures (Waheed et al., 2024). The subsurface stratigraphy was modelled as a multi-layer system comprising anthropogenic deposits (3.5 m thick), fluvial sandy clay to clay sediments with fine-grained admixtures (0,7 m thick) , dense gravel layers (3.8 m thick), weathered rock (0.4m thick) extending to depths sufficient to eliminate boundary effects. Cross section and 3D model are on the Fig. 2.
The geometric configuration of the model replicated the actual foundation system, including a circular concrete slab with 18 meters diameter and 500 mm thickness, 49 driven prefabricated concrete piles arranged in a regular grid pattern, and a 250 mm compacted crushed gravel layer between pile heads and the slab. The length of the pipe was 4 m, the dimensions of the head were 500 x 500 mm, and the dimensions of the base were 120 x 120 mm.
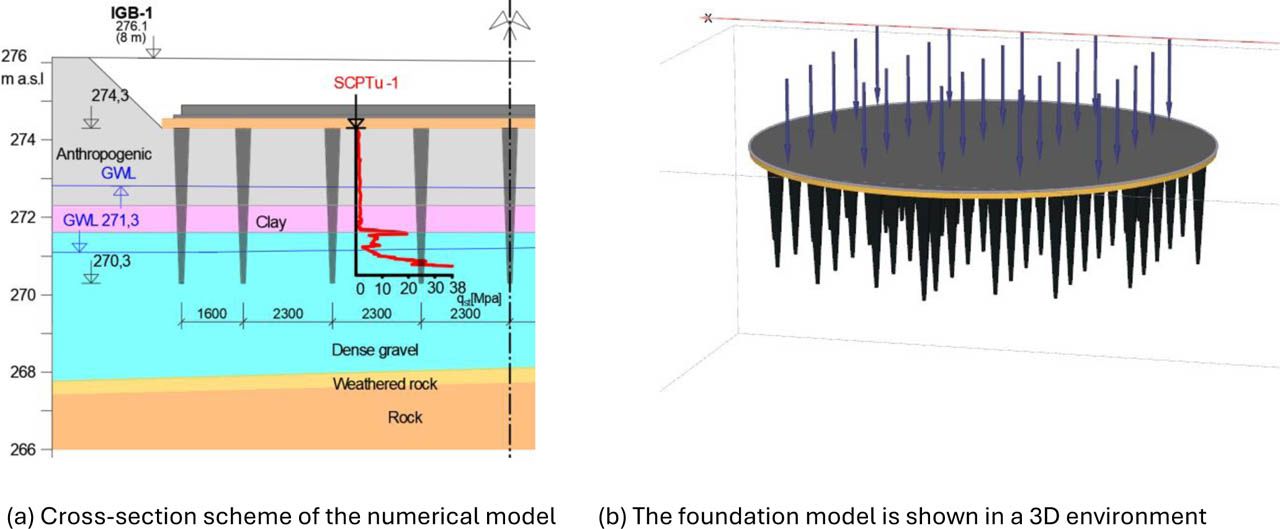
Figure 2:
Overview of numerical model compilation (Gago et al. 2025)
The finite element analysis performed in PLAXIS 3D is governed by fundamental equations of continuum mechanics and soil plasticity. This section presents the mathematical framework underlying the numerical model, including equilibrium conditions, constitutive relationships, and convergence criteria. The global finite element system is expressed through the discrete equilibrium equation:
where:K – global stiffness matrix [kN/m],
u – vector of nodal displacements [m],
F – vector of applied nodal forces [kN].
Element stiffness matrix for 10-noded tetrahedral elements employed in the mesh, the element stiffness matrix is derived from the strain energy principle:
where:B – strain-displacement matrix,
D – constitutive material stiffness matrix [MPa],
V – element volume [m3].
The Mohr-Coulomb failure criterion defines the shear strength of soil materials as a linear function of normal stress:
where:τ – shear stress on the failure plane [kPa],
c – effective cohesion [kPa],
σ – effective normal stress [kPa],
ϕ – effective angle of internal friction [°].
The yield function in principal stress space is expressed as:
where:σ1 – major principal stress [kPa],
σ3 – minor principal stress [kPa],
f – yield function value.
The Hardening Soil model accounts for stress-dependent stiffness through the following power law relationship:
where:E50 – secant stiffness modulus at 50% strength [MPa],
E50ref – reference stiffness modulus at reference stress [MPa],
pref – reference stress (typically 100 kPa),
m – power exponent for stress-level dependency (typically 0.5–1.0).
Interface elements between the concrete slab and aggregate layer, as well as pile-soil interfaces, employ reduced strength parameters:
where:Rinter – interface strength reduction factor (0.7–0.8 in this study),
cinter – interface cohesion [kPa],
ϕinter – interface friction angle [°],
csoil, ϕsoil – soil strength parameters [kPa].
Rinter was determined based on empirical experience from similar numerical solutions. The initial stress state prior to foundation construction is established using the K0 procedure:
where:σv – vertical effective stress [kPa],
σh – horizontal effective stress [kPa],
γi – unit weight of soil layer i [kN/m3],
hi – thickness of soil layer i [m],
K0 – coefficient of lateral earth pressure at rest.
The iterative solution process continues until the following convergence criteria are satisfied:
where:{Fext} – external force vector [kN],
{Fint} – internal force vector [kN],
Δu – displacement increment [m],
// . // – Euclidean norm operator.
These tolerance values ensure that both force equilibrium and displacement compatibility are achieved within acceptable numerical accuracy. The combination of Mohr-Coulomb and Hardening Soil constitutive models, together with appropriate interface formulations and convergence criteria, enabled accurate simulation of the complex soil-structure interaction behaviour observed during the load testing program. Mesh generation was performed using automatic refinement algorithms with local densification around pile elements and the slab perimeter where stress gradients were anticipated to be highest. The final mesh comprised 35,520 soil elements and 48,766 nodes, with element sizes ranging from a minimum 0.1096 m near critical zones to maximum 7.217 m in far-field regions, yielding an average element size of 1.096 m. Mesh quality metrics were verified to ensure aspect ratios and element distortions remained within acceptable limits to prevent numerical instabilities and maintain solution accuracy. The Mohr-Coulomb constitutive model was assigned to all soil layers, providing a robust representation of shear strength behaviour governed by friction angle (φ) and cohesion (c) parameters derived from cone penetration testing. The concrete foundation slab was modelled as a plate element with linear elastic material properties, including Young's modulus E = 30 GPa, Poisson's ratio ν = 0.20, and unit weight γ = 24 kN/m3, with bending stiffness calculated from the 500 mm plate thickness. Driven piles were modelled as volumetric elements, allowing load transfer to surrounding soil through interface elements with explicit geometric representation of pile shafts. Interface elements with reduced strength parameters (Rinter) were defined between the concrete slab and crushed gravel layer, and between soil layers to simulate realistic slip and separation behaviour at material boundaries Stacho et al. (2019). The model also included a construction pit during each phases. The input values for the Mohr-Coulomb model are summarized in Table 1, and the input values for the hardening soil model are summarized in Table 2.
Table 1:
Overview of parameters used in the numerical model for MC model
| Name of layer | γun,sat [kN/m3] | E [MPa] | ν [-] | φ [°] | c [kPa] | ψ [°] | Rinter [-] |
|---|---|---|---|---|---|---|---|
| Anthropogenic | 20,5 | 6,0 | 0,4 | 18 | 18 | 0 | 0,7 |
| Clay | 20,5 | 6,0 | 0,4 | 18 | 18 | 0 | 0,7 |
| Dense gravel | 19,0 | 60,0 | 0,25 | 30 | 2 | 0 | 0,8 |
| Crushed gravel | 19,0 | 80,0 | 0,25 | 32 | 2 | 2 | 0,8 |
| Weathered Rock | 21,0 | 80,0 | 0,25 | 25 | 20 | 0 | 0,8 |
Table 2:
Overview of parameters used in the numerical model for HS model
| Name of layer | γun,sat [kN/m3] | E50ref [MPa] | Eeoedref [MPa] | Eurref [MPa] | m [-] | φ [°] | c [kPa] | ψ [°] | Rinter [-] |
|---|---|---|---|---|---|---|---|---|---|
| Anthropogenic | 20,5 | 6,0 | 6,0 | 18,0 | 0,7 | 18 | 18 | 0 | 0,7 |
| Clay | 20,5 | 6,0 | 6,0 | 18,0 | 0,7 | 18 | 18 | 0 | 0,7 |
| Dense gravel | 19,0 | 60,0 | 60,0 | 180,0 | 0,5 | 30 | 2 | 2 | 0,8 |
| Crushed gravel | 19,0 | 80,0 | 80,0 | 240,0 | 0,5 | 32 | 2 | 2 | 0,8 |
| Weathered Rock | 21,0 | 80,0 | 80,0 | 240,0 | 0,5 | 25 | 20 | 0 | 0,8 |
Boundary conditions included fixed horizontal and vertical displacements at the model base (at depth sufficient to reach competent stratum), horizontal fixity on vertical side boundaries, and free surface conditions at ground level. The phreatic surface (groundwater table) was defined based on site investigation data, influencing effective stress calculations and pore pressure distribution throughout the model domain Vynnykov et al. (2025) and Yang et al. (2025). This phenomenon could be verified by measuring pore pressures in situ conditions, as was done in the study by Chebeň et al. (2015) or Yilmaz et al. (2014). Gravity loading was applied in the negative Z-direction with standard earth gravity acceleration of 9.81 m/s2, establishing initial geostatic stress conditions prior to foundation construction. The analysis procedure was divided into three distinct calculation phases:
○ Initial Phase 1 using K0 procedure to generate in-situ stress state,
○ Phase 2 (staged construction) activating piles, aggregate layer, and concrete slab,
○ Phase 3 (staged construction) applying operational loads.
Loading conditions in Phase 2 consisted of uniformly distributed pressure of 55 kPa over the entire slab area representing filled digester contents, plus a perimeter line load of 7.8 kN/m simulating the cylindrical wall self-weight and connection details. The model was calibrated against field data from three cone penetration tests conducted at the site, with soil stiffness parameters adjusted to match measured penetration resistance profiles. Drainage conditions were specified as drained for all soil layers, reflecting the predominantly granular character of foundation soils and the slow rate of load application during digester filling operations. Post-processing extraction focused on vertical displacement fields to predict settlement magnitudes and distributions, contact stress distributions beneath the slab, and mobilized shear stresses around pile elements.
2.3. Deformation measurement
The data collection for the foundation settlement monitoring was conducted over a 26-day period, encompassing six measurement stages corresponding to five progressive loading steps. The last sixth stages served as a control phase to establish a settlement at 100% level of fulfilment. The final measured settlement was considered to be the measurement from the sixth stage. The time and load on the bearings when filling the hopper are shown in Table 3.
Table 3:
Table showing the measurement period and fill level over time
| Stages of measurements | Level of fulfilment [%] | Time line [h] |
|---|---|---|
| 1. | 0 (0.00 kPa) | 0 |
| 2. | 25 (13.75 kPa) | 72 |
| 3. | 50 (27,50 kPa) | 144 |
| 4. | 75 (41.25 kPa) | 216 |
| 5. | 100 (55.00 kPa) | 312 |
| 6. | 100 (55.00 kPa) | 528 |
After 528 hours was measurement deformation was used to verify settlement stabilization at maximum load. Each measurement stages consisted of a closed levelling line connecting the four reference points (Point 5–8) and the four observation points (Point 1 – Point 4) using the Leica LS15 digital level with compensator accuracy of 0.2 mm and electronic measurement precision of 0.01 mm per reading. Reference points were permanently stabilized using permanent deep marking (stabilization) at the locations that could not be affected by the settlement of the structure, while the observation points were stabilized by deep marking within the building's foundation slab. All levelling was performed using an invar staff to minimize thermal expansion effects, with measurements taken during stable atmospheric conditions to reduce refraction errors and ensure optimal measurement accuracy. The levelling network configuration required four instrument setups per complete line, with each setup incorporating backsight and foresight measurements to adjacent benchmarks following standard geodetic levelling procedures. Quality control procedures included immediate field calculation of line misclosures, with all levelling lines required to close within ±0.40 mm, which was consistently achieved throughout all measurement stages. Reference point stability verification was performed at the beginning of each stage by measuring height differences between reference points to detect any potential movement in the reference network itself. Loading magnitude at each stage was determined by measuring the water level inside the digester and calculating the corresponding pressure distribution on the foundation slab, expressed as a percentage of the design capacity. Real-time monitoring of settlement progression during the 100% loading stage was conducted with measurements at 15-minute intervals to verify compliance with the stabilization criterion of less than 0.05 mm displacement per 15 minutes. Temperature and atmospheric pressure conditions were recorded during each measurement session to document environmental factors that could influence measurement accuracy or settlement behaviours. Digital field data were recorded electronically from the Leica LS15 instrument and immediately backed up to prevent data loss, with manual field books maintained as redundant documentation (Bačová et al. 2023). Raw elevation differences between successive measurement stages were computed for each observation point to quantify absolute settlement values at each loading stage. Differential settlement between observation points was calculated to assess foundation tilting and non-uniform settlement patterns across the foundation slab. Settlement rates (mm/day) were derived from time-series data to characterize the temporal evolution of deformation during and between loading steps. A similar approach for measuring deformations was chosen by Muszyński and Rybak (2021) when loading piles using static loads.
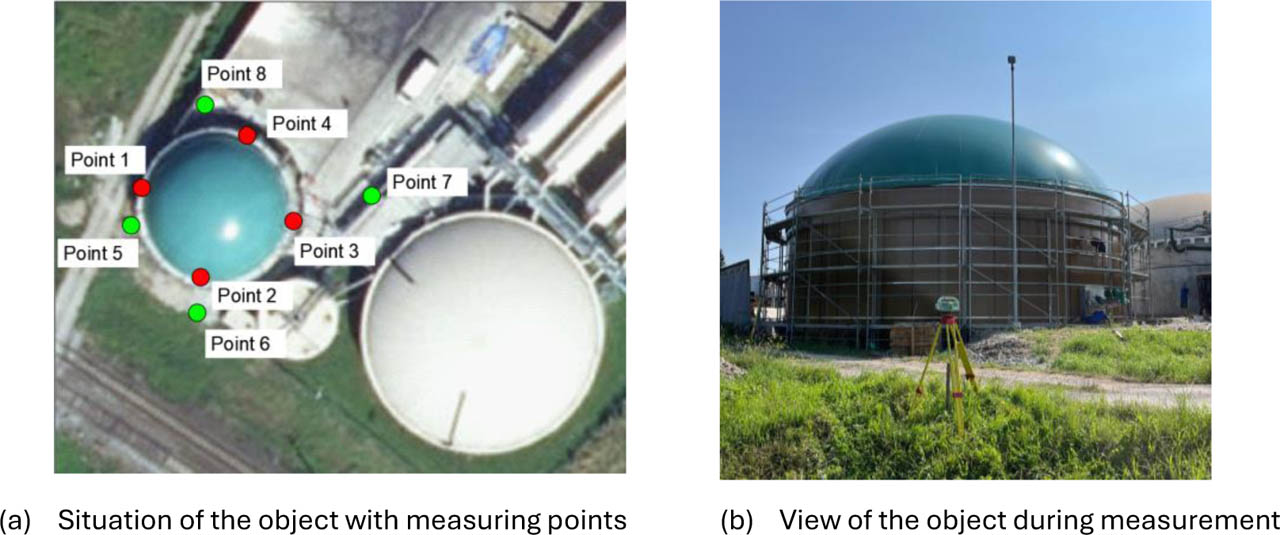
Figure 3:
Measured points and observed object
3. Results
The load-settlement relationship was constructed by plotting cumulative settlement against applied load percentage for each observation point, enabling comparison with finite element predictions from the PLAXIS 3D model. The maximum settlement values are in the center of the foundation slab, but since it is not possible to verify the settlement in the center of the structure, we replaced this point with points around the edge of the slab. The settlement values were identified from the data set in order to measure the settlement at characteristic points on the edge of the foundation slab and to verify compliance with the permissible settlement limits. Statistical analysis of the four observation points yielded average settlement values for each loading steps, providing a representative measure of overall foundation performance. All collected data were processed using least-squares adjustment techniques to optimize elevation values and minimize random measurement errors in the geodetic network. The final dataset comprised 30 individual levelling measurements across six stages, generating comprehensive documentation of foundation settlement behaviour under progressive loading conditions from zero to full operational capacity.
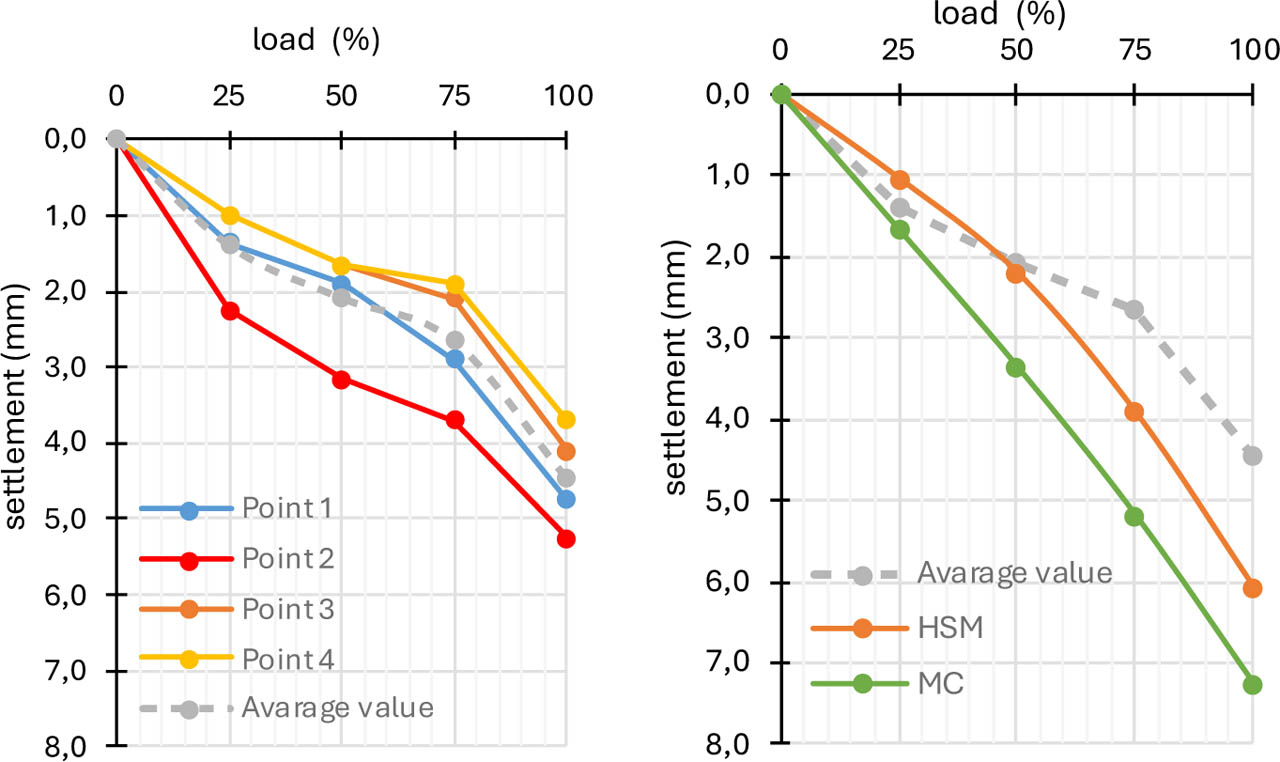
Figure 4:
Measurement field results
Table 4:
The measurement point under loading
| Load [%] | Settlement [mm] | ||||
|---|---|---|---|---|---|
| 0 % | 25 % | 50 % | 75 % | 100 % | |
| Point 1 | 0,0 | 1,3 | 1,9 | 2,9 | 4,75 |
| Point 2 | 0,0 | 2,3 | 3,2 | 3,7 | 5,25 |
| Point 3 | 0,0 | 1,0 | 1,7 | 2,1 | 4,1 |
| Point 4 | 0,0 | 1,0 | 1,6 | 1,9 | 3,7 |
| Average value | 0 | 1,4 | 2,1 | 2,6 | 4,5 |
Table 5:
Measured and calculated deformation
| Load [%] | Settlement [mm] | ||||
|---|---|---|---|---|---|
| 0 % | 25 % | 50 % | 75 % | 100 % | |
| Average value | 0,0 | 1,4 | 2,1 | 2,6 | 4,5 |
| Mohr-Coulomb model | 0,0 | 1,7 | 3,4 | 5,2 | 7,3 |
| Hardening soil model | 0,0 | 1,1 | 2,2 | 3,9 | 6,1 |
The geodetic monitoring campaign successfully documented the settlement behaviours of the biogas digester foundation across all five loading steps, with measured deformations remaining well within acceptable limits throughout the testing program. At the initial baseline measurement (0% loading), all four observation points were assigned reference elevations with measurement precision of ±0.20 mm, establishing a stable datum for subsequent settlement calculations. Application of the first loading increment to 25% capacity resulted in measured settlements ranging from 1.0 mm to 2.3 mm across the four observation points, indicating immediate elastic compression of the foundation system. The 50% loading step produced cumulative settlements between 1.6 mm and 3.2 mm, demonstrating a nearly linear load-settlement relationship during the initial loading steps. At 75% loading capacity, cumulative settlements increased to the range of 1.9 mm to 3.7 mm, with settlement rates beginning to show slight deceleration, indicating progressive stabilization of the foundation system. Maximum loading at 100% capacity was achieved with measured settlements reaching 3.7 mm to 5.25 mm across the observation points, and verification measurements (six stage) after 9 days, confirmed settlement stabilization with negligible additional deformation. The average settlement across all four observation points at maximum load was 4.5mm, which represents 73.7 % of the finite element prediction of 6.1 mm for HS model or 61.6 % of the finite element prediction of 7.3 mm for MC model calculated using PLAXIS 3D modelling. Point 3, located in the southeaster quadrant of the foundation, and exhibited the maximum settlement of 5.25 mm, while point 1 in the northwester quadrant showed the minimum settlement of 4.8 mm, resulting in a differential settlement of 0.8 mm across the 18-meter diameter foundation. The maximum relative settlement ratio s/D = 0.00025 (where s = settlement and D = diameter) was well below the critical threshold of 0.002 typically associated with structural distress in cylindrical tanks. Load-settlement diagrams for all observation points exhibited smooth, monotonic curves without sudden breaks or discontinuities that would indicate foundation failure mechanisms or loss of bearing capacity.
Settlement rates during the final loading step decreased to less than 0.02 mm per 15-minute interval within 6 hours of reaching 100% load, satisfying the stabilization criterion of 0.05 mm per 15 minutes specified in STN 73 1002. Time-settlement curves demonstrated rapid initial settlement upon load application, followed by logarithmic decay, characteristic of primarily granular soil behaviours with minimal consolidation of fine-grained layers. Reference point stability verification confirmed that all four reference benchmarks remained statistically invariant throughout the monitoring period, with inter-benchmark elevation differences varying by less than 0.3 mm, thus validating the integrity of the measurement datum. The measured settlement pattern showed reasonable radial symmetry with slightly higher values toward the centre and southeaster portion of the foundation, consistent with minor variations in subgrade conditions identified during geotechnical investigations. The load-settlement relationship remained essentially linear up to 75% loading, with only minor curvature appearing in the final loading increment, suggesting the foundation operated well within the elastic range throughout the test. Post-test inspection of the concrete slab and digester structure revealed no visible cracking, distortion, or structural damage, confirming adequate performance under the applied loads. Long-term monitoring over the 9-day period at constant 100% loading demonstrated creep settlements of less than 0.15 mm, indicating negligible time-dependent deformation and excellent long-term stability. Statistical analysis of measurement precision yielded standard deviations of ±0.18 mm for individual settlement values, confirming that the Leica LS15 instrument achieved its specified accuracy throughout the field campaign.
4. Discussion
The average settlement across all four observation points at maximum load was 4.5 mm, which represents 73,7 % of the finite element prediction of 6.1 mm for HS model or 61.6 % of the finite element prediction of 7.3 mm for MC model calculated using PLAXIS 3D modelling. This substantial discrepancy suggests that the geotechnical model employed conservative soil parameters, potentially underestimating the beneficial effects of pile driving on the densification of the granular fluvial sediments. Also, the friction value between the piles and the soil could have been higher than predicted by the numerical model. In future testing, it would be advisable to verify the roughness of the prefabricated concrete piles, as done by Kováč (2023).
Furthermore, the 250 mm layer of compacted crushed gravel between pile heads and the concrete slab likely achieved higher stiffness values than the minimum specified value, contributing additional load distribution capacity. The nearly linear load-settlement relationship observed up to 75% loading indicates that the foundation system operated predominantly in the elastic range, with no evidence of plastic yielding or progressive failure mechanisms. The excellent performance may also be attributed to the composite foundation behaviour, where the concrete slab, aggregate layer, and pile grid act as an integrated structural system rather than as independent elements. The layer of compacted crushed grawel should be designed from foam concrete, as can be used under industrial floors, which was tested by Vlček et al. (2017).
The above-mentioned uniformity indicates homogeneous subsoil conditions despite the presence of anthropogenic fill layers, probably due to effective site preparation and pile installation procedures that mitigated variability in the upper soil layers. The rapid settlement stabilization observed within 6 hours of applying each load increment, with creep rates below 0.02 mm per 15 minutes, confirms the predominantly granular character of the foundation soils with minimal consolidation of fine-grained components. Indonesian research on silo foundations (SNI 8460:2017) classifies settlements exceeding 75 mm as high risk, whereas the Budča digester exhibited only 7% of this threshold value, placing it in the lowest risk category. The time-dependent settlement of less than 0.15 mm over 9 days at constant maximum loading indicates negligible secondary compression, contrasting with the typical behaviour of clayey soils, where consolidation settlements can continue for months or years. Comparison with the Canadian Tank 42 case study, where 483 mm of settlement was tolerated without structural failure, provides the perspective that the 5.25 mm settlement observed at Budča is negligible and poses no structural or operational concerns. The absence of visible cracking in the concrete slab despite the presence of pile heads that are not rigidly connected to the slab validates the design philosophy of allowing controlled flexibility rather than forcing monolithic behaviour. The southeaster concentration of slightly higher settlements (point 3 with 5.6 mm) may correlate with variations in anthropogenic fill thickness or density documented in geotechnical investigations, though the 0.8 mm differential remains structurally insignificant. The conservative finite element predictions serve a valuable purpose in design safety, but the actual measurement results suggest potential for foundation optimization in future similar projects, possibly reducing pile quantities or relaxing compaction requirements. The measurement precision achieved with the Leica LS15 system (±0.18 mm standard deviation) was essential for detecting the small settlements encountered, whereas conventional levelling equipment with ±1–2 mm precision would have been inadequate for this project. The reference network stability verification (inter-benchmark variations <0.3 mm) was critical for ensuring that measured settlements represented true foundation movement rather than datum instability, a factor often overlooked in monitoring campaigns. The progressive loading protocol applied over 26 days allowed differentiation between immediate elastic settlement and time-dependent consolidation, providing insights into soil behaviour that would be missed with instantaneous loading scenarios. The success of this monitoring program demonstrates the value of integrating high-precision geodetic measurements with geotechnical design, enabling validation and potential refinement of numerical models based on actual field performance. Future monitoring campaigns for similar biogas digester foundations should consider extending the observation period beyond initial loading to capture seasonal variations, groundwater fluctuations, and long-term operational effects on settlement behaviour. During the study, it was recommended that in the future, consumers focus on using sensors that enable data to be provided on a daily basis, in real time, as developed by Belany et al. (2025) for smart buildings.
5. Conclusion
This research successfully demonstrated the application of high-precision geodetic levelling measurements to verify foundation performance of a biogas digester structure supported by a driven pile and concrete slab system in Budča, Slovakia. The comprehensive monitoring campaign conducted over 26 days with five loading steps provided definitive evidence that the foundation system performed exceptionally well, with maximum measured settlements of 5.25 mm at full operational capacity.
The average settlement across all four observation points at maximum load was 4.5mm, which represents 73,7 % of the finite element prediction of 6.1 mm for HS model or 61.6 % of the finite element prediction of 7.3 mm for MC model calculated using PLAXIS 3D modelling. This substantial discrepancy suggests that the geotechnical model employed conservative soil parameters, potentially underestimating the beneficial effects of pile driving on the densification of the granular fluvial sediments. Rapid settlement stabilization within hours of each load application, combined with negligible creep deformation over extended periods, confirmed the predominantly elastic behaviour of the foundation and the effectiveness of the compacted aggregate layer in load distribution. The Leica LS15 digital levelling system with invar staff achieved measurement precision of ±0.20 mm, which proved essential for detecting and quantifying the small settlements encountered in this well-performing foundation system. The research methodology established in this study, including reference network design, measurement protocols, and data analysis procedures, provides a replicable framework for similar foundation monitoring projects on industrial structures.
Comparison with international case studies and standard (SNI 8460:2017) contextualizes the excellent performance observed at Budča, demonstrating that the foundation settlements fall well within acceptable limits for analogous storage tank and silo structures worldwide. The discrepancy between predicted and measured settlements suggests opportunities for optimization in future biogas digester foundation designs, potentially reducing construction costs through refined pile configurations or less stringent compaction requirements while maintaining adequate safety factors. The integration of geotechnical investigation data, finite element modelling, and geodetic monitoring created a comprehensive foundation assessment framework that bridges theoretical design with empirical validation. The absence of structural distress, cracking, or operational issues following the full-scale load test confirms the adequacy of the foundation design for long-term service under maximum design loads. This research contributes valuable empirical data to the limited literature on biogas digester foundation performance, particularly for installations on fluvial sediments with anthropogenic overburden typical of industrial sites in Central Europe.
The successful outcome validates the use of driven pile foundations combined with compacted aggregate layers as an effective solution for biogas infrastructure on sites with weak near-surface soils overlying competent granular strata. The monitoring results provide confidence to the facility operator that the digester can be safely operated at full capacity without concerns regarding excessive settlement, structural damage, or foundation instability. The research demonstrates that modern geodetic instrumentation and procedures can deliver submillimetre precision in field conditions, enabling rigorous validation of geotechnical design assumptions that would be impossible with conventional measurement techniques.
Future research should extend this monitoring approach to capture seasonal effects, cyclic loading patterns during operational filling and emptying cycles, and long-term settlement trends over multiple years of service. The methodology developed in this study is transferable to other critical infrastructure projects requiring precise settlement monitoring, including industrial tanks, silos, bridge foundations, and sensitive equipment installations. Implementation of similar geodetic monitoring programs during construction and commissioning phases can provide early warning of foundation issues, validate design assumptions, and support data-driven decisions regarding structural acceptance and operational readiness.
This research underscores the value of collaborative integration between geotechnical engineering, structural design, and geodetic measurement disciplines in achieving safe, economical, and well-documented foundation solutions. The Budča biogas digester foundation monitoring project serves as a successful case study demonstrating best practices in foundation verification testing and establishes performance benchmarks for future biogas infrastructure development in similar geological settings.
Acknowledgements
This paper was financially supported by the Scientific Grant Agency VEGA of the Slovak Republic, under project grant No. 1/0009/23.
Notes
[1] Contributed by Author Contributions
F.G. designed the study and supervised the project. F.G. and J.C. conducted the experimental measurments. J.Mihálik. performed the data and FEM analysis. J.Michałek. contributed to manuscript writing and formal analysis. All authors critically reviewed and approved the final version of the manuscript and agreed to be accountable for all aspects of the work.