

1. Introduction
The increase in transportation demand has become urgent due to the growth of the population. Consequently, this surge has resulted in an increase in the number of vehicles. Statista (2024) stated that there is a continuous increase in the number of vehicles; therefore, the congestion of roads has intensified (Elmorshedy et al., 2024; Toan et al., 2022). The rapid growth of the population leads to a noticeable increase in vehicle ownership worldwide. Thus, due to the growth of traffic volumes, traffic congestion has emerged as a global challenge, impacting mobility and economic efficiency. In order to improve road performance, easing traffic congestion is crucial for transportation management aspects, which impacts multiple economic factors. Traffic flow is greatly impacted by the heterogeneous vehicles, mostly by heavy vehicles. These vehicles typically have different acceleration rates, turning radii, and speed capabilities. Flow is associated directly with traffic characteristics and strongly influences mobilization and safety of both people and goods (Al Hamami and Matisziw, 2021; Li et al., 2024). Also, both capacity and LOS are vital overlapping concepts. They both represent a qualitative and quantitative perspective on traffic analysis (Pandey, 2022; Sharma, 2024, Jinrui et al., 2023). Moreover, multiple variables like road type, purpose of use, present conditions, and traffic patterns majorly impact both capacity and LOS of road performance (Al-Azzawi, 2006; Solodkiy and Chernikh, 2020). Consequently, due to capacity drop, congestion can be created (Elokda et al., 2024).
Traffic congestion represents diverse issues, such as safety, health, economic, and psychological concerns (Jakubec et al., 2025; Jandacka et al., 2024; Jandacka et al., 2025; Trojanová and Malatincova, 2024). Different reasons can contribute to bottlenecks, including the presence of checkpoints, steep curves, narrow tunnels or bridges, merging lanes, construction zones, and weather conditions (Mainali et al., 2024; Titiloye et al., 2021). This issue has been addressed by multiple researchers, and diverse methodologies have been proposed to alleviate this problem. For instance, Lighthill-Whitham-Richards (LWR) macroscopic Partial Differential Equation (PDE) model has been suggested by Yu et al. (2019) for bottleneck mitigation. Another utilized technique, Variable Speed Limit (VSL), has also been proposed as a speed synchronization controller technique for bottleneck management (Kukaz et al., 2025; Lin et al., 2023). In order to mitigate the impact of traffic congestion, there is a vital need to assess the bottleneck. For instance, alleviating the expressway congestion, controlling the vehicles' arrival time has been proposed (Li et al., 2024; Toan et al., 2022). Moreover, the Vacs technique has been suggested by Piacentini et al. (2019) for minimizing vehicles' travel time, which reduces carbon emissions. Therefore, it is crucial to comprehend the changeable traffic trip distribution to alleviate the influence of any disturbances (Zhang, 2024).
Delay creates multiple issues of traffic, such as worsening safety and environment (Badi et al., 2022; Subair et al., 2024; Tahir et al., 2021). Bigazzi and Figliozzi (2013) mentioned that the congested road rate is calculated to be around 10–61% greater than the rate under light traffic. Generally, in developed industrial countries, transportation accounts for 25% to 28% of the total calculated footprint (Du et al., 2024). In addition to the global rise in fuel prices, other considerations, like environmental concerns, should be considered as an essential aspect for congestion mitigation (Álvarez, 2024). Generally, reducing fuel consumption means lowering carbon emissions, supporting environmental preservation, and aligning with governmental sustainability policies of transportation subdivisions (Li, 2023). Accident occurrence is also triggered over the congested road segments due to some related psychological and social factors, such as stress and fatigue of drivers (Zhao, 2024). The approach of VBA can be utilized for ensuring the reliability, consistency, and dependability of the collected dataset of traffic volumes (Gao, 2020; Kim, 2019) or other models (Santhakumar, 2021). The reason behind approaching this methodology is to inspect the discrepancy between measured inflows and outflows at multiple network spots (Noyce, 2014). Hence, by comparing both upstream and downstream traffic volumes, analysts can identify the imbalances and adjust them for reconciliation. Reliable traffic counts are crucial for further analysis, such as LOS or network efficiency evaluations.
With an interaction of multiple sizes and performance of vehicles, assessing characteristics of the mixed traffic flow requires an extensive knowledge of speed distributions (Drliciak et al., 2024; Santhakumar, 2022; Sarkar and Kumar, 2024). Considering both the presence and absence of heavy vehicles through the statistical analysis of vehicle speeds illustrates useful outcomes on traffic flow and driver behaviour. Some researchers have inferred that an increase in heavy vehicles means a decrease in the speed of traffic. Also, at the case of free and steady flow conditions, the speed is sharply declined mixing rate (Gao, 2020). Another group of researchers discovered that speed variance is increased, and this issue can be mitigated by advisory speed limit (Hassan, 2024; Liu et al., 2024; Wang et al., 2025). Acceleration is influenced by various factors such as the kind of vehicle. Nevertheless, the majority of acceleration research has relied on datasets from developed nations (Albdairi, 2025; Al Hamami and Matisziw, 2021; Li et al., 2024). Descriptive statistics are a cornerstone of visualizing and interpreting collected data, besides providing a quantitative basis for comparative analysis.
While both integrity and availability of the dataset are regarded as key concerns, precise datasets are crucial for the evaluation of congestion (Ashraf, 2019). Traffic congestion over particular freeway segments is regarded as a real issue due to multiple contributing elements and the intricate nature of traffic flow characteristics (Zhou, 2021). This is due to the persistent peak hours, fluctuation of traffic volumes, behaviour of drivers, and variety of vehicles. All of these factors adversely impacted road safety, fuel consumption, and travel time consistency (Gabr, 2024). Thus, considering only LOS analysis narrows the operational scope and fails to alter the environmental and social impacts of congestion. In addition, evaluation of road performance can be biased from the limited traffic counts that would not reflect the fluctuations of traffic (Cai, 2025). Besides, reliance only on statistical categorization reduces the dynamic nature of congestion and simplifies the actual traffic situation. LOS analysis indicates various ranks of congestion patterns (Kundu, 2023). Multiple challenges emerge in the case of heavy vehicles' involvement in the traffic stream. These challenges arise due to the characteristics of heavy vehicles, such as their size and acceleration, which adversely impact both road capacity and overall speed. Therefore, to identify the impact of heavy vehicles on the traffic stream, statistical analysis is crucial (Santhakumar, 2021). In addition, utilizing both LOS metrics besides robust statistical analysis is crucial for congestion justification. Due to the above challenges, this study can contribute to decision-makers to benefit from the trustworthy procedure to assess and mitigate road conditions under different traffic scenarios.
Multiple extensive studies have approached the performance assessment (García, 2021; Kociánová et al., 2025; Trojanová and Beňová, 2026). However, the majority of previous studies have relied on either on-board traffic modelling or simulation tools rather than LOS evaluation. Some researchers have utilized on statistical correlations instead of operational performance integrations. HCS presents a structured technique for LOS analysis (Freeze, 2021). However, few researches have approached the selected area of this study for multiple reasons, such as the shortage of datasets and the persisted security issues at this region (Abdulrazzaq, 2025; Alkaissi and Hussain, 2021). Also, most of the previous studies have simplified performance by concentrating on some general assumptions or average traffic volumes, which means ignoring some variations like traffic composition, heavy-vehicle impacts, and checkpoint constraints. Therefore, due to these reasons, the majority of these studies have been conducted in developed countries (Liu et al., 2024; Stanescu, 2023; Wang et al., 2025). Moreover, to address these gaps, this study utilizes some strategies with the following contributions:
This study approached this crucial segment of Expressway No. 1 in Iraq for congestion management and bottleneck mitigation though the successive sectarian violence of this region.
Introducing an integrated perspective towards operational performance to verify and comprehend impact factors by utilizing both LOS assessment and statistical analysis.
This kind of integrating of both practical and statistical analyses can offers policymakers and engineers a guidance for assessing the strategies of congestion mitigation based on knowledge.
This research represents a decision support framework that integrates operational dataset into a robust solution for practical traffic performance assessment.
One of the main objectives of this study is to align with the United Nations Sustainable Development Goals (UNSDGs) by focusing on operational effectiveness and congestion reduction. For drivers’ safety enhancement, this study aims to strengthen safety measures by minimizing the probability of accidents occurrence at the spots of traffic bottlenecks. Reducing of fuel consumption and emissions is the second goal of this research by eliminating of redundant stops, improving of flow efficiency, and enhancing of traffic operations. Both cost saving and environmental sustainability are outcomes of this goal. Decreasing of travel time is another objective of this study by finding and executing the optimum traffic performance assessment options. This means allowing drivers to arrive to their destinations with less exhaustion with much time savings. Finally, statistical analysis is also approached to identify the elements that negatively impact the vehicles manoeuvring movements.
As a substantial contribution, the implication of this research can be detected by decision-making improvement of traffic congestion mitigation through utilizing both LOS analysis and statistical estimation. Both analyses offer planners and related authorities acquiring much accurate and comprehensive knowledge about performance of freeways. The main purpose of this study is to predict robustness and validity of congestion estimation. This kind of prediction can be employed by integrating the gaps between statistical validation and efficiency metrics for more mitigation choices. A considerable number of studies in congestion, speed improvement, and LOS has been conducted in developed nations for decades; however, such studies have been limited in Iraq due to the sequential sectarian violence besides lack of long-term traffic dataset. Also, multiple factors increase the congestion problem along the area, such as the non-policy trade of vehicles. These factors have adversely impacted the lives of residents. Hence, it is crucial to incorporate some local conditions like, significant presence of commercial trucks and security checkpoints, all of which, establish unique traffic patterns that differ from circumstances observed in other regions. Consequently, these conditions offer novel essential fresh perspectives to develop traffic performance over this area. Therefore, the main objectives of this study are to evaluate congestion of traffic and operational performance by utilizing both LOS evaluation and statistical analysis to estimate the impact of heavy vehicles and suggest recommendations of data-driven for congestion mitigation. This research can be utilized by related authorities in developing solutions to enhance both safety and mobility in addition to mitigate congestion. Besides, this study can be illustrated the application of congestion assessment in cost savings by correlating the outcomes of this study into real-world practical solutions such as fuel consumption. Besides, this approach offers an adaptable framework that can be used with any identical infrastructure systems over any region. Finally, the study not only strengthens the academic literature on congestion assessment but also offers a helpful tool for reconciling rigorous research with real-world traffic performance assessment objectives.
2. Methodology
This study observes a selected segment of Expressway no.1 in Iraq, with a length of around 40 km. This expressway connects multiple governorates and extends from the Jordanian and Syrian borders in Anbar, reaching to Umm Qasr Port in Basra. The selected study segment stretches from the Al-Karmah area to Abu Ghurayb prison, as shown in Figure 1. Also, the assigned portion of the expressway is located west of Baghdad, and it is regarded as one of the major metropolitan arteries connecting the capital to the suburbs. The corridor is a crucial commercial and social link and is regarded as the main western entrance of Baghdad. The reason behind selecting this portion was for its high traffic demand, frequent congestion, and strategic transportation importance. Thereby, investigating its operational performance exposes the conditions of traffic in an essential aspect of urban infrastructure.
The road design and speed limit regulations in Iraq are greatly related to AASHTO standards. For instance, the maximum speed limit for urban highways ranges between 100 and 120 km/hr, as per the classification of road segments. Also, the asphalt pavement was designed according to the Flexible Pavement Design Method of AASHTO. However, the lane width originally is designed as per the Iraqi Highway Design Code, which it identifies 3.75 as the recommended lane width for a multilane expressway. In Iraq, especially after 2003, security checkpoints are commonly located at main entrances and exits of metropolitan areas. In this situation, vehicles are required to reduce their speeds before entering the zone of checkpoints. Moreover, some kinds of vehicles should be stopped for further inspection due to certain conditions or security concerns. Generally, commercial trucks should be retained for thorough inspection, which can be extended for multiple hours. Therefore, these bureaucratic procedures can lead to a regional bottleneck and impact observed traffic metrics.
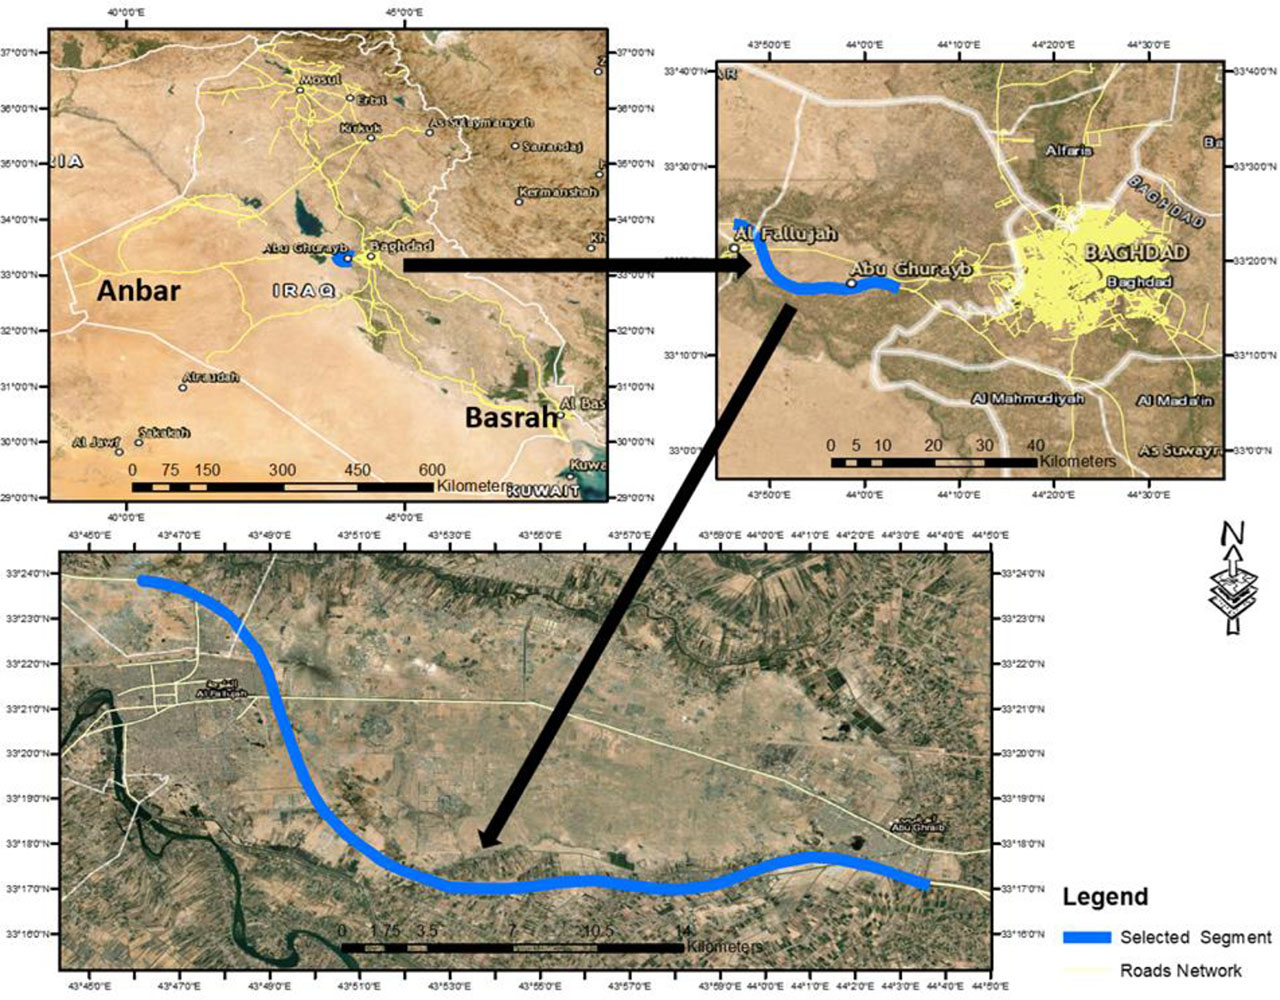
Figure 1:
Selected segment of expressway no.1 within Anbar governorate, Iraq
This study consists of different parts of methodology to optimize the best solution for traffic congestion alleviation. The first part comprehends the data collection procedure along with the selected segment of the expressway. The second part applies the VBA to assess the traffic consistency then utilizes LOS analysis to estimate the traffic performance and infer the best optimization. The third part of the methodology represents the statistical analysis to examine the impact of the presence and absence of heavy vehicles (trucks) towards the traffic flow patterns. To alleviate the impacts of traffic congestion, the implementation of the above steps is crucial as mitigation strategies and policy recommendations for providing a robust, suitable, and responsive decision-making policy. The steps of methodology can be illustrated in Figure 2.
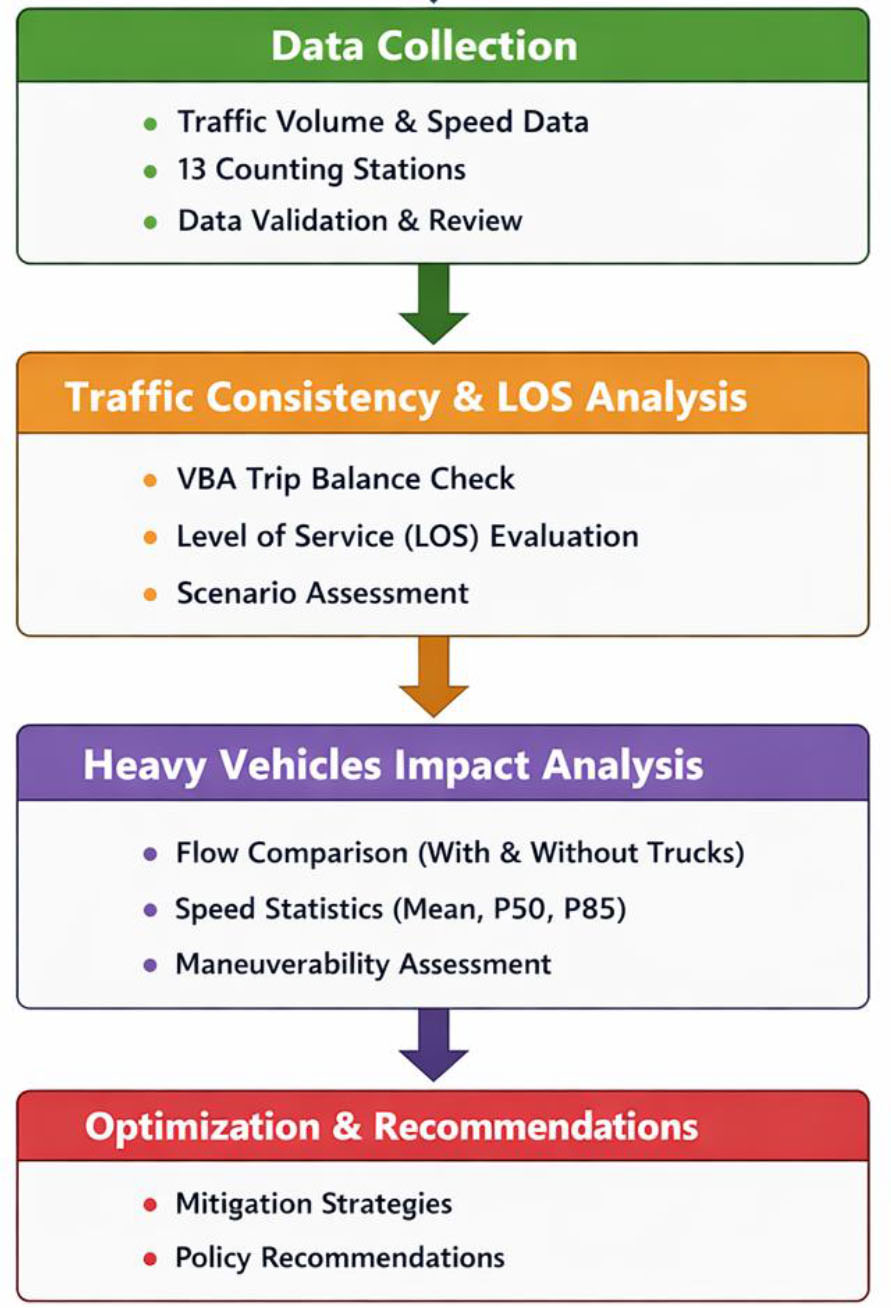
Figure 2:
Methodology steps
2.1. Data Collection
Identifying the optimum traffic counting locations is essential to maintain the reliability and accuracy of both LOS and statistical analyses. This process consists of deciding the ideal spatial locations over the study area to capture both typical traffic patterns and flow variations. In order to capture traffic patterns, there is a crucial need to take into considerations significant entry/exit points, congested spots, and locations within the impact of checkpoints. This selection should reflect the spatial variations of traffic flow and speed. Thus, thirteen counting stations were assigned to cover the road segment entry/exit locations for volumes and speeds counting. Both Figure 3 and Table 1 depict the traffic counting station notations. It is worth mentioning that this research utilized from the collected traffic volumes and speed datasets that were collected by Roads and Bridges Department (RBD). Also, these points of measure were created only during measurement, then removed after collecting datasets. It is worth mentioning that points from 1 to 12 were assigned for traffic volume collection, while P13 was dedicated segment for vehicles speed measurements in a single direction (i.e., L.H.S only). The measurement of points provides operational representative conditions along the selected segment of study. Also, the segment for speed counting (P13) was selected at a zone when the dataset can be measured, compared, and normally distributed, which can be statistically analysed.
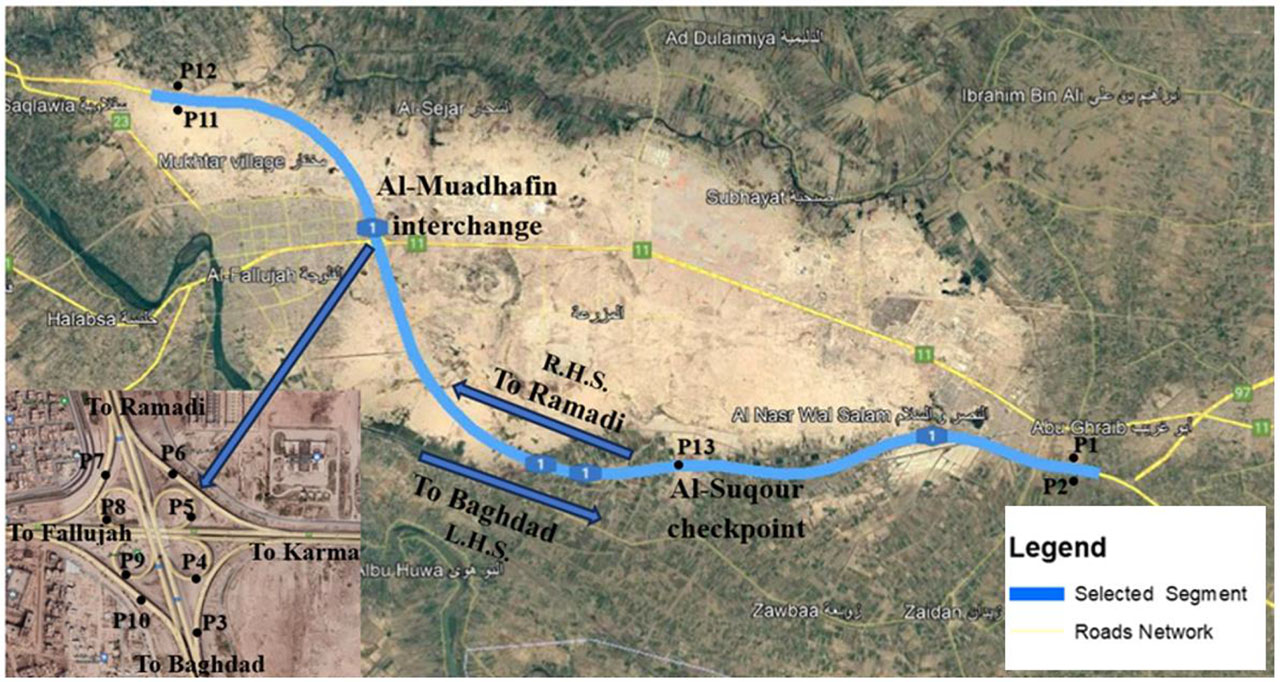
Figure 3:
Traffic counting stations
Table 1:
Traffic counting stations
| Station No. | Details |
|---|---|
| P1 | From Baghdad to Ramadi (R.H.S) |
| P2 | From Ramadi to Baghdad (L.H.S) |
| P3 | From Baghdad to Karma at Al-Muadhafin interchange |
| P4 | From Fallujah to Ramadi at Al-Muadhafin interchange |
| P5 | From Baghdad to Fallujah at Al-Muadhafin interchange |
| P6 | From Karma to Ramadi at Al-Muadhafin interchange |
| P7 | From Ramadi to Fallujah at Al-Muadhafin interchange |
| P8 | From Karma to Baghdad at Al-Muadhafin interchange |
| P9 | From Ramadi to Karma at Al-Muadhafin interchange |
| P10 | From Fallujah to Baghdad at Al-Muadhafin interchange |
| P11 | From Ramadi to Baghdad (L.H.S) |
| P12 | From Baghdad to Ramadi (R.H.S) |
| P13 | By Al-Soqur checkpoint for speed counting |
By using a high-resolution video camera, traffic volumes were collected for the selected stations. The recorded footages were carefully inspected for volume counting, type of vehicles classifying, and peak-time of traffic flow extracting. Data validation was performed for detecting any recording mistakes and ensuring the variation was reflected the real patterns of traffic. This validation was crucial to establish the dataset's validity for analysis. In order to collect the traffic data within the peak time periods, two AM and PM time periods were inferred for traffic volumes collection. RBD dataset consists three sporadic days: Sunday, Tuesday, and Thursday. The first period, the AM, is extended from 7:00 to 10:00 AM, while the second period is extended from 3:00 to 6:00 PM. The traffic counting sheet consists of multiple classifications of vehicles as per their size. For instance, it encompasses motorcycles, passenger cars, buses, heavy trucks, and two or more-axle trucks as per AASTHO standards (AASHTO, 2018). Tables 2 and 3 summarize the AM and PM periods of data collection. Also, Figures 4 and 5 depict the traffic volumes for both AM and PM successively in both directions. Table 2 and Figure 4 depict the highest volume on Sunday from 9:00 to 10:00 AM at station (P1), with the total 5165 vph, while the lowest value was recorded on Tuesday at station (P12), with the total 1165 vph from 7:00 to 8:00 AM. In addition, Table 3 and Figure 5 illustrate the peak volume on Tuesday from 4:00 to 5:00 PM at station (P2), with the total 6298 vph, while the lowest value was recorded on Thursday also at station (P12), with the total 2050 vph from 3:00 to 4:00 PM. In order to avoid irregular traffic conditions (e.g., off-peak periods), temporal representativeness was certified by choosing typical weekdays periods (i.e., Sunday, Tuesday, and Thursday). Also, the collected speed of vehicles was calculated by using video recording by assigning fixed reference points with determined distances withing the view of camera. The travel time between these two references were calculated from the records, then the speeds were calculated. After speed calculations, removing outliers was performed, and then ensuring both reliability and suitability of the collected speed data for further statistical analysis. The selected days for data collection represent typical weekday conditions in the study segment. The collected data reflect in-time point of measurements, not long-term averages, and emphasize traffic patterns variances along the days of the week. This variation in volumes between P1/P2 and P11/P12 reflects the adversely impact of the bureaucratic inspection procedures through the military checkpoint, which can cause speed reduction, queuing formation, and congestion creation. Thus, statistical speed analysis and LOS are both crucial for better comprehensive operational assessment.
Table 2:
Collected traffic volumes for AM peak periods of the study area
| Day | Time [hr] | Station No. [vph] | |||
|---|---|---|---|---|---|
| P1 | P2 | P12 | P11 | ||
| R.H.S | L.H.S | R.H.S | L.H.S | ||
| Tuesday | 7:00 – 8:00 | 4220 | 2903 | 2288 | 1630 |
| 8:00 – 9:00 | 4620 | 3960 | 2148 | 1993 | |
| 9:00 – 10:00 | 3510 | 3550 | 2523 | 1695 | |
| Thursday | 7:00 – 8:00 | 3188 | 2008 | 1165 | 1683 |
| 8:00 – 9:00 | 3740 | 2963 | 1860 | 2490 | |
| 9:00 – 10:00 | 5128 | 3135 | 1883 | 2520 | |
| Sunday | 7:00 – 8:00 | 3345 | 2825 | 1963 | 2570 |
| 8:00 – 9:00 | 4633 | 3445 | 2138 | 3108 | |
| 9:00 – 10:00 | 5165 | 2693 | 1868 | 3873 | |
Table 3:
Collected traffic volumes for PM peak periods of the study area
| Day | Time [hr] | Station No. [vph] | |||
|---|---|---|---|---|---|
| P1 | P2 | P12 | P11 | ||
| R.H.S | L.H.S | R.H.S | L.H.S | ||
| Tuesday | 3:00–4:00 | 3171 | 5899 | 2081 | 3060 |
| 4:00–5:00 | 3355 | 6298 | 2669 | 3230 | |
| 5:00–6:00 | 4199 | 5025 | 2237 | 3852 | |
| Thursday | 3:00–4:00 | 4406 | 4811 | 2050 | 3441 |
| 4:00–5:00 | 3487 | 4029 | 2550 | 3968 | |
| 5:00–6:00 | 4953 | 5025 | 3043 | 4019 | |
| Sunday | 3:00–4:00 | 4712 | 4474 | 2237 | 3601 |
| 4:00–5:00 | 4964 | 4342 | 2309 | 4862 | |
| 5:00–6:00 | 4610 | 4512 | 2584 | 4573 | |
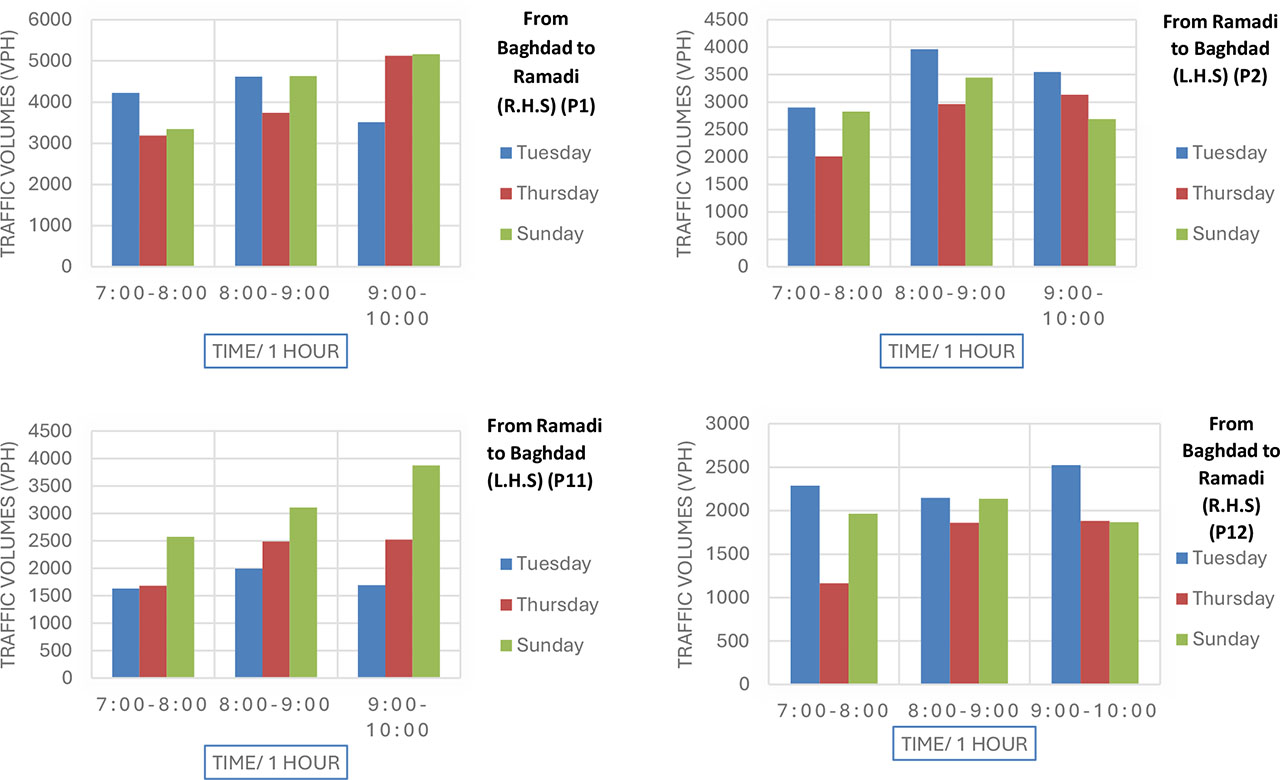
Figure 4:
Collected traffic volumes for AM peak periods of the study area [vph]
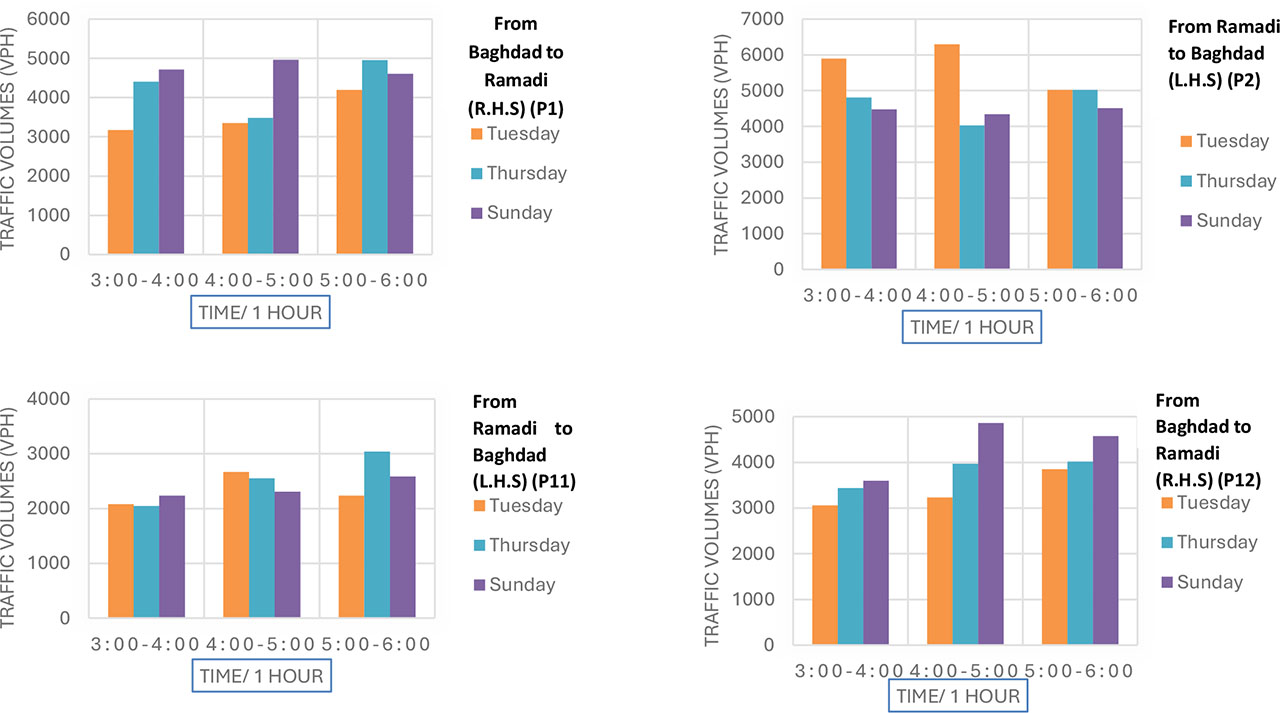
Figure 5:
Collected traffic volumes for PM peak periods of the study area [vph]
2.2. LOS Analysis
At the beginning of the second stage of methodology, the VBA method is selected as a vital step for traffic consistency estimation. Any travel forecast approach can be used to equalize differences in trip generation and attraction sums. The entire number of products and attractions within a trip must be equal. In the context of a specified system, balance is reached when the sum of the input and output are matched. The primary function for this process is to minimize the variance across the modified and unmodified volumes. Therefore, VBA is crucial to evaluate the trip distribution difference percentages for trip pattern estimation, besides flow consistency across the selected areas (Chen, 2019). To calculate the percentage difference of traffic volumes, there is a need to take into consideration any major junction to compute the number of lost or gained trips between the entry/exit of the study area. Equation 1 illustrates the determination of differences in trip generation and attraction. In order to determine the imbalance percentage, equation 2 is used. Table 4 illustrates the entry/exit stations for the study area for the VBA calculations.
Where:D - difference between entries and exits,
E_tot - sum of all entries volume (vph),
X_tot - sum of all exits volume (vph).
The detectable correlations in Table 4 illustrate traffic between monitoring locations in the selected study segment. For instance, some correlations like P4–P5 and P8–P9 correspond to indirect ramp movements with lower traffic demand than mainline flow. These fluctuations promote VBA accounting and accuracy for all entering and exiting movements. Between Along the study segment, the detectors relations illustrate the detected traffic movements through consecutive monitoring counting stations. For example, flow between P65 and P12 represent all traffic travelling through the downstream detector (P12), encompassing both mainline through vehicles and entering vehicles from intermediate ramp (P6–P10). It is worth mentioning that related movements like P4–P5 and P8–P9 represent a smaller portion of traffic but are incorporated for guaranteeing reliability of flow, consistency of dataset, and proper evaluation of operations. Both minor and major traffic flows are included for comprehensive evaluation of the selected study segment.
After making sure that the collected traffic volumes are suitable for further analysis, the selected maximum traffic volumes can be analysed by HCS-2010 software to determine the LOS based on methodologies in the HCM. This software evaluates the operational performance by utilizing different input parameters, such as traffic volume, speed, number of lanes, lane width, percentage of heavy vehicles, and geometric design of the road. Based on density and measures of performance, HCM generates LOS of freeway facilities. Also, there is a rank of LOS, which ranges from A to F as per the level of performance. For instance, LOS reflects driving in free flow with the lowest delay, while LOS reflects the failure flow with significant congestion and unstable traffic patterns. However, LOS C reveals the midpoint when there a stable flow with moderate interaction between vehicles.
LOS is calculated for base year (2024), opening year (2025), and target year (2034), before and after applying the strategic proposals at the assigned growth factor value of 3%. (Ministry of Construction, 2017). The number of vehicles for the target year could be calculated as in equation 3:
Where:AR - growth factor percentage, which is equal to 3%,
n - number of years.
Traffic growth factor indicates the average annual growth in the number of vehicles. It is used in the traffic forecasting procedure for future traffic volumes prediction. For the most recent validated dataset for analysis, 2024 was selected. After the fulfilment of operations, opening year was 2025. The target year (2034) was selected as a predicted 10 years, reflecting the schedule of implementations for ensuring a realistic and practical basis for assessment while diminishing longer-term estimation ambiguity.
2.3. Statistical Analytical Framework
In order to investigate the influence of heavy vehicles on overall traffic flow patterns, an analytical statistical analysis technique is used as another approach in this study. Macroscopic view of speed values has been used to assess traffic flow within the impact of heavy vehicles. Two different scenarios were utilized, both presence and absence of heavy vehicles along the platoon to vehicles. The reason behind selecting this methodology is to determine the impact of heavy vehicles towards the speed reliability, overall flow, and overtaking behaviour among road users. The first scenario includes heavy vehicles, which is proposed to replicate real traffic circumstances, while the second scenario consists excluding heavy vehicles to isolate their impact on traffic flow parameters, consisting distribution of speed, uniformity of flow, and mobility. It is worth mentioning that both scenarios are merely comparative assessments, not simulations, conducted to measure the impact of heavy vehicles on the dynamics of traffic.
One of the major statistical metrics of speeds that should be recorded, the mode of speed. While heavy vehicles are involved, the prevailing behaviour fluctuates and this indicates the prevailing speed within the traffic flow. The second main metric, the pace is vital when it helps answering weather the traffic flow is smooth or disrupted at the case of the presence of heavy vehicles. This comparison approach provides a precise estimation of the heavy vehicle impacts on overall traffic dynamics. The pace of each case is determined by calculating the 10 km/hr interval of speed at the case of the highest number of vehicles. Generally, the pace is likely to be more concentrated at the case of the absence of heavy vehicles. This describes the proceeding of large number of vehicles at comparable rates. At the case of the presence of heavy vehicles, the fragmentation of pace is increased due to the decreasing of the number of vehicles within the platoon besides covering a wide range of speeds. However, at both cases, the outcomes represent the impacts of heavy vehicles towards the uniformity of vehicle speeds. Consequently, these increase the difficulty of manoeuvring, especially along the road segments with limited passing options.
For a better understanding the characteristics of speed data, the normality of the speed distribution was also considered. Any substantial deviation beyond a normal distribution occasionally implies a decrease in traffic flow uniformity. In addition, average speed, defined also as a mean speed, is a measure of central tendency in the traffic flow.
Furthermore, the determination of the standard Deviation of speed was also utilized to calculate the degree or dispersion among speeds of vehicles. In addition, this study approached the calculation of percentile speeds (i.e., both 50th percentile (median speed) and 85th percentile (operating speed)). The variation of percentiles might indicate the effect of slower vehicles along the pattern of traffic performance. Speed comparison at both cases lets specialists of transportation to compute the manoeuvrability impact of these vehicles. Each parameter was compared to the two chosen scenarios. In addition, Tables of comparison were also employed for understanding traffic behaviour enhancement.
3. Results
3.1. LOS Results
3.1.1. VBA analysis
In order to check both reliability and the internal consistency of the collected traffic volumes before any further analysis, VBA method was employed at this study. The outcomes after applying equation 1 and 2 illustrated that there were some imbalance rates. Table 5 depicts traffic counts for the R.H.S at monitoring points P1, P3, P4, P5, P6, and P12. Besides, the calculated differences (D) with the imbalance percentages for each selected peak hour during the selected counting workdays are also shown. However, the revealed imbalance rates were ranged between 2% and 9%. For the opposite direction, L.H.S, the imbalance percentages revealed percentages ranged between 1% and 9% as in Table 6. Both cases were all within the acceptable threshold when both were located within up to 10%. Thus, the outcomes illustrated that the dataset values were remained within tolerance and implying regular commuter variation rather than errors and statistically indistinguishable from noise. Therefore, there is no need for correction, and the collected traffic volumes are appropriate for further analyses. However, the reason behind the presence of imbalance values can be due to the existence of some minor accesses along the road segment. While these accesses may handle slightly tiny traffic volumes compared with the main corridor, the overall impact on results may cause a slightly detectable variance between the entry/exit of traffic counts.
Table 5:
Trip distribution difference with percentages for Right direction R.H.S
| Day | Time [hr] | P1 [vph] | P3 [vph] | P4 [vph] | P5 [vph] | P6 [vph] | P12 [vph] | Difference (D) [vph] | Imbalance % [-] | |
|---|---|---|---|---|---|---|---|---|---|---|
| Tuesday | AM | 7:00–8:00 | 4220 | 395 | 205 | 1565 | 220 | 2288 | 397 | 9 |
| 8:00–9:00 | 4620 | 598 | 108 | 1895 | 193 | 2148 | 280 | 6 | ||
| 9:00–10:00 | 3510 | 393 | 263 | 1258 | 338 | 2523 | 63 | 2 | ||
| PM | 3:00–4:00 | 3171 | 350 | 258 | 1813 | 423 | 2081 | 392 | 9 | |
| 4:00–5:00 | 3355 | 281 | 343 | 1470 | 430 | 2669 | 292 | 7 | ||
| 5:00–6:00 | 4199 | 578 | 340 | 1723 | 355 | 2237 | 356 | 8 | ||
| Thursday | AM | 7:00–8:00 | 3188 | 513 | 223 | 1830 | 261 | 1165 | 164 | 5 |
| 8:00–9:00 | 3740 | 513 | 270 | 1738 | 485 | 1860 | 384 | 9 | ||
| 9:00–10:00 | 5128 | 643 | 193 | 2593 | 195 | 1883 | 397 | 8 | ||
| PM | 3:00–4:00 | 4406 | 493 | 207 | 2195 | 273 | 2050 | 148 | 3 | |
| 4:00–5:00 | 3487 | 478 | 348 | 1638 | 398 | 2550 | 433 | 9 | ||
| 5:00–6:00 | 4953 | 263 | 510 | 2095 | 305 | 3043 | 367 | 7 | ||
| Sunday | AM | 7:00–8:00 | 3345 | 455 | 288 | 1878 | 398 | 1963 | 265 | 6 |
| 8:00–9:00 | 4633 | 492 | 203 | 2078 | 205 | 2138 | 333 | 7 | ||
| 9:00–10:00 | 5165 | 613 | 108 | 2493 | 168 | 1868 | 467 | 9 | ||
| PM | 3:00–4:00 | 4712 | 383 | 185 | 2088 | 203 | 2237 | 392 | 8 | |
| 4:00–5:00 | 4964 | 498 | 231 | 2135 | 197 | 2309 | 450 | 9 | ||
| 5:00–6:00 | 4610 | 368 | 258 | 1940 | 283 | 2584 | 259 | 5 | ||
Table 6:
Trip distribution differences with percentages for left direction L.H.S [vph]
| Day | Time[hr] | P11 [vph] | P7 [vph] | P8 [vph] | P9 [vph] | P10 [vph] | P2 [vph] | Difference (D) [vph] | Imbalance % [-] | |
|---|---|---|---|---|---|---|---|---|---|---|
| Tuesday | AM | 7:00–8:00 | 1630 | 320 | 190 | 488 | 1840 | 2903 | 51 | 1 |
| 8:00–9:00 | 1993 | 623 | 648 | 375 | 1974 | 3960 | 343 | 7 | ||
| 9:00–10:00 | 1695 | 455 | 523 | 440 | 1893 | 3550 | 334 | 8 | ||
| PM | 3:00–4:00 | 3060 | 313 | 985 | 255 | 1983 | 5899 | 439 | 7 | |
| 4:00–5:00 | 3230 | 295 | 1295 | 205 | 1893 | 6298 | 380 | 6 | ||
| 5:00–6:00 | 3852 | 320 | 135 | 483 | 1648 | 5025 | 193 | 3 | ||
| Thursday | AM | 7:00–8:00 | 1683 | 483 | 445 | 433 | 1040 | 2008 | 244 | 8 |
| 8:00–9:00 | 2490 | 338 | 455 | 420 | 828 | 2963 | 52 | 1 | ||
| 9:00–10:00 | 2520 | 245 | 543 | 460 | 615 | 3135 | 162 | 4 | ||
| PM | 3:00–4:00 | 3441 | 300 | 460 | 333 | 1113 | 4811 | 430 | 8 | |
| 4:00–5:00 | 3968 | 415 | 298 | 485 | 965 | 4029 | 302 | 6 | ||
| 5:00–6:00 | 4019 | 333 | 145 | 398 | 1175 | 5025 | 417 | 7 | ||
| Sunday | AM | 7:00–8:00 | 2570 | 323 | 210 | 450 | 915 | 2825 | 97 | 3 |
| 8:00–9:00 | 3108 | 298 | 443 | 648 | 1105 | 3445 | 265 | 6 | ||
| 9:00–10:00 | 3873 | 495 | 308 | 1089 | 494 | 2693 | 398 | 9 | ||
| PM | 3:00–4:00 | 3601 | 308 | 325 | 313 | 1058 | 4474 | 111 | 2 | |
| 4:00–5:00 | 4862 | 450 | 202 | 593 | 818 | 4342 | 497 | 9 | ||
| 5:00–6:00 | 4573 | 405 | 240 | 498 | 1025 | 4512 | 423 | 8 | ||
3.1.2. LOS analysis
The LOS outcomes for the base year (2024) and target year (2034) depicted bad performance, especially the L.H.S. Table 7 illustrated the LOS for both base year and target year without mitigation for the peak highest collected traffic volumes for the entrances/exits of the selected study area.
Table 7:
LOS for base year (2024) and target year (2034) without mitigation [-]
| Station No. | Details | LOS | |
|---|---|---|---|
| Base Year (2024) | Year (2034) without mitigation | ||
| P1 | R.H.S | D | F |
| P2 | L.H.S | F | F |
In order to improve the LOS, there is a need to propose some practical mitigation strategies. For instance, constructing an additional lane for both sides before entering the zone of the military checkpoint resulted LOS C and D for opening and target years successively, which is regarded as an acceptable performance as in Table 8.
3.2. Statistical analysis results
The outcomes of the statistical analysis revealed that the highest recorded frequency was between 70 and 74 km/hr, encompassing for 19.8% of the data sample as in Table 9. The next class ranged between 75 and 79 km/hr, which comprises around 18.6%. Also, the class between 65 and 69 km/hr revealed a percentage of 16.2. The clustering reveals an essential central tendency, with the majority of traffic occurring between 65 and 79 km/hr. In addition, the mode was located in the range between 70 and 74 km/hr, which indicates the most normal travel speed.
The outcomes of median speed, the 50th percentile (P50), were recorded within the range between 65 and 69 km/hr, which indicates that half of the detected vehicles were driving up to a speed of 68 km/hr. In like manner, the 85th percentile speed (P85), which is used as a standard design or as an administrative benchmark, ranged between 75 and 79 km/hr, indicating that 85% of vehicles were driving up to the speed of 78 km/hr.
The cumulative percentage analysis in Table 9 demonstrates that around 85.8% of vehicles drove up to a speed of 85 km/hr, whereas solely 6.4% drive under 60 km/hr. This means that in reality, slow speeds are uncommon.
The overall variation of speed can be decreased by the restricted speed frequency. However, by passing faster vehicles, speed fluctuations may be restricted when the driving speeds was ranged between 55 and 64 km/hr. Table 9 depicts the impact of the presence of heavy vehicles on controlling the traffic stream’s profile of speed, directing on vehicle speeds within the average range with outliers decreasing. This could boost flow stability, but it further increases the chance of overtaking conflicts, especially when vehicles drive slower than the adjacent flow.
Table 9:
Statistical outcomes of analysis
| Speed Class [km/hr] | Class Mid Value (ui) [km/hr] | Frequency fi [-] | Percentage of fi [-] | Cumulative Percent of fi [-] | P85 [-] | P50[-] |
|---|---|---|---|---|---|---|
| <55 | 7 | 1.4% | 1.4% | 1.4% | 1.4% | |
| 55–59 | 57 | 25 | 5.0% | 6.4% | 6.4% | 6.4% |
| 60–64 | 62 | 56 | 11.2% | 17.6% | 17.6% | 17.6% |
| 65–69 | 67 | 81 | 16.2% | 33.9% | 33.9% | 33.9% |
| 70–74 | 72 | 99 | 19.8% | 53.7% | 53.7% | 0.0% |
| 75–79 | 77 | 93 | 18.6% | 72.3% | 72.3% | 0.0% |
| 80–84 | 82 | 67 | 13.4% | 85.8% | 0.0% | 0.0% |
| 85–89 | 87 | 34 | 6.8% | 92.6% | 0.0% | 0.0% |
| 90–94 | 92 | 21 | 4.2% | 96.8% | 0.0% | 0.0% |
| 95–99 | 97 | 10 | 2.0% | 98.8% | 0.0% | 0.0% |
| >99 | 6 | 1.2% | 100.0% | 0.0% | 0.0% | |
| 499 | 100% | |||||
The calculated average speed was estimated to be equal to 74.1 km/hr, indicating central tendency of the speed distribution across all the evaluated vehicles. The calculated standard deviation (i.e., equal to 10.15 km/hr) revealed a significant dispersion of speed values around the value of mean. This indicates that most vehicles drove near the average speed and some fluctuation arose due to the slower or faster movement of vehicles as illustrated in Table 10 and Figure 6(a).
The speed group of modal outcomes, 70–74 km/hr, determining the most frequently observed range of speed, indicates a certain amount of clustering of speed as depicted in Table 10 and Figure 6(b). Besides, the pace, considered as the range of 10 km/hr speed, included the highest number of vehicles and ranged between 69 and 79 km/hr. This range of speeds endorsed the concentration of vehicle speeds near the median values and indicated an efficient traffic flow with less disruption, as in Table 10 and Figure 6(c).
The measured 85th percentile speed at 84 km/hr is illustrated in Table 10 and Figure 6(d). The measured proximity of P85 to the mean speed confirms the notion that the speed distribution is properly regulated with the presence of little driving vehicles. Moreover, the 50th percentile speed (P50) was determined at 74 km/hr, which is particularly identical to the calculated mean of 74.1 km/hr. The proximity of both means and median indicated that the distribution of speed was somewhat symmetrical, with neither significant skewedness to lower nor higher speeds. According to the traffic flow analysis, this correlation indicates regulated traffic conduction when half of the travelling vehicles are driving with less than 74 km/hr. These outcomes reflected the existence of a consistent and predictable pattern of speeds within the traffic flow.
Table 8:
Statistical outcomes with trucks
| Parameter [km/hr] | Value |
|---|---|
| Arithmetic Average Speed (ū): | 74.1 |
| Standard Deviation (σ): | 10.15 |
| From chart, Mode | 70–74 |
| Pace: | 69–79 |
| P85 | 84 |
| P50 | 74 |
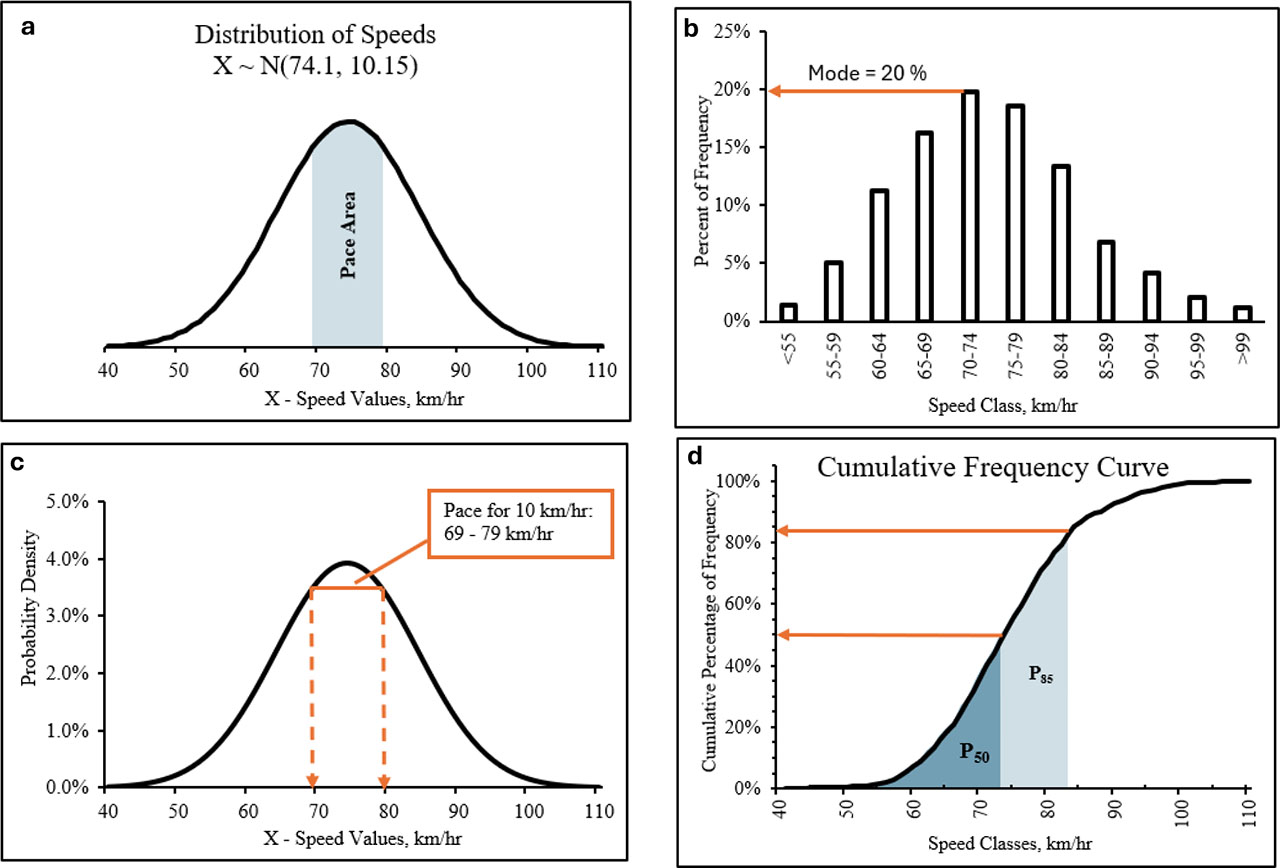
Figure 6:
Statistical outcomes with trucks [km/hr]
The second selected scenario and due to the absence of heavy vehicles, the arithmetic mean speed recorded as 76.0 km/hr, implying that the vast majority of travelling vehicles drove at high rates as in Table 11 and Figure 7 (a). The recorded standard deviation, 9.98 km/hr, illustrated an acceptable dispersion level. The modal speed group, which accounted for 70–74 km/hr of the total observations, recorded as a certain degree of speed uniformity among the vehicles as in table 11 and Figure 7 (b). Likewise, the pace, was ranged between 72 and 82 km/hr. This constrained and range of central pace prompts the findings of the consistent traffic flow with few interruptions as shown in Table 11 and Figure 7 (c).
Table 11 and Figure 7 (d) demonstrate that the speed of the 85th percentile (P85) was 87.5 km/hr. This illustrates that 85% of vehicles drove at or below this speed. In addition, the small variance between the average and P85 implies a narrow speed. The median speed (P50) was resulted to be 75.5 km/hr, which is fairly similar to the arithmetic mean value and indicates the speed uniformity.
Table 9:
Statistical outcomes without trucks
| Parameter [km/hr] | Value |
|---|---|
| Arithmetic Average Speed (ū): | 76.0 |
| Standard Deviation (σ): | 9.98 |
| From chart, Mode | 70–74 |
| Pace: | 72–82 |
| P85 | 87.5 |
| P50 | 75.5 |
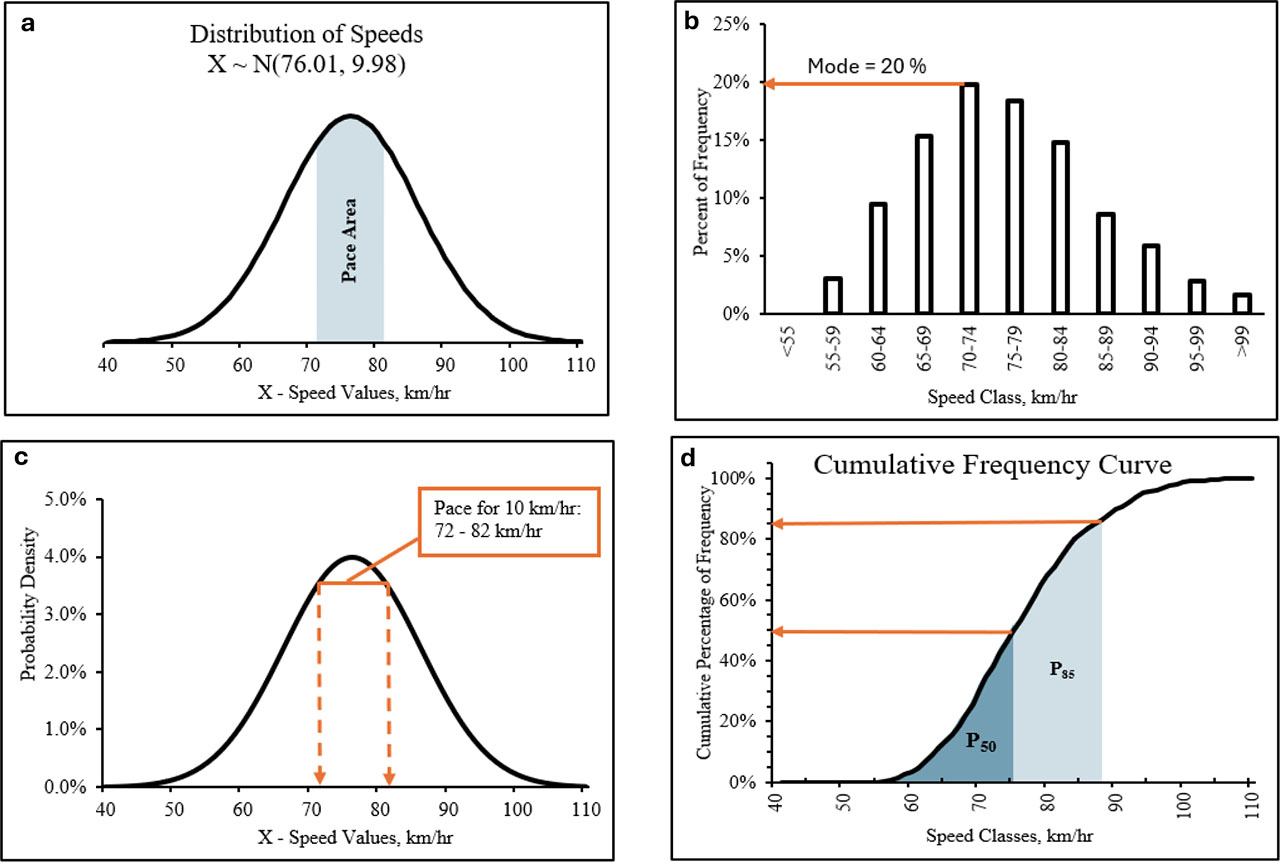
Figure 7:
Statistical outcomes without trucks [km/hr]
For the second scenario, the absence of heavy vehicles, Table 12 shows that both pace and average speed increased slightly, while standard deviation dropped. In particular, both P50 and P85 were increased, showing more scattered and higher speeds, indicating more free flow with fewer delay at the case of the absence of heavy vehicles.
The class of modal speed (i.e., mode = 70–74 km/hr and the pace is (69–79 km/hr) depicted that the common speed was within a limited range. These results illustrate steady behaviour of drivers in the presence of heavy vehicles within sustained traffic flow. The normality of speed distribution makes both central tendency and dispersion measures relevant. In addition, time mean speed is 74.1 km/hr and it is close to the modal and median speeds, which reflects the normality of distribution. Besides, the standard deviation illustrated much variation with the value of 10.15 km/hr, located within the predicted operating range. Speed variation recorded 10 km/hr at the case of vehicles overtaking. For the aspects of congestion management and capacity assessment, this variation is crucial when it impacted around half of vehicles. In addition, the 85th percentile speed (84 km/hr) illustrates a vital guidance for the design plannings and standard purposes. It is worth mentioning that the speed distribution of passenger vehicles moves upward at the case of the absence of heavy vehicles. By indicating of flow improvement and mobility increasing, the range of speeds from 72 to 82 km/hr was still within the class of modal of 70–74 km/hr. Moreover, increasing of average speed (reaching till 76 km/hr) indicated a declining in traffic flow. More uniformity with fewer changes for overtaking was resulted due to the standard deviation outcomes, which was equal to 9.98 km/hr. Under consistent traffic circumstances, the median speed value increased to 75.5 km/hr, and the 85th percentile speed reached to 87.5 km/hr. These reflect more aggressive driving behaviour, besides higher acceptable driving speeds. It is worth mentioning that removing heavy vehicles decreases the difference of speeds, which is crucial for offering safe passing intervals. Thereby, travel time and total flow adaptability declined with increasing both traffic speed and uniformity.
Though LOS and statistical speed analysis were performed independently, the outcomes reveal logical consistency. Bad LOS at the base year correspond to constrained and clustered speed distributions, indicating congested and unstable flow. LOS improvement by lane expansion revealed better operational characteristics. Thus, LOS reflects road capacity, whereas speed analysis of statistic examines behaviour of traffic and stability of flow. In tandem, both analysis assist finding the optimum strategy for the mitigation of congestion. It is worth mentioning that this study enhances civil engineering expertise by allowing highway capacity estimation and geometric review of designs utilizing analysis of LOS. The findings propose engineering-based measures to develop and enhance future performance.
4. Conclusion
The assessment of traffic congestion by inspecting, analysing, and optimizing the best solutions is crucial to mitigate the sequences of bottlenecks. Hence, to employ both LOS and statistical assessments, a segment of Expressway No.1, regarded as the main social and economic routes of road users in Iraq, was selected for an in-depth analysis. Three steps of methodology were taken into consideration to perform the analysis over the selected study area. Through these steps of integration, this study acknowledged the best optimization option for congestion alleviation when the methodology is applied systematically and precisely. A selected set of twelve stations near Al-Soqur checkpoint for traffic volumes and speed collection was to cover the study area. The peak time periods are varied as per each direction. For instance, the peak time period for the right-side (R.H.S) direction is recorded between 9:00 and 10:00 AM in station P1, while the peak time for the left-side (L.H.S) direction is indicated between 4:00 and 5:00 PM at station P2.
For the VBA outcomes, the results illustrated that the imbalance percentages ranged between 1% and 9% for both directions, which were generally within an acceptable threshold of 10%. This variation in volumes between P1/P2 and P11/P12 reflects the adverse impact of the bureaucratic inspection procedures through the military checkpoint, which can cause speed reduction, queuing formation, and congestion creation. However, this variance is still within an acceptable tolerance, and the collected dataset had an adequate balance and can be utilized for further analysis without any further correction. For LOS analysis, HCS-2010 was utilized with the optimum traffic volumes for both directions (L.H.S and R.H.S) for the base (2024), opening (2025), and target (2034) years. Bad LOS had been recorded for the base year when recorded D and F for R.H.S and L.H.S successively. Nevertheless, adding an additional lane for both directions enhanced LOS to C during the opening year and D during the target year.
Every statistical parameter was contrasted to the two selected scenarios (i.e., with the presence and absence of heavy vehicles). The statistical analysis outcomes illustrated that in the case of the presence of heavy vehicles, speeds clustered between 65–79 km/hr, with the mean and median around 74 km/hr and P85 around 84 km/hr. These results depicted controlled but confined flow with more overtaking capability. At the case of the absence of heavy vehicles, the average speed jumped to 75.5 km/hr, P85 increased to 87.5 km/hr, and variability decreased. These outcomes indicated a quicker but less flexible traffic flow. Generally, heavy trucks decreased average speeds while improving traffic stability. However, their absence promoted speed uniformity but may diminish manoeuvrability and safety margins. The findings of this study align with some accomplished studies demonstrating that the presence of heavy vehicles impedes traffic and maintains flow (Roh et al., 2021; Moridpour et al., 2015). In the case of mixed traffic, lane increase strategies improve LOS and reduce bottleneck creation (Ramadan and Sisiopiku, 2016).
Like others, this study has limitations. Due to the shortage of datasets, only one segment was selected, and the analysis is limited to traffic performance assessment for capacity improvement utilizing volumes and speed datasets. Thus, these outcomes should be regarded as operational recommendations rather than entire traffic management plans. However, this segment is regarded as one of the major entrances from the west of Baghdad. In addition, multiple kinds of approaches, such as capacity, speed-flow-density, or delay analysis, could have been performed, but the selected method offers specific advantages when it converts technical traffic metrics into user response satisfaction with performance. It is worth mentioning that this study introduces an actionable insight for mitigating congestion by integrating both LOS and statistical assessments. The findings support the proposed infrastructure developments, such as truck parking bays and checkpoint improvements, which enhance both safety and logistics. It also offers standardized outcomes into a meaningful measure for decision-makers and planners in similar urban-expressway environments. Further research on the area of traffic congestion mitigation is strongly endorsed. In order to capture the traffic patterns, there is a crucial need to expand the assessment over different routes in the selected region. Besides, sophisticated methods usage like machine learning or simulation-based methods together with traffic variables such as severity datasets or temporal variations could enhance both reliability and applicability of the outcomes. A robust evidence framework can be illustrated by continues research for infrastructure development, congestion mitigation, and road safety justification. Besides, incorporating simulation and management approaches for analysis enhancement. Finally, future studies can be utilized from the traffic distribution outcomes of this study for further investigation of travel patterns, funding infrastructure expansion, evaluating the impacts of new projects, and boosting traffic performance assessment strategies.
List of Abbreviations
| Abbreviation | Full Term |
|---|---|
| AASHTO | American Association of State Highway and Transportation Officials |
| AM | Ante Meridiem (Morning Peak Period) |
| HCM | Highway Capacity Manual |
| HCS-2010 | Highway Capacity Software (Release 6, McTrans Center, University of Florida) |
| km/h | Kilometres per Hour |
| L.H.S | Left-hand side of the selected segment of Expressway no. 1 |
| LOS | Level of Service |
| P50 | 50th Percentile Speed (Median Speed) |
| P85 | 85th Percentile Speed |
| PCU | Passenger Car Unit |
| PM | Post Meridiem (Evening Peak Period) |
| R.H.S | Right-hand side of the selected segment of Expressway no. 1 |
| RBD | Roads and Bridges Department |
| VBA | Volume Balance Analysis |
| vph | Vehicles per Hour |