

1. Introduction
The structure of a bridge plays a crucial role in infrastructure development, economic growth, and human mobility. By connecting two separated regions, bridges facilitate the movement of people and goods, thereby enhancing a country’s economic productivity. Recognizing this vital function, governments regulate bridge construction and maintenance through applicable technical standards and building codes to ensure safety and durability throughout their service life. To achieve these objectives, authorities collaborate with construction experts to carry out regular inspections, monitoring, and maintenance of bridge structures to prevent damage or structural failure that could endanger human lives.
However, in practice, structural monitoring is often conducted less effectively. When it is performed, the process typically relies on manual visual inspection using basic tools (Furukawa & Kiyono, 2004). Although visual inspection can yield accurate information when proper protocols are followed, its results depend heavily on the inspector’s skill and experience. If the operator can correctly identify existing damage, the inspection results can support safe and effective decisions regarding the bridge’s load-bearing capacity (Bernardini & Carnevale, 2021). To overcome the limitations of visual inspection, researchers have developed Structural Health Monitoring Systems (SHMS)—automated systems designed to detect early signs of structural damage by analysing the dynamic behaviour of structures. The Structural Health Monitoring Systems (SHMS) has become a key approach in ensuring the safety and extending the service life of complex structures such as steel truss bridges. Furthermore, Structural Health Monitoring Systems (SHMS) contributes significantly to damage assessment, providing information across five progressive levels of structural condition (Comisu et al., 2017; Malekloo et al., 2021; Neves et al., 2018).
Damage identifying.
Detecting the location of damage.
Determining the type of damage.
Measuring the extent of damage.
Predicting the service life of the structure.
Currently, research efforts are increasingly focused on developing Structural Health Monitoring Systems (SHMS) based on vibration-based damage detection. This method is considered effective (Chang & Kim, 2016; Frigui et al., 2018; Raedersdorff et al., 2026) for identifying damage in highly complex structures (Frigui et al., 2018; Moradipour et al., 2017), even when only partial damage occurs in structural elements due to material deterioration, environmental influences, or human factors. Detecting structural damage through vibration analysis is particularly important in structural engineering, as localized damage can reduce the functional lifespan of a structure or lead to failures that endanger human lives. Even minor damage to a structural element can affect the dynamic behaviour of a bridge, which may ultimately have a significant impact on its operational safety (Klusáček et al., 2026). Damage in structures typically results in a reduction of stiffness, which can be identified through changes in natural frequency, mode shape, and damping ratio (Patil & Ahiwale, 2021).
In response to the aging condition of many bridges worldwide, several countries have begun assessing bridges that are no longer effective in order to take preventive actions, such as maintenance or structural rehabilitation (Desai et al., 2024; Kraľovanec & Moravčík, 2022). For example, Japan reported in 2012 that 9% of all bridges were no longer effective and had exceeded their 50-year service life (Chang & Kim, 2016). In Europe, approximately 35% of bridges have been in service for more than 100 years (Casas & Moughty, 2017). In the United States and the United Kingdom, it is noted that 7.5% of bridges are classified as inefficient (Saman et al., 2021), and 56% of structural failures occur in steel truss bridges compared to girder bridges. Similarly, in Indonesia, data from the 2020 Bridge Visual Inspection (INVI-J) program show that about 5.3% of bridges have exceeded their 50-year service life, whereas 68.1% fall within the 10–50-year service life range. (Santoso et al., 2021). Given these conditions and the increasing number of bridge failures reported in various regions, there is a growing awareness of the need to evaluate both existing and newly constructed bridges through the implementation of Structural Health Monitoring Systems (SHMS). This proactive approach is essential to ensuring public safety, maintaining structural performance, and minimizing the risk of catastrophic structural failures (Deng et al., 2015; Ho & Le, 2017).
To achieve these objectives, various studies have been conducted to enhance the contribution of Structural Health Monitoring Systems (SHMS), particularly through vibration-based damage detection techniques (Chang & Kim, 2016; Yin & Zhu, 2018). In recent years, more advanced and sophisticated approaches for bridge monitoring have been developed, including data-driven and machine learning–based methods, hybrid vibration–based frameworks, and smart sensor network systems. These approaches enable automated damage detection, pattern recognition under noisy conditions, and efficient handling of large-scale monitoring data (Desai et al., 2024; Malekloo et al., 2021; Nick & Aziminejad, 2021). Furthermore, integrated SHM platforms combining modal analysis with artificial intelligence and advanced signal processing techniques have shown promising results for complex bridge structures (Ho & Le, 2017; Klusáček et al., 2026). While these emerging techniques offer high accuracy and automation, they often require extensive training data, computational resources, and complex system implementation. Therefore, vibration-based and modal-based methods remain highly relevant as robust, interpretable, and cost-effective techniques for damage detection, particularly for steel truss bridges where reliable identification of damage location is essential. This study focuses on evaluating and comparing modal-based damage detection methods through both experimental testing and numerical analysis.
Despite their effectiveness, many vibration-based SHM applications are still limited to achieving only Level 1 damage detection, namely identifying the presence of damage without accurately locating it (Chun et al., 2020). Consequently, increasing research efforts have been directed toward developing methods capable of reliably determining damage locations within structures. For example, Rucevskis and Wesolowski (Rucevskis & Wesolowski, 2010) analysed changes in Mode Shape Curvature Squares (MSCS) as a potential method for identifying damage locations. The advantage of this method lies in its ability to detect damage without requiring complete modal data. Their experimental investigation successfully identified damage in two aluminium beams containing machine-cut notches of various sizes and locations. Maia et al. (Maia et al., 2003) employed Frequency Response Functions (FRF) to detect damage in simple beams through experimental testing and numerical simulations, comparing several detection approaches based on changes in mode shapes.
Leslie et al. (Leslie, 2017) studied mode shape curvature (MSC) in a Bowstring Girder bridge using the Staad Pro program to detect damage locations in the bridge. In their analysis, mode shape curvature (MSC) was able to display changes in absolute modal curvature in three damage scenarios within the damage area of the Bowstring Girder model, indicating that the mode shape curvature method shows potential for damage detection in this type of bridge.
Janeliukstis et al. (Janeliukstis et al., 2019) used the mode shape curvature squares method to determine the location of crack damage in full-scale prestressed concrete sleepers. The concrete sleepers were tested under the first crack and 1.5 times the load of the first crack using an experimental setup in accordance with British Standards.
Chun Chang and Woo Kim (Chang & Kim, 2016) conducted field experimental tests on a simple steel truss bridge with four sequentially applied artificial damage scenarios. The values of the multiple modal assurance criterion (MAC) and the coordinate modal assurance criterion (COMAC) were effective features sensitive to the tested damage scenarios. However, each method was only sensitive to specific damage scenarios. Modal frequencies were also observed to detect the tested damage, showing a decrease in frequency as the damage model was applied, indicating a loss of global structural stiffness.
Moradipour et al. (Moradipour et al., 2017) tested the application of the Modal Strain Energy (MSE) method on a laboratory-scale steel truss bridge (scale 1:25) through both numerical and experimental approaches. Two artificial damage scenarios, including single damage and multiple damages to structural elements, were applied. The results indicated that the MSE method performed effectively on complex bridges.
Arfiadi et al. (Frans et al., 2017) conducted a comparative study of the mode shape curvature method and the damage locating vector method to predict damage in structures numerically. Their research presented three test models (a building, a concrete beam, and a steel frame). In their numerical study, both methods demonstrated good sensitivity in identifying damage.
In this study, a comparison will be made of methods for detecting vibration-based damage in steel truss bridge structures through numerical analysis and experimental testing. Three types of artificial damage with different locations will be applied in both the experimental and numerical tests. The study will focus on analysing changes in mode shapes to detect the tested damage locations. A challenge in applying these methods is detecting vibration-based damage in a complex structure like a steel truss bridge. This method will be experimentally tested on a laboratory-scale steel truss bridge at a 1:12 scale in the laboratory.
2. Modal Based Methods
Based on previous research, it has been demonstrated that mode shape curvature (MSC) is highly sensitive to damage and can directly indicate the location of damage (Frans et al., 2017; Rucevskis & Wesolowski, 2010). This method is considered straightforward because it is based on changes in the vibrational mode shapes of structures subjected to dynamic loads, commonly referred to as modal displacement.
The fundamental principle of its application is based on comparing the measured modal displacements between the intact and damaged structural conditions, allowing for the detection of damage locations at points where the largest differences occur. This makes the mode shape curvature (MSC) method one of the effective techniques for detecting damage locations in structures. When damage occurs in a member, there will be a reduction in stiffness in the damaged member, resulting in an increase in the curvature index (Frans et al., 2017). One advantage of this method is that the mode shapes remain relatively stable against noise effects. However, a challenge in applying this method is that mode shape curvature (MSC) is not very sensitive to minor damage, according to previous studies.
The damage location detection method using mode shape curvature squares (MSCS) in structural beam research conducted by Rucevskis and Wesolowski (Rucevskis & Wesolowski, 2010) has been developed to detect damage locations in members of steel truss bridge structures. The following modal analysis methods are utilized:
1. Mode Shape (MS) Damage Index
This method is a displacement-based approach that evaluates damage by comparing the mode shapes of intact and damaged structures (Maia et al., 2003; Rucevskis & Wesolowski, 2010). The damage index is defined as:
Where:Δvi – mode shape (MS) damaged index for the considered mode,
– modal displacement of the damaged structure,
vi – modal displacement of the intact structure,
i – measurement point.
The fundamental idea of the mode shape (MS) damage index is based on the direct comparison of modal displacements between intact and damaged structures. Damage is indicated at locations where significant differences in modal displacement occur. To summarize the results for all modes, the following index is used:
Where:N – total number of mode shape measurement,
Δvi – mode shape (MS) damaged index for each mode.
2. Mode Shape Slope (MSS) Damage Index
This algorithm uses changes in the slope of the mode shape (Rucevskis & Wesolowski, 2010). Local disturbances in experimental measurements may introduce irregularities in the mode shape, which appear as peaks in the slope profile and can be associated with damage locations. To reduce the influence of measurement noise, the damage index is averaged over multiple modes.
Where:– mode shape slope (MSS) damaged index for the considered mode,
– modal slope of the damaged structure,
– modal slope of the intact structure,
i – represents the measurement point.
vi+1 – modal displacement at the subsequent point (i+1),
vi−1 – modal displacement at the preceding point (i−1),
h – distance between two consecutive measurement points.
If there are multiple mode measurements, the index is used.
3. Mode Shape Curvature (MSC) Damage Index
In this method, damage is identified based on changes in mode shape curvature (second spatial derivative) between intact and damaged structure (Rucevskis & Wesolowski, 2010). The underlying concept is that the curvature of a healthy structure is generally smooth and can be approximated using a polynomial function. By comparing the curvature of the damaged structure with that of the intact structure, localized damage can be detected (Janeliukstis et al., 2019).
Where: Where:– mode shape curvature (MSC) damaged index for the considered mode,
– modal curvature of the damaged structure,
– modal curvature of the intact structure,
vi+1 – modal displacement at the subsequent point (i+1),
vi−1 – modal displacement at the preceding point (i−1),
h – distance between two consecutive measurement points.
If there are multiple mode measurements, the index is used.
4. Mode Shape Curvature Square (MSCS) Damage Index
The damage index is defined as follows:
Where:– mode shape curvature square (MSCS) damaged index for the considered mode,
– modal curvature square of the damaged structure,
– modal curvature square of the intact structure.
If there are multiple mode measurements, the index is used.
Among all the algorithms mentioned above, Rucevskis and Wesolowski (Rucevskis & Wesolowski, 2010) proposed the mode shape curvature square (MSCS) method for detecting damage locations in their research, as this method is deemed capable of identifying damage locations using only the mode shape of the tested damaged structure. All methods will be applied in this study to detect damage locations in steel truss bridges with several proposed damage scenarios.
Vibration-based damage detection is applied in experimental tests on steel truss bridges. This technique is part of non-destructive testing. It is proposed for global damage identification testing with various complexities (Fan & Qiao, 2011). The fundamental idea behind vibration-based damage detection is that damage can lead to a decrease in structural stiffness, thereby altering the dynamic properties of the structure, including mode shapes, modal damping, and natural frequencies (Fan & Qiao, 2011; Nick & Aziminejad, 2021). the design of the study, including whether it is experimental, observational, etc.
3. Analysis Procedure
The general research flow is presented in Figure 1. Initially, the steel truss bridge equipped with accelerometer sensors is subjected to dynamic loading. The dynamic behaviour of the structure under the applied loads is recorded by the accelerometer sensors. The recorded data are in the time domain, representing variations over time. The Fast Fourier Transform (FFT) method is employed to convert the structural response from the time domain to the frequency domain. In the experimental setup, in addition to the natural frequency of the structure, acceleration data are required to calculate the displacement at each measurement point. In both the experimental program and finite element analysis (FEA), seven structural models are considered. The first model is the intact model, representing an undamaged steel truss bridge. Damage with cutting element on centre (Dmg-CC) denotes a model with a torn diagonal member located at mid-span (0.5L). Damage with buckling element on centre (Dmg-BC) represents a model with a buckled element at mid-span (0.5L). Damage with empty element on centre (Dmg-EC) refers to a model with a removed element at mid-span (0.5L). Furthermore, damage with cutting element on edge (Dmg-CE) indicates a model with a torn diagonal member located near the span edge (0.2L), while damage with buckling element on edge (Dmg-BE) and damage with empty element on edge (Dmg-EE) represent models with buckled and removed elements, respectively, at the span edge (0.2L). Numerical analysis using modal-based algorithms is then applied to identify the damage locations in the steel truss bridge structure.
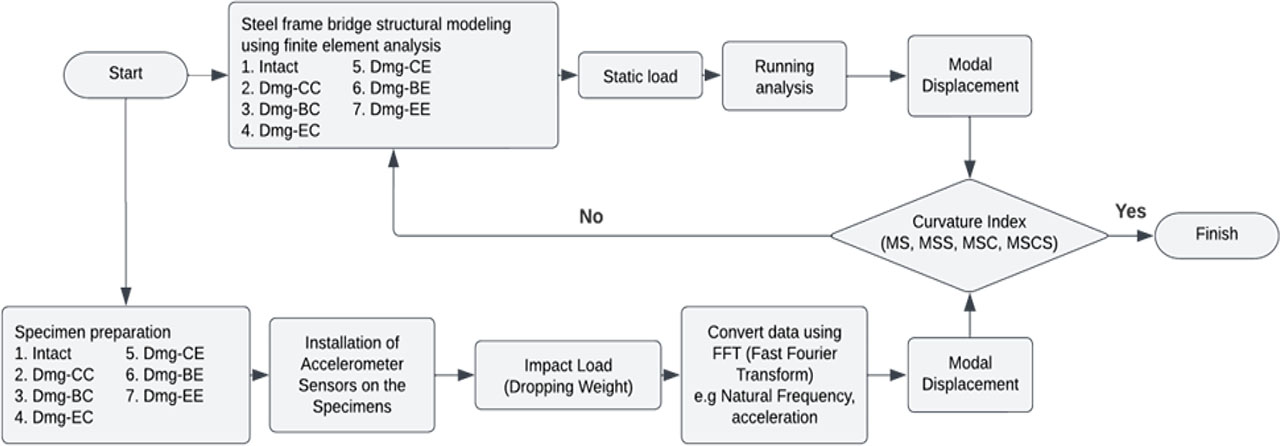
Figure 1:
General research flow
3.1. Model and Material Properties
To verify the validity and effectiveness of the modelled damage algorithm, a numerical modal analysis based on the Finite Element (FE) method was conducted using ABAQUS software. In this study, a symmetric damage model was applied to steel angle members, including various forms of cutting, buckling, and the removal of diagonal members in the main bridge truss at specific locations. The geometric configuration of the steel angle members is shown in Figure 2.

Figure 2:
Damage scenarios modelled in the experiment
The dimensions of the steel angle profile used are 30 × 30 × 3 mm. The damage scenarios applied to the steel angle members were introduced in the diagonal members. Figure 2 represents types of damage to structural elements of steel truss bridges that commonly occur in practice. Specifically, the geometry of the damage shown in Figure 2(a) consists of a cut with a length of 10 cm and a depth of 3 cm, which was applied in the experimental tests to the diagonal members of the main truss at positions 0.5L and 0.2L, respectively (see Figure 5 and Table 1). In addition, buckling damage with a bending angle of 165° was applied to the diagonal members of the main truss and tested alternately at the same positions (0.5L and 0.2L) (see Figure 5 and Table 1). Likewise, the damage scenario involving the removal of a diagonal member in the main truss was also tested alternately at these two positions (see Figure 5 and Table 1).
Table 1:
Models and damage scenario
| Models | Damage scenario | Damage location |
|---|---|---|
| Intact | - | - |
| Dmg-CC | Cutting diagonal members | L/2 (0.5 L) |
| Dmg-BC | Buckling diagonal members | L/2 (0.5 L) |
| Dmg-EC | Missing diagonal members | L/2 (0.5 L) |
| Dmg-CE | Cutting diagonal members | L/5 (0.2 L) |
| Dmg-BE | Buckling diagonal members | L/5 (0.2 L) |
| Dmg-EE | Missing diagonal members | L/5 (0.2 L) |
The cut damage is represented as a consequence of corrosion of the cross-sectional profile, which leads to a reduction in the stiffness of the affected member (Figure 3). The buckling damage represents conditions caused by impact loads that result in member bending (Figure 4). This type of damage is emphasized because many cases of bridge damage and even collapse occur not due to design or construction errors, but as a result of accidents, such as vehicles (cars or trucks) colliding with the structure (e.g., cars, trucks colliding with the structure) (Antonia, Menga Terje, Kanstad Daniel et al., 2022; Hardono et al., 2022). Meanwhile, the scenario involving the removal of a diagonal member is presented as an extreme case representing the loss of structural stiffness due to deterioration over the service life.
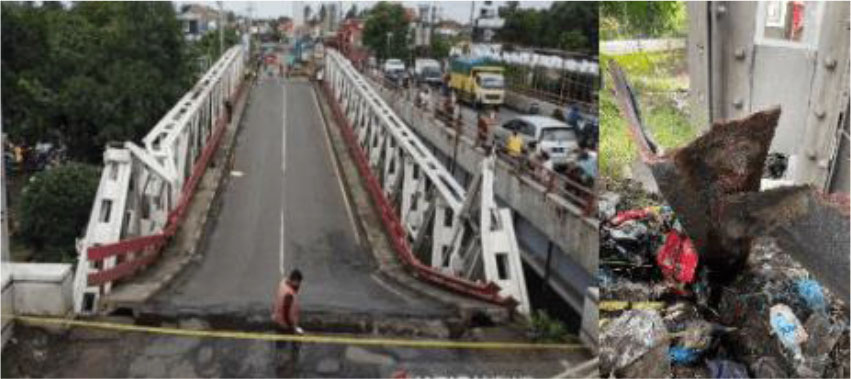
Figure 3:
Rembun Bridge after collapsing due to severe corrosion on the bottom chord (right)
The dimensions of both profiles are 650 mm. The material properties determined experimentally are: Young's modulus E = 200,000 MPa and density ρ = 7800 kg/m3. The geometry of the steel frame bridge specimen to be tested is as follows: span length, L = 5000 mm, bridge width, l = 840 mm, and bridge height, h = 700 mm. A summary of the model in this study is presented in Table 2 and Figure 5.
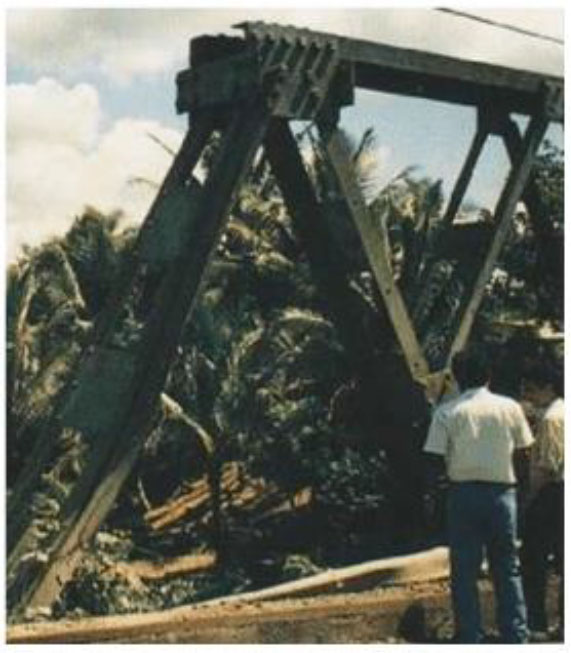
Figure 4:
The diagonal member at the end was struck by a vehicle
Table 2:
Section properties
| Members | Section properties [mm] |
|---|---|
| End post | L 30×30×3 |
| Upper chord | 2L 40×40×4 |
| Lower chord | 2L 40×40×4 |
| Diagonal members | L 30×30×3 |
| Portal strut | L 30×30×3 |
| Strut | L 30×30×3 |
| Girder | L 50×50×5 |
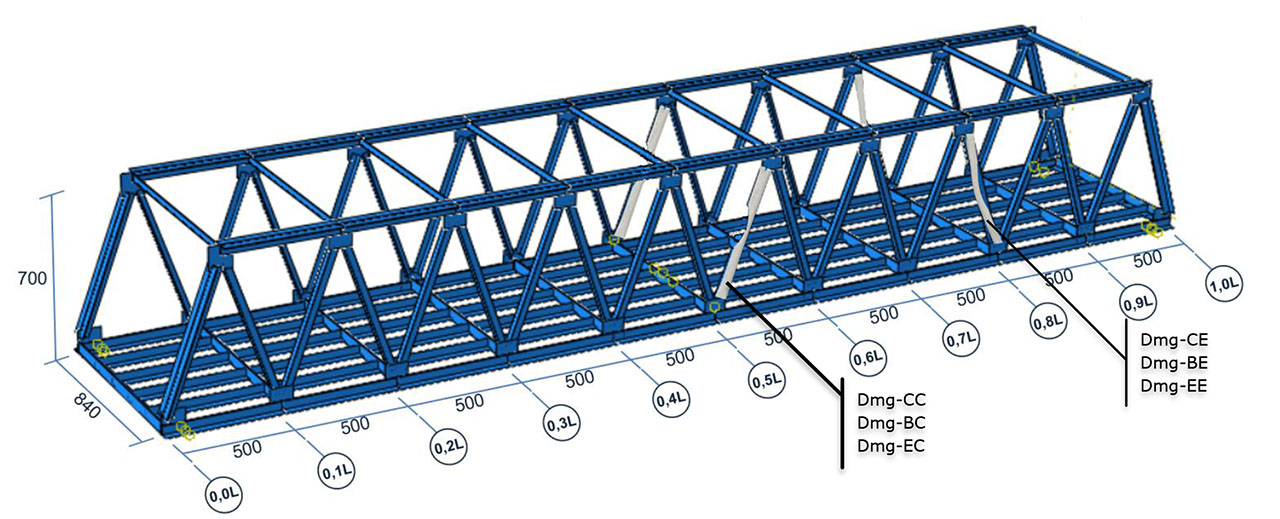
Figure 5:
Geometry of the steel frame bridge specimen
The finite element model for the steel frame bridge structure consists of three-dimensional structural elements (ABAQUS). Each node has three degrees of freedom: translation along the X and Y axis, and rotation about the Z axis. For the healthy elements, a constant stiffness EI is assumed for all elements, while the damaged elements are modeled by reducing the stiffness of the selected elements. The reduction in stiffness is achieved by decreasing the cross-sectional area in the damaged regions of the profile, which consequently reduces the moment of inertia.
3.2. Experimental Set-up
Experimental activities were conducted to obtain the dynamic behaviour of the structure in response to applied dynamic loads. The dynamic behaviour of the structure is assessed based on modal properties recorded by accelerometer sensors, including natural frequency and acceleration. Frequency and acceleration are used to evaluate the health condition and determine the location of damage in the bridge structure. This assessment is expressed in a modal-based curvature index. Referring to the working principle of curvature assessment, the peak values indicate the location where damage occurs.
In the experiment, two conditions of the structure will be tested: the intact bridge structure and the damaged one. The test specimen of the steel frame bridge is designed at a lab scale of 1:12 (Figure 6). A steel angle profile was chosen for use in the design of this lab-scale test specimen (Table 1).

Figure 6:
The steel frame bridge specimen
The general experimental setup consisted of a bridge specimen, accelerometer sensors, a USB gateway for data acquisition, the SensorConnect application for reading the recorded signals, and a computer system (Figure 7). A limited number of six accelerometer sensors were installed at specific locations along the structure. This limited number and spatial distribution of sensors directly affect the spatial resolution and the accuracy of mode shape determination, particularly in curvature estimation. To investigate and mitigate the impact of this limitation, a sensor relocation strategy was implemented at all measurement points along the main truss over the bridge span. This approach enhances spatial resolution, strengthens curvature-based analysis, and improves the reliability of mode-shape-based methods by producing sharper curvature peaks for damage localization.
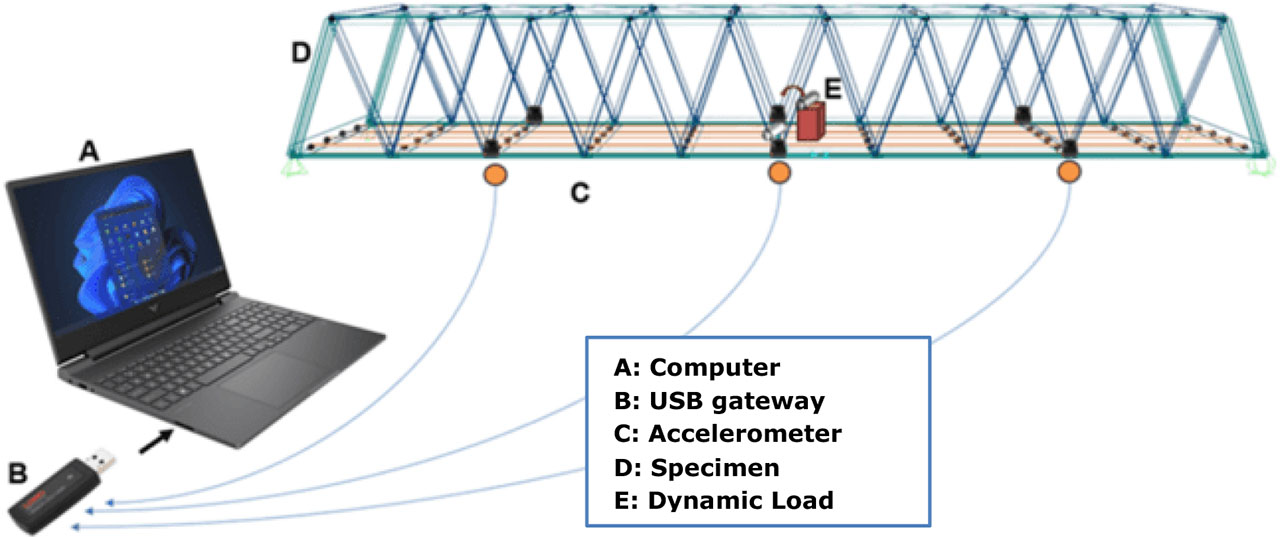
Figure 7:
General experimental setup
Several key points related to the experimental procedure are as follows: The dynamic load was applied using a concrete cylinder (Figure 8) dropped from a height of 7.5 cm at mid-span (0.5L), positioned between the longitudinal girders. Accelerometer sensors were installed on the main truss on both sides of the bridge and were placed sequentially at fixed positions of 0.4L, 0.5L, and 0.6L along the span (measured from the support), allowing all monitoring points to be recorded through a sensor relocation method.
The accelerometer sensors were arranged using a relocation method, in which sensors on the right and left sides of the bridge were tested at consecutively shifted locations to improve spatial resolution and the reliability of curvature-based analysis. During testing using the dropping-weight method, vibrations of the bridge were recorded by the accelerometer sensors, after which the data were transmitted via the USB gateway and displayed on a computer screen in the form of time-domain signals. Vibration data were recorded with a duration of 3 seconds for each test, using accelerometers with a sampling frequency of 256 Hz, and only the z-axis channel was analysed. The time-domain data were then converted into the frequency domain using the SensorConnect application. The time-domain measurement data were imported and used in the analysis to obtain displacement through numerical integration, by converting velocity into displacement at each measurement point derived from the accelerometer results. This method was applied to seven test conditions: intact, cutting element on center (Dmg-CC), buckling element on center (Dmg-BC), empty element on center (Dmg-EC), cutting element on edge (Dmg-CE), buckling element on edge (Dmg-BE), and empty element on edge (Dmg-EE) (Table 1). Each model was tested three times to evaluate the accuracy of the obtained data.
Hinge-roller boundary conditions were simulated by placing the bridge specimen on two pipes representing the hinge and roller supports. After impact, the vibration responses were recorded by the accelerometer sensors.
The hinge–roller boundary conditions were simulated by placing the bridge specimen on two pipes representing the hinge and roller supports. During the experiment, the bridge specimen was excited using a dropping weight. The excitation was applied by a concrete cylinder with a diameter of 15 cm and a height of 30 cm, dropped from a height of 7.5 cm (Figure 8). Following the impact, vibration responses were recorded by the sensors.
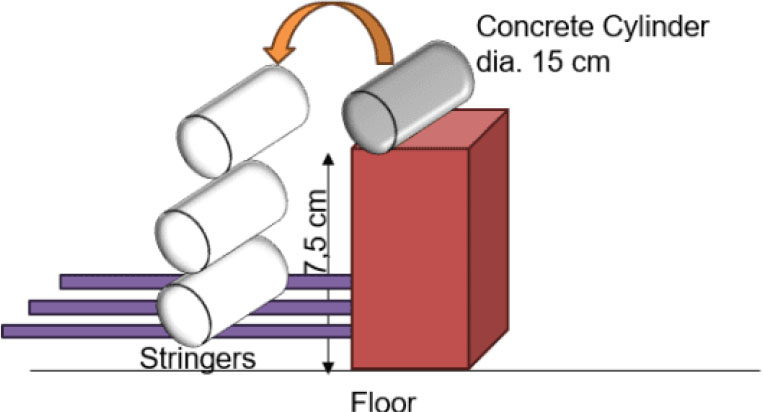
Figure 8:
Loading scheme
After measurements were taken at each location, the USB gateway automatically transferred the recorded data to the SensorConnect application, where the time-domain signals were displayed and subsequently transformed into the frequency domain using the Fast Fourier Transform (FFT) algorithm. This procedure was repeated until all scanning points had been measured. The natural frequencies and acceleration responses, representing the dynamic properties of the structure, were then extracted from the Fast Fourier Transform (FFT) results.
4. Result and Discussion
The first step in numerical analysis is bridge structure modelling. This model is adjusted according to the bridge specimen tested experimentally. The static load value is based on the weight of the load dropped as a dynamic load in the experiment, which is 12 kg. The static load is dropped from a height of 7.5 cm at the mid-span of the bridge. Due to this excitation, the bridge vibrates, and an accelerometer sensor records the dynamic behaviour of the structure. For comparison purposes, the damage index is also calculated using mode shape information obtained through finite element simulation. The results of the mode shape-based damage detection method are presented at each discussion point. Displacement values at each measurement point are obtained from the probe output of the finite element method. These values are then analysed using four comparison methods, presented in sections 4.1 to 4.6.
4.1. Dmg-CC Analysis
The FEM model was adjusted to match the experimentally tested bridge specimen in terms of geometry and section properties. The adjustment was performed through manual tuning of material and boundary parameters to minimize the difference between the numerical and experimental responses, particularly the global displacement and modal frequencies. This procedure ensures that the FEM reliably represents the bridge behaviour. The comparison between experimental and numerical results is presented in Figure 11 (Curvature Index of Each Method on the DMG-CC Model), demonstrating good agreement and validating the adopted FEM.
Figure 9 presents the damage model of a diagonal member with a cut section located at mid-span. The displacement at each measurement point was observed, and the obtained displacement values were adjusted to match the measurement locations in the experimental test. The results of the finite element analysis are shown in Figure 9, while Figure 10 displays the DMG-CC model used in the experimental testing.
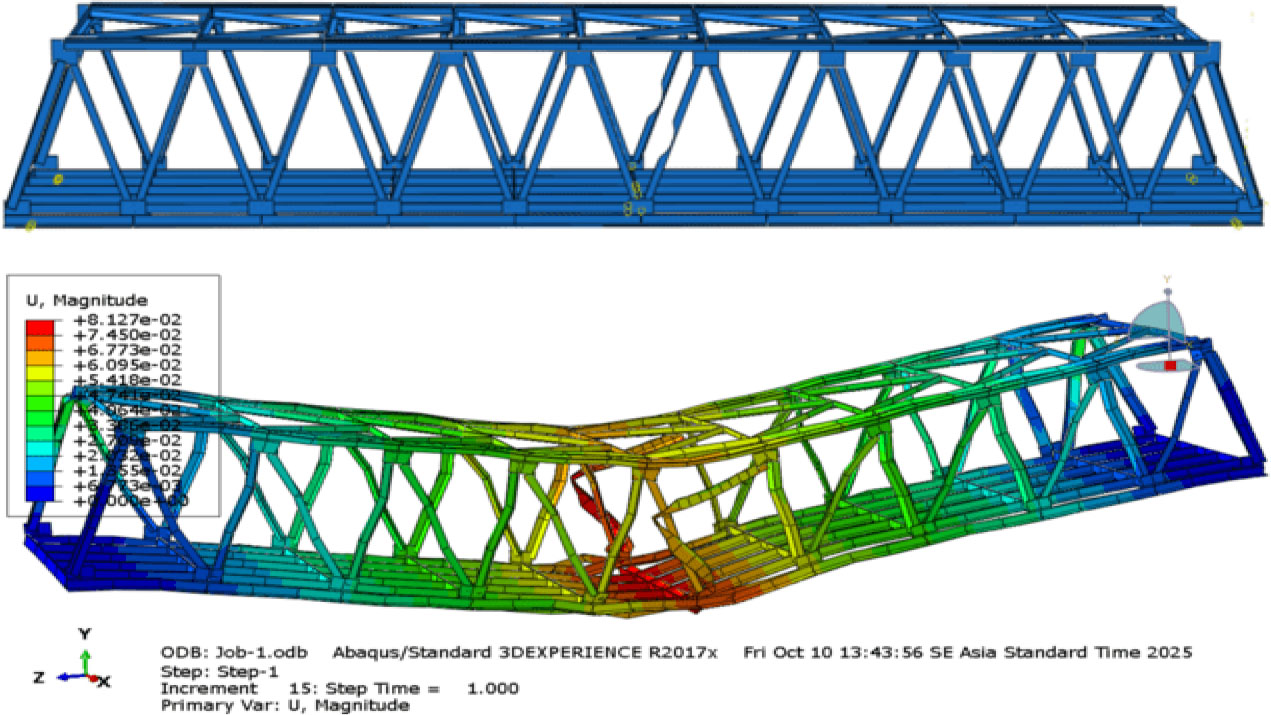
Figure 9:
Finite element model and modal displacement of the Dmg-CC structure
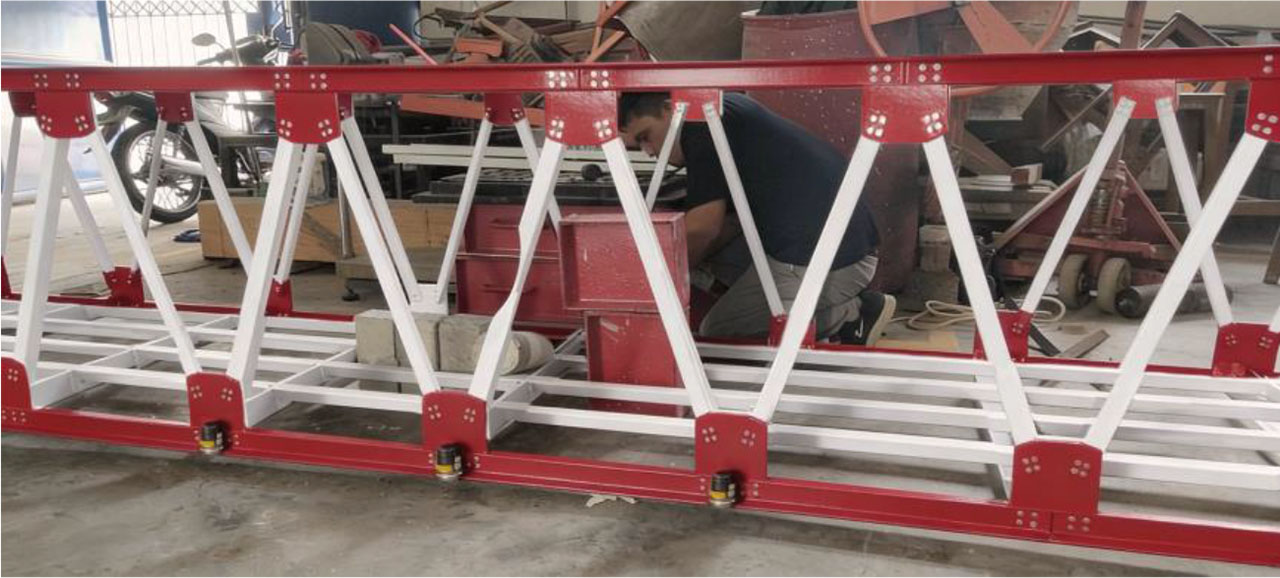
Figure 10:
Experimental simulation of mid-span diagonal member damage (Dmg-CC)
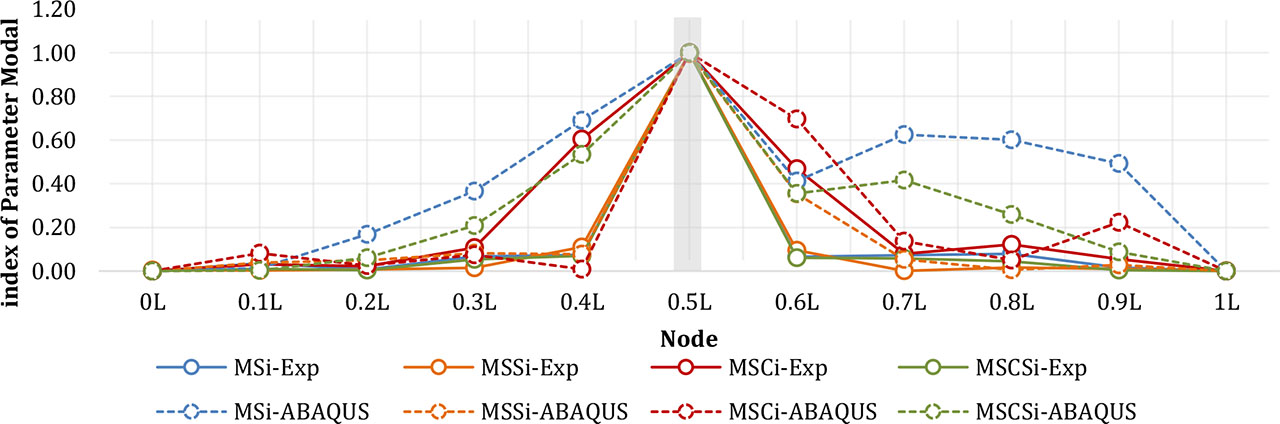
Figure 11:
Curvature index of each method on the DMG-CC model
The modal-based method was examined on the Dmg-CC damage model, with the introduced damage location highlighted in grey. Figure 11 shows that all damage index methods (MS, MSS, MSC, and MSCS) successfully identified the damage position according to the intended scenario. These three methods exhibited similar curvature index profiles, as observed in both numerical analyses and experimental mode shape measurements. Based on the curvature indices derived from numerically computed mode shapes, the highest peak appeared at the damage location, confirming that the proposed damage index methods are effective in detecting and localizing structural damage.
To evaluate the accuracy of the finite element method (FEM) results compared with the experimental data, error metric values were calculated (Table 1). Sum of Squared Errors (SEE), Mean Squared Error (MSE), and Root Mean Squared Error (RMSE) are statistical approaches used to measure the total deviation between the observed (actual) and predicted values (Hrehova et al., 2025). Smaller error metric values indicate a better agreement with the experimental results.
Table 3:
Comparison of modal damage index accuracy for mid-span diagonal cutting damage (Dmg-CC)
| Modal parameter | Squared displacement difference (unitless) | SSE | MSE | RMSE | ||||||||||
|---|---|---|---|---|---|---|---|---|---|---|---|---|---|---|
| 0.0L | 0.1L | 0.2L | 0.3L | 0.4L | 0.5L | 0.6L | 0.7L | 0.8L | 0.9L | 1.0L | ||||
| MSIi | 0.00 | 0.00 | 0.03 | 0.09 | 0.38 | 0.02 | 0.12 | 0.30 | 0.27 | 0.23 | 0.00 | 1.44 | 0.13 | 0.36 |
| MSSi | 0.00 | 0.00 | 0.00 | 0.00 | 0.00 | 0.00 | 0.07 | 0.00 | 0.00 | 0.00 | 0.00 | 0.08 | 0.01 | 0.08 |
| MSCi | 0.00 | 0.00 | 0.00 | 0.00 | 0.36 | 0.00 | 0.05 | 0.02 | 0.01 | 0.03 | 0.00 | 0.48 | 0.04 | 0.21 |
| MSCSi | 0.00 | 0.00 | 0.00 | 0.02 | 0.22 | 0.02 | 0.09 | 0.13 | 0.05 | 0.01 | 0.00 | 0.53 | 0.05 | 0.22 |
Table 3 presents the deviation between the responses of the intact and damaged structures. The squared displacement difference is defined as the square of the difference between the displacement index obtained from Abaqus and the experimentally measured modal displacement index, expressed as (iFE − iExp)2. Smaller values of the error metrics (SSE, MSE, and RMSE) indicate better agreement between the finite element analysis results and the experimental data. Based on these metrics, the mode shape slope (MSS) and mode shape curvature (MSC) exhibit relatively small error values, indicating that the MSS and MSC approaches provide high accuracy in detecting damage at the mid-span.
4.2. Dmg-BC Analysis
Figure 12 represents the structural modelling of buckling damage in the middle-span diagonal member. The modal displacement at each measurement point is observed. The measured displacement values are adjusted to match the experimental measurement points. The results of the finite element analysis are presented in Figure 12. Figure 13 displays the Dmg-BC model used in the experimental testing.
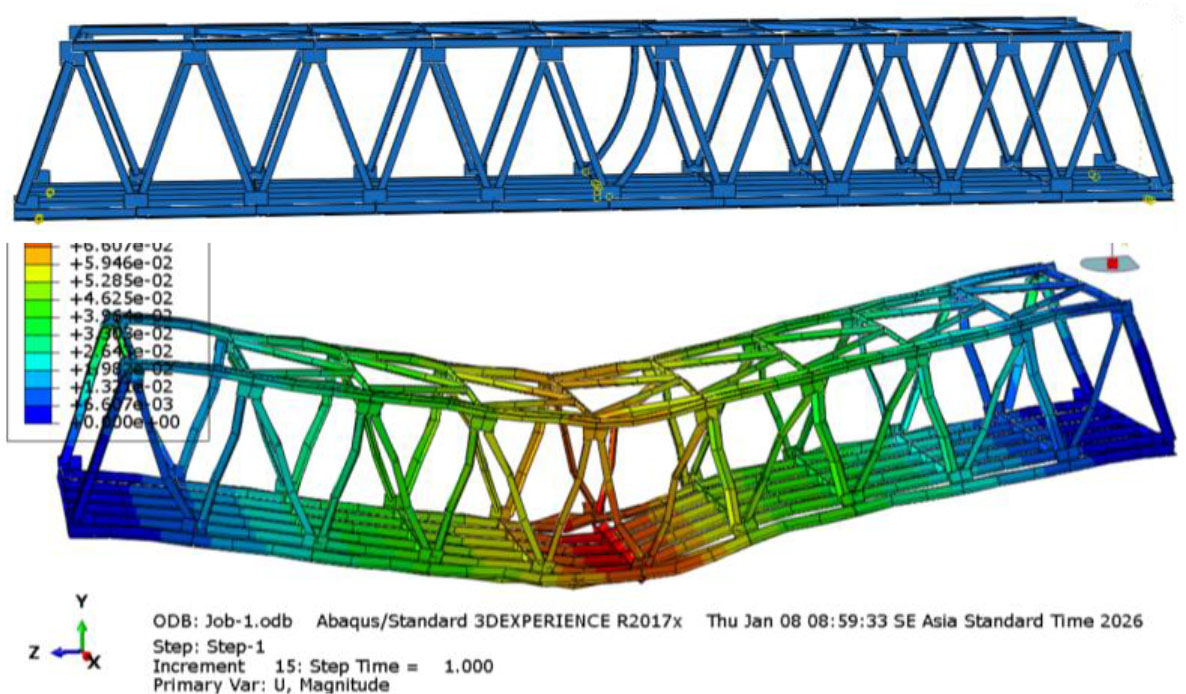
Figure 12:
Finite element model and modal displacement of the dmg-BC structure
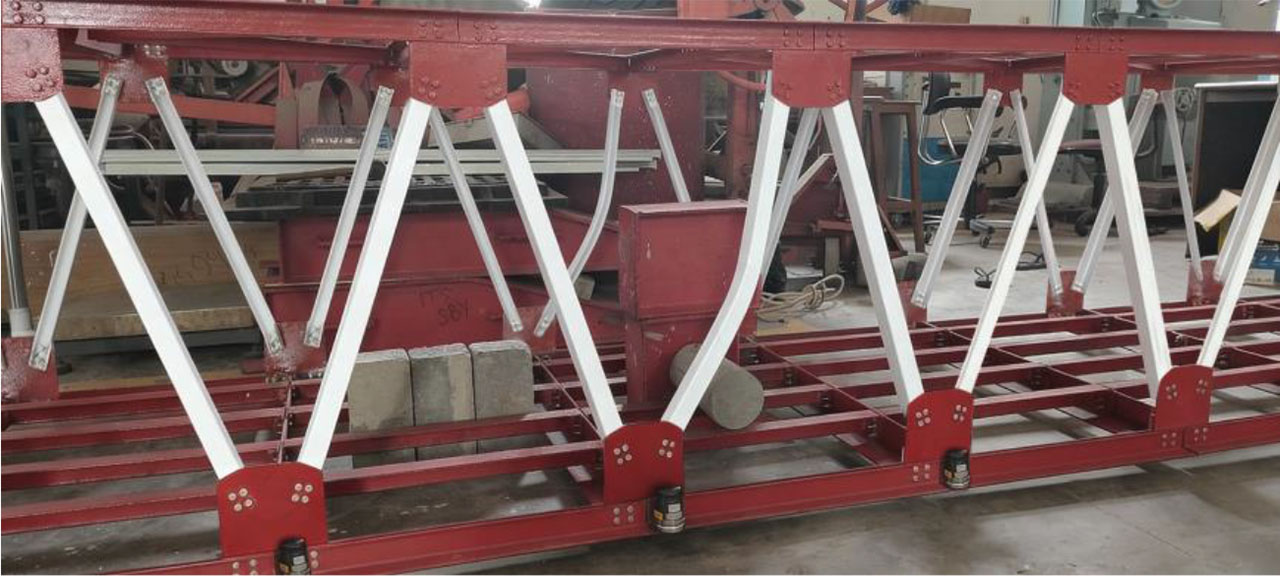
Figure 13:
Experimental simulation of mid-span diagonal member damage (Dmg-BC)
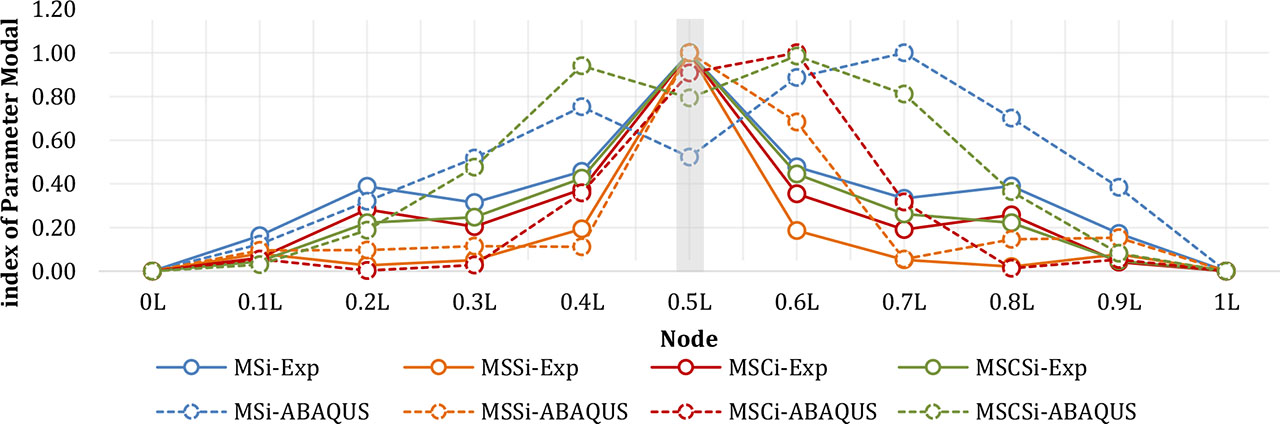
Figure 14:
Curvature index of each method on the DMG-BC model
Figure 14 illustrates the modal displacement of the Dmg-BC structure, which exhibits a buckling damage in the diagonal member at mid-span. The introduced damage location is highlighted in grey. The results in Figure 14 show that the mode shape slope (MSS) and mode shape curvature (MSC) damage indices, obtained from both numerical calculations and experimental mode shape measurements, successfully identify the damage location with good accuracy. Meanwhile, the mode shape (MS) and mode shape curvature square (MSCS) methods show a reduction in curvature at mid-span, indicating a possible discrepancy between the experimental data and the finite element analysis results. The displacement deviation between the experimental measurements and the finite element analysis results needs to be evaluated for accuracy using error metric methods.
Table 4:
Comparison of modal Damage Index Accuracy for Mid-Span Buckling Damage Model (Dmg-BC)
| Modal parameter | Squared displacement difference (unitless) | SSE | MSE | RMSE | ||||||||||
|---|---|---|---|---|---|---|---|---|---|---|---|---|---|---|
| 0.0L | 0.1L | 0.2L | 0.3L | 0.4L | 0.5L | 0.6L | 0.7L | 0.8L | 0.9L | 1.0L | ||||
| MSIi | 0.00 | 0.00 | 0.01 | 0.04 | 0.09 | 0.26 | 0.17 | 0.44 | 0.10 | 0.04 | 0.00 | 1.16 | 0.11 | 0.32 |
| MSSi | 0.00 | 0.00 | 0.00 | 0.01 | 0.01 | 0.00 | 0.25 | 0.00 | 0.02 | 0.01 | 0.00 | 0.29 | 0.03 | 0.16 |
| MSCi | 0.00 | 0.00 | 0.14 | 0.03 | 0.01 | 0.02 | 0.45 | 0.02 | 0.14 | 0.00 | 0.00 | 0.81 | 0.07 | 0.27 |
| MSCSi | 0.00 | 0.00 | 0.00 | 0.05 | 0.29 | 0.06 | 0.31 | 0.30 | 0.02 | 0.00 | 0.00 | 1.03 | 0.09 | 0.31 |
Table 4 illustrates the deviation between the responses of the intact and damaged structures. The mode shape slope index (MSSi) and mode shape curvature index (MSCi) methods exhibit low error values, as indicated by the error metrics obtained from the three evaluated methods. These results demonstrate that the mode shape slope (MSS) and mode shape curvature (MSC) approaches are highly accurate in identifying buckling damage in the mid-span diagonal member.
4.3. Dmg-EC Analysis
Figure 15 presents the specimen model with a damage scenario in which the diagonal member at mid-span is removed. This scenario aims to assess the capability of the modal-based method in accurately identifying the damage location. The modal displacements at each measurement point are recorded and adjusted to align with the corresponding points from the experimental measurements. The results of the finite element analysis are displayed in Figure 15.
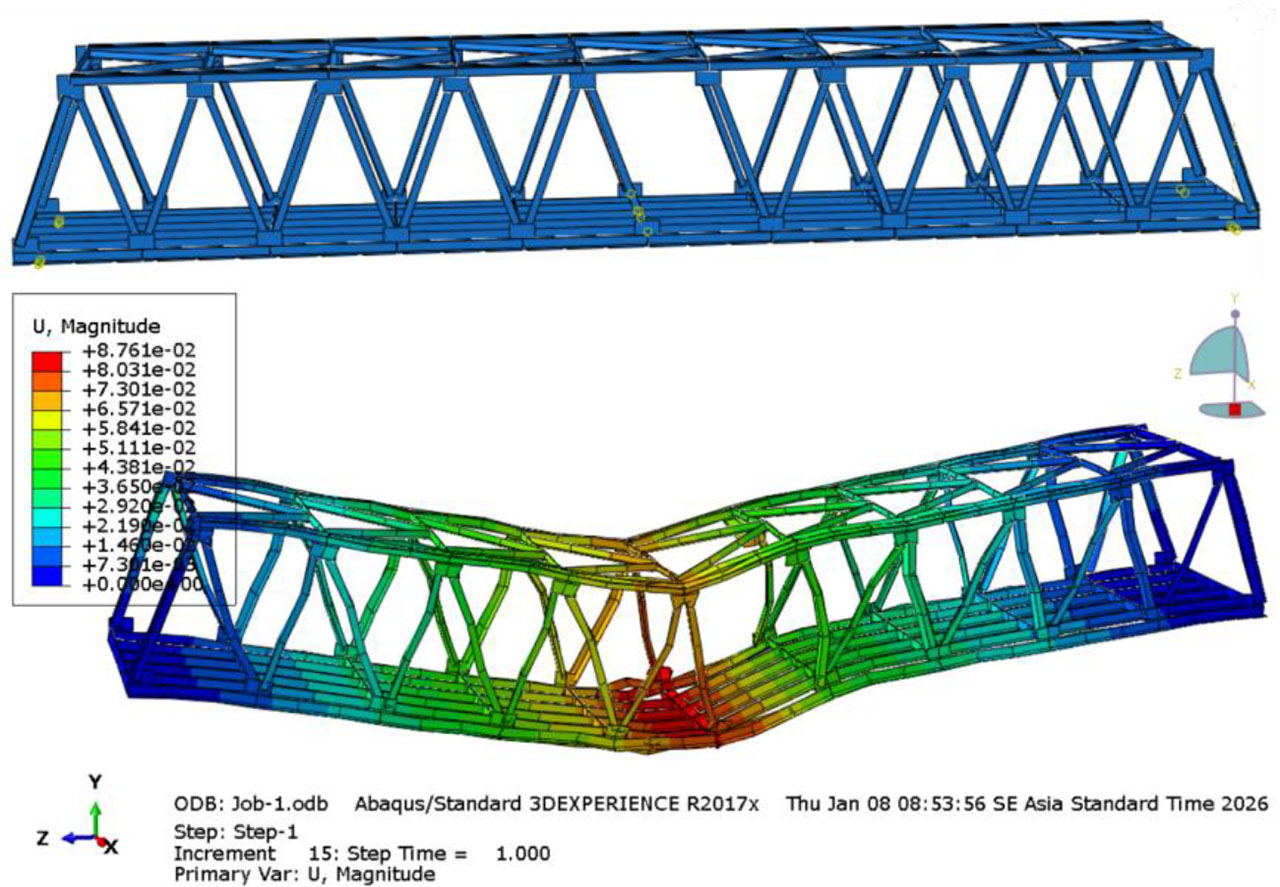
Figure 15:
Finite element model and modal displacement of the Dmg-EC structure
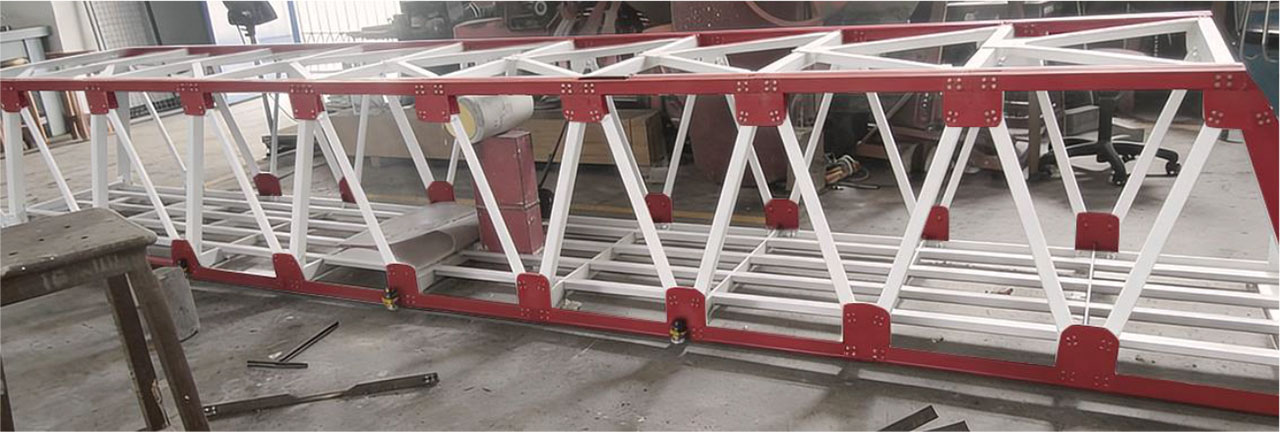
Figure 16:
Experimental simulation of mid-span diagonal member damage (Dmg-EC)
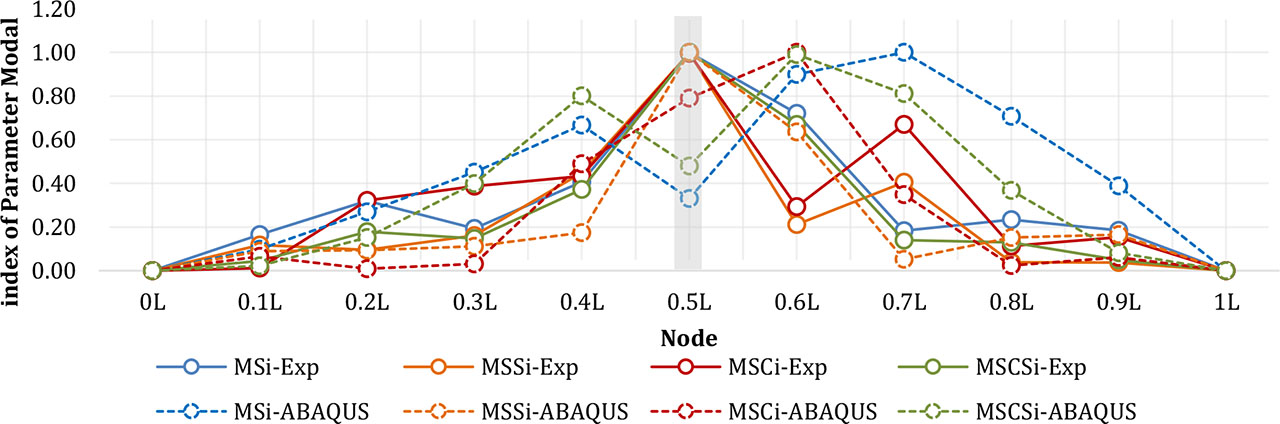
Figure 17:
Curvature index of each method on the DMG-EC model
The modal displacement of the Dmg-EC structure is presented in Figure 17, with the introduced damage location marked in grey. The results shown in Figure 20 indicate that neither the mode shape (MS) nor the mode shape slope (MSS) damage index, obtained from both numerical calculations and experimental mode shape measurements, can accurately detect the damage location. The mode shape curvature (MSC) and mode shape curvature square (MSCS) damage index methods successfully indicate the damage location according to the established scenario. From the curvature indices obtained using mode shape information calculated numerically, it is observed that the largest peak value appears at the damage location, indicating that the proposed damage index methods can effectively detect and locate the damage.
Table 5:
Comparison of modal damage index accuracy for mid-span diagonal member removal (Dmg-EC)
| Modal parameter | Squared displacement difference (unitless) | SSE | MSE | RMSE | ||||||||||
|---|---|---|---|---|---|---|---|---|---|---|---|---|---|---|
| 0.0L | 0.1L | 0.2L | 0.3L | 0.4L | 0.5L | 0.6L | 0.7L | 0.8L | 0.9L | 1.0L | ||||
| MSIi | 0.00 | 0.00 | 0.00 | 0.07 | 0.07 | 0.55 | 0.03 | 0.67 | 0.22 | 0.04 | 0.00 | 1.66 | 0.15 | 0.39 |
| MSSi | 0.00 | 0.00 | 0.00 | 0.00 | 0.08 | 0.00 | 0.18 | 0.14 | 0.01 | 0.02 | 0.00 | 0.43 | 0.04 | 0.20 |
| MSCi | 0.00 | 0.00 | 0.12 | 0.13 | 0.00 | 0.11 | 0.50 | 0.15 | 0.03 | 0.01 | 0.00 | 1.06 | 0.10 | 0.31 |
| MSCSi | 0.00 | 0.00 | 0.00 | 0.00 | 0.18 | 0.39 | 0.11 | 0.45 | 0.06 | 0.00 | 0.00 | 1.25 | 0.11 | 0.34 |
Table 3 confirms the effectiveness of the modal-based approach in detecting the removal damage of the mid-span diagonal member. Based on the error metric values, the mode shape slope (MSS) and mode shape curvature (MSC) methods show lower error values, indicating that these methods provide high accuracy compared to the experimental results. This finding is consistent with the previous case, which demonstrated that the mode shape slope (MSS) and mode shape curvature (MSC) methods are reliable in identifying damage locations in mid-span members of steel truss bridges. However, further evaluation of all four methods is required to verify their performance in detecting damage in elements located at one-fifth of the span.
4.4. Dmg-CE Analysis
Figure 18 shows the structural modelling and finite element analysis results with a cut section located at 1/5 of the span. The modal displacement at each measurement point was observed, and the measured displacement values were adjusted to match the measurement points used in the experimental test. Meanwhile, Figure 19 presents the experimental testing of the Dmg-CE model.
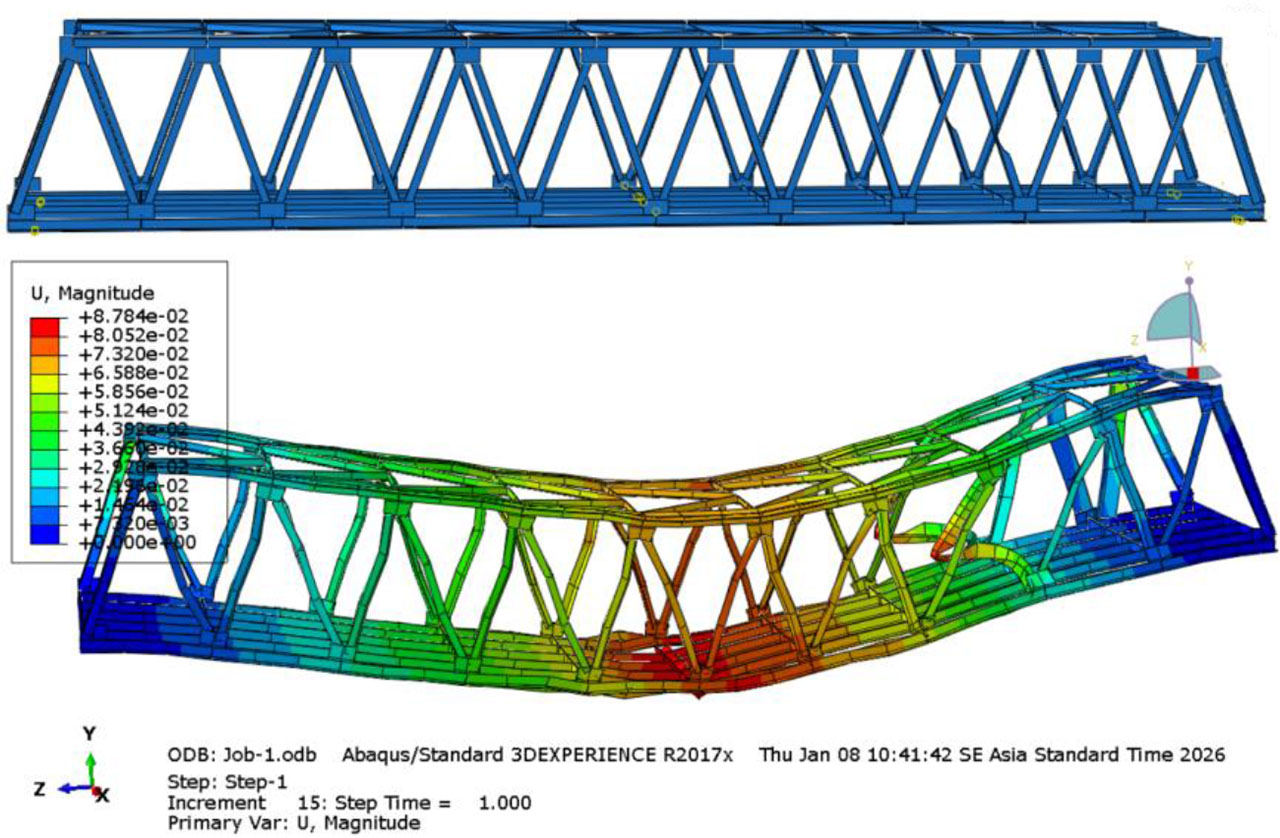
Figure 18:
Finite element model and modal displacement of the Dmg-CE structure
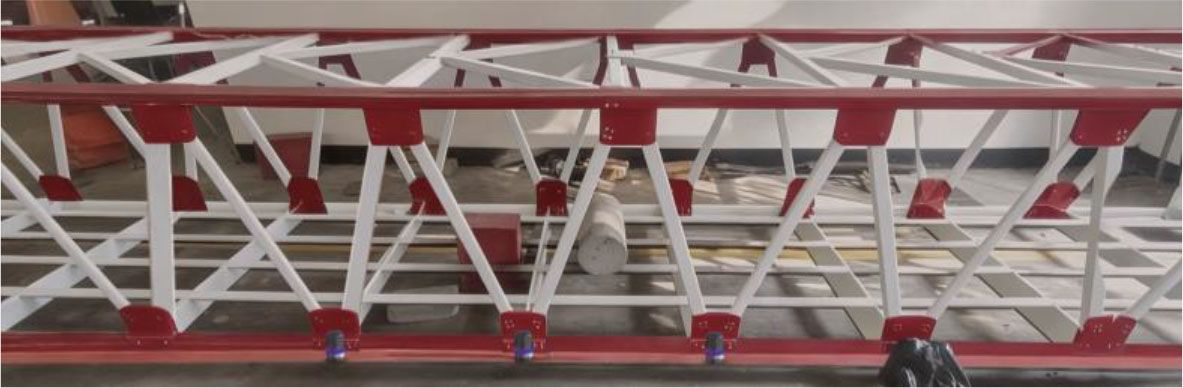
Figure 19:
Experimental simulation of diagonal member damage at 1/5 of the span (Dmg-CE)
Figure 20 shows the modal displacement of the Dmg-CE structure, with the introduced damage location marked in grey. The results presented in Figure 20 indicate that the mode shape slope (MSS) and mode shape curvature (MSC) damage indices can effectively detect the damage location at 1/5 of the span (Node 0.8). Based on the curvature index obtained from the mode shape information calculated numerically, the highest peak value appears at the damage location in both the experimental and numerical results. The mode shape slope (MSS) and mode shape curvature (MSC) approaches demonstrate that the proposed damage index method can effectively detect and identify the damage location. To evaluate the accuracy level of the four methods used in the damage location detection analysis, error metric calculations were performed.
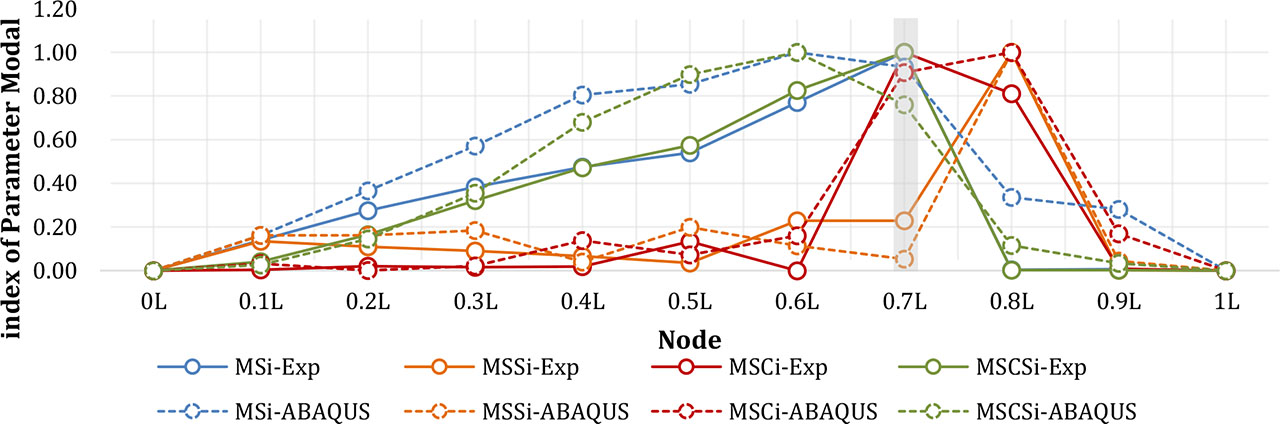
Figure 20:
Curvature index of each method on the DMG-CE model
Table 6:
Accuracy comparison of modal damage indices for 1/5-span diagonal cutting damage (Dmg-CE)
| Modal parameter | Squared displacement difference (unitless) | SSE | MSE | RMSE | ||||||||||
|---|---|---|---|---|---|---|---|---|---|---|---|---|---|---|
| 0.0L | 0.1L | 0.2L | 0.3L | 0.4L | 0.5L | 0.6L | 0.7L | 0.8L | 0.9L | 1.0L | ||||
| MSIi | 0.00 | 0.00 | 0.01 | 0.03 | 0.11 | 0.10 | 0.05 | 0.01 | 0.11 | 0.07 | 0.00 | 0.50 | 0.05 | 0.21 |
| MSSi | 0.00 | 0.00 | 0.00 | 0.01 | 0.00 | 0.05 | 0.01 | 0.03 | 0.00 | 0.00 | 0.00 | 0.11 | 0.01 | 0.10 |
| MSCi | 0.00 | 0.00 | 0.00 | 0.00 | 0.02 | 0.00 | 0.03 | 0.02 | 0.04 | 0.03 | 0.00 | 0.13 | 0.01 | 0.11 |
| MSCSi | 0.00 | 0.00 | 0.00 | 0.00 | 0.04 | 0.11 | 0.03 | 0.07 | 0.01 | 0.00 | 0.00 | 0.27 | 0.02 | 0.16 |
Table 6 verifies the capability of the mode shape slope (MSS) and mode shape curvature (MSC) methods in identifying the cut section located at one-fifth of the span. The error metric results indicate that all four methods produce low error values, demonstrating a high level of accuracy compared to the experimental results. These findings further confirm that the mode shape slope (MSS) and mode shape curvature (MSC) methods are reliable in detecting damage locations at the one-fifth span, consistent with the modal displacement analysis, which also shows that both methods perform well in identifying damage in this region. However, the mode shape (MS) and mode shape curvature square (MSCS) methods are found to be less reliable in detecting the damage location in this case.
4.5. Dmg-BE Analysis
Figure 21 shows the structural modelling and finite element analysis results with buckling damage on the diagonal member located at 1/5 of the span. The modal displacement at each measurement point was observed, and the measured displacement values were adjusted to match the measurement points used in the experimental test. Figure 22 presents the experimental testing of the Dmg-BE model.
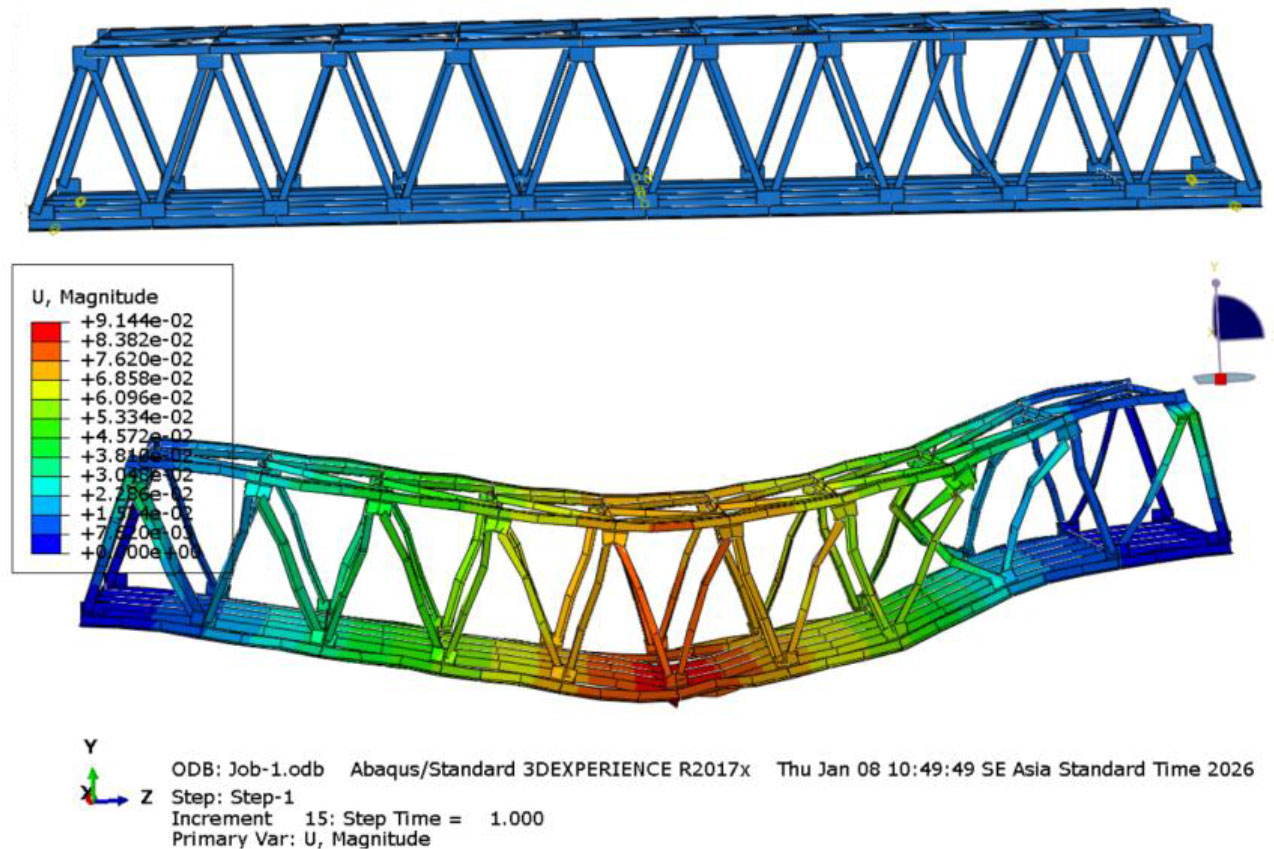
Figure 21:
Finite element model and modal displacement of the dmg-BE structure
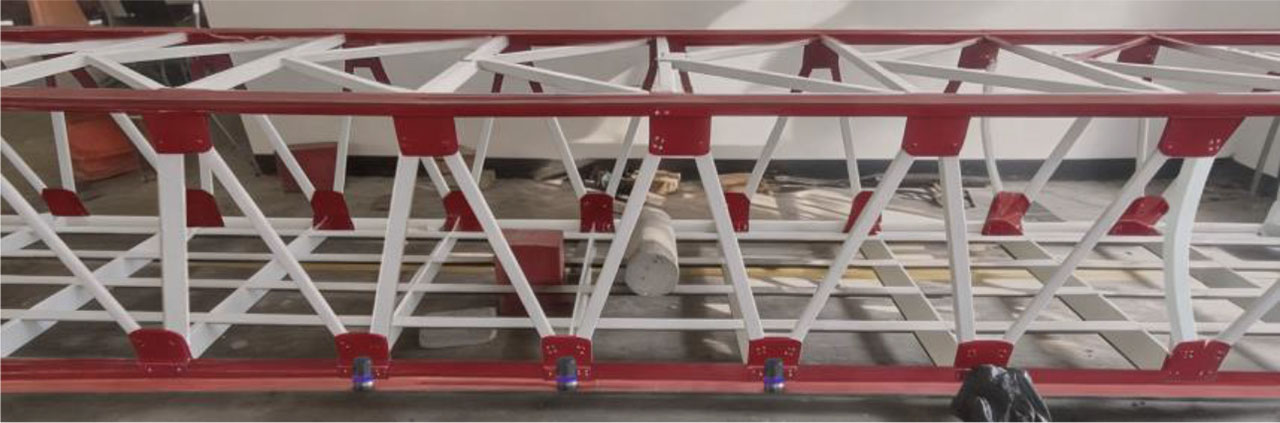
Figure 22:
Experimental simulation of diagonal member damage at 1/5 of the span (Dmg-BE)
Figure 23 illustrates the modal displacement distribution of the structure with buckling damage occurring in the diagonal member located at 1/5 of the span, where the introduced damage area is highlighted in grey. The results presented in Figure 23 demonstrate that the mode shape slope (MSS) and mode shape curvature (MSC) damage indices effectively identify the damage location at one-fifth of the span (Node 0.8). Based on the curvature index derived from the numerically calculated mode shape, the highest peak value appears precisely at the damage location in both the experimental and numerical results. These findings indicate that the mode shape slope (MSS) and mode shape curvature (MSC) methods provide high accuracy and efficiency in detecting and identifying structural damage. To further evaluate the accuracy of all four modal-based damage detection methods, error metric analyses were performed.
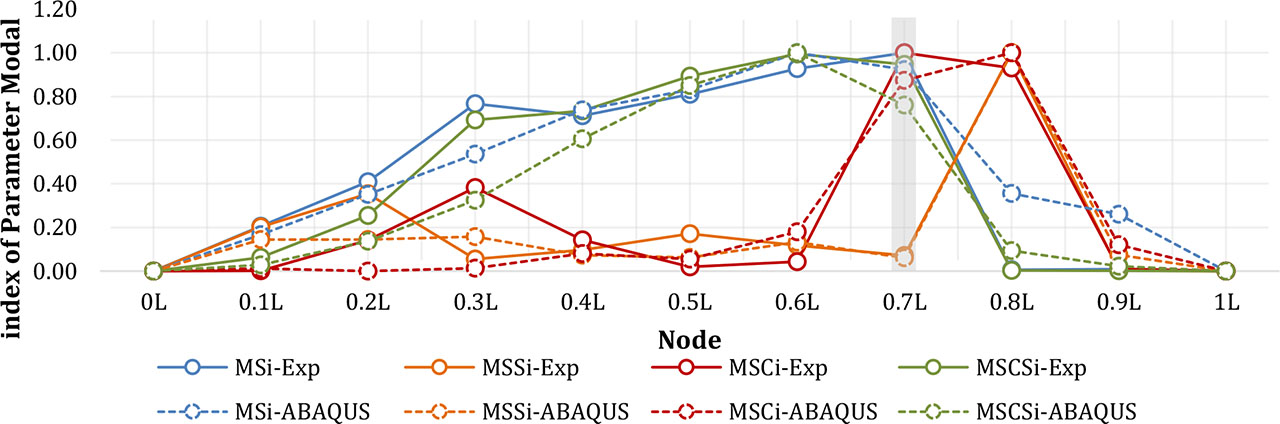
Figure 23:
Curvature index of each method on the DMG-BE model
Table 7:
Accuracy comparison of modal damage indices for 1/5-span diagonal buckling damage (Dmg-BE)
| Modal parameter | Squared displacement difference (unitless) | SSE | MSE | RMSE | ||||||||||
|---|---|---|---|---|---|---|---|---|---|---|---|---|---|---|
| 0.0L | 0.1L | 0.2L | 0.3L | 0.4L | 0.5L | 0.6L | 0.7L | 0.8L | 0.9L | 1.0L | ||||
| MSIi | 0.00 | 0.00 | 0.01 | 0.06 | 0.00 | 0.00 | 0.01 | 0.01 | 0.12 | 0.06 | 0.00 | 0.27 | 0.02 | 0.16 |
| MSSi | 0.00 | 0.01 | 0.05 | 0.01 | 0.00 | 0.01 | 0.00 | 0.00 | 0.00 | 0.01 | 0.00 | 0.08 | 0.01 | 0.09 |
| MSCi | 0.00 | 0.00 | 0.02 | 0.14 | 0.00 | 0.00 | 0.02 | 0.02 | 0.00 | 0.01 | 0.00 | 0.21 | 0.02 | 0.14 |
| MSCSi | 0.00 | 0.00 | 0.02 | 0.14 | 0.02 | 0.00 | 0.00 | 0.04 | 0.01 | 0.00 | 0.00 | 0.23 | 0.02 | 0.14 |
Table 7 shows that the mode shape slope (MSS) and mode shape curvature (MSC) methods demonstrate excellent capability in identifying buckling damage on the diagonal member located at 1/5 of the span. Based on the error metric results, all four methods produce relatively small error values, indicating a high level of accuracy in detecting the damage location. These findings also reinforce the consistency between the numerical analysis and experimental data, showing that the mode shape slope (MSS) and mode shape curvature (MSC) methods are reliable in detecting buckling damage on the diagonal member at 1/5 of the span, whereas the mode shape (MS) and mode shape curvature square (MSCS) methods are less effective in accurately identifying the damage location. This confirms the reliability of the mode shape slope (MSS) and mode shape curvature (MSC) methods in identifying buckling damage in the structure.
4.6. Dmg-EE Analysis
Figure 24 presents the structural modelling and finite element analysis results with the removal of the diagonal member located at 1/5 of the span. The modal displacement at each measurement point was observed, and the displacement values obtained from the analysis were adjusted to match the measurement points used in the experimental test. Meanwhile, Figure 25 shows the experimental testing of the Dmg-EE model.
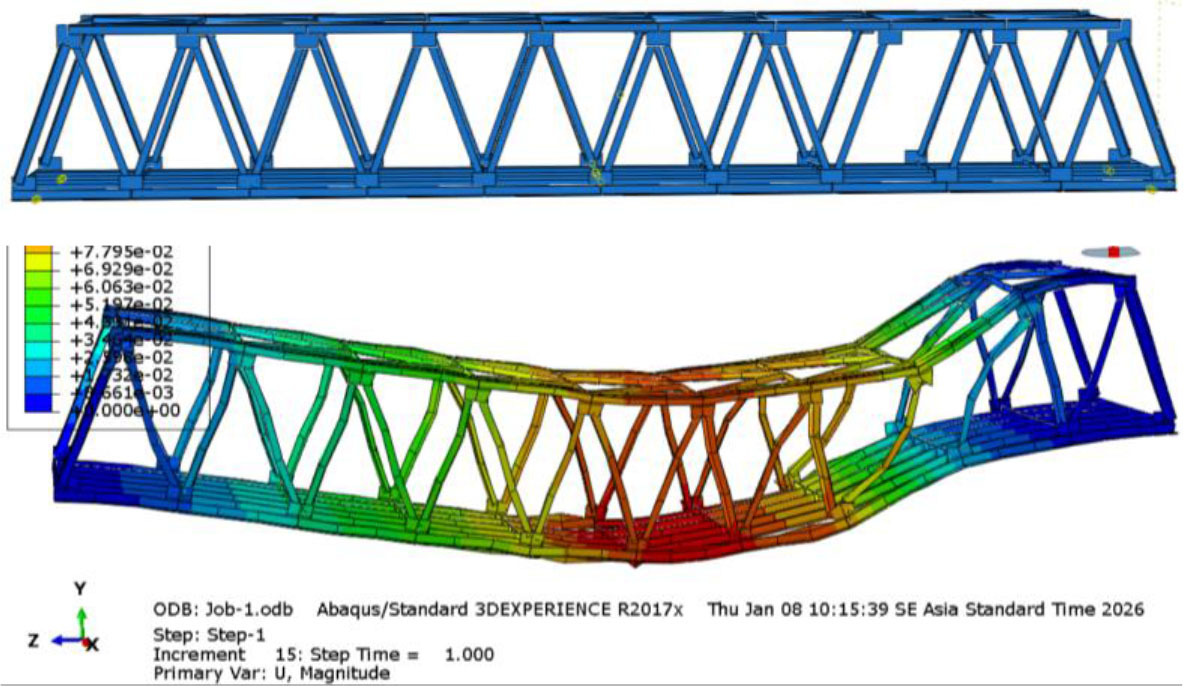
Figure 24:
Finite element model and modal displacement of the dmg-EE structure
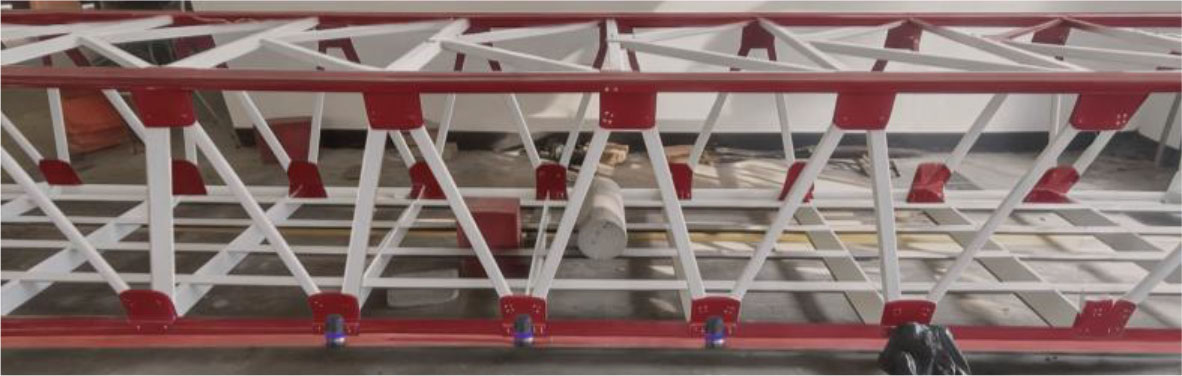
Figure 25:
Experimental simulation of diagonal member damage at 1/5 of the span (Dmg-EE)
Figure 26 shows the modal displacement distribution of the structure with damage caused by the removal of the diagonal member located at one-fifth of the span, where the introduced damage area is highlighted in grey. The results presented in Figure 27 indicate that the mode shape slope (MSS) and mode shape curvature (MSC) damage indices effectively identify the damage location at one-fifth of the span (Node 0.8). Based on the curvature index obtained from the numerically calculated mode shape, the highest peak value appears precisely at the damage location in both the experimental and numerical results. These findings confirm that the mode shape slope (MSS) and mode shape curvature (MSC) methods provide high accuracy and efficiency in detecting and identifying structural damage. Furthermore, to evaluate the accuracy level of all four modal-based damage detection methods, an error metric analysis was conducted.
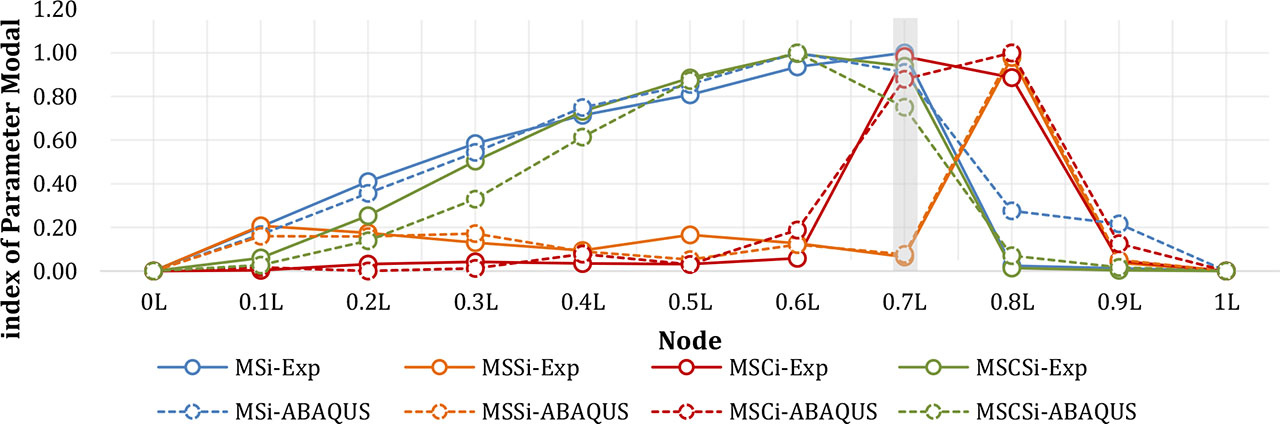
Figure 26:
Curvature index of each method on the DMG-EC model
Table 8:
Accuracy comparison of modal damage indices for 1/5-span diagonal member removal damage (Dmg-EE)
| Modal parameter | Squared displacement difference (unitless) | SSE | MSE | RMSE | ||||||||||
|---|---|---|---|---|---|---|---|---|---|---|---|---|---|---|
| 0.0L | 0.1L | 0.2L | 0.3L | 0.4L | 0.5L | 0.6L | 0.7L | 0.8L | 0.9L | 1.0L | ||||
| MSIi | 0.00 | 0.00 | 0.00 | 0.00 | 0.00 | 0.00 | 0.00 | 0.01 | 0.06 | 0.04 | 0.00 | 0.13 | 0.01 | 0.11 |
| MSSi | 0.00 | 0.00 | 0.00 | 0.00 | 0.00 | 0.01 | 0.00 | 0.00 | 0.00 | 0.00 | 0.00 | 0.02 | 0.00 | 0.04 |
| MSCi | 0.00 | 0.00 | 0.00 | 0.00 | 0.00 | 0.00 | 0.02 | 0.02 | 0.01 | 0.01 | 0.00 | 0.06 | 0.01 | 0.08 |
| MSCSi | 0.00 | 0.00 | 0.01 | 0.03 | 0.02 | 0.00 | 0.00 | 0.04 | 0.00 | 0.00 | 0.00 | 0.11 | 0.01 | 0.10 |
Table 8 confirms the effectiveness of the modal-based approach in detecting damage caused by the removal of the diagonal member located at one-fifth of the span. Based on the obtained error metric values, all four methods (MS, MSS, MSC, and MSCS) show low error values, indicating that these methods have a high level of accuracy compared to the experimental results. However, the mode shape slope (MSS) and mode shape curvature (MSC) methods, as demonstrated in the modal displacement analysis, show greater reliability in identifying the damage location of the diagonal member at one-fifth of the span of the steel truss bridge. From these results, it can be concluded that the mode shape slope (MSS) and mode shape curvature (MSC) methods are sufficiently reliable in detecting damage locations at one-fifth of the span.
5. Conclusion
This study focuses on identifying damage locations in diagonal members caused by cutting, buckling, and member removal, with the objective of evaluating the effectiveness of four modal-based methods under extreme damage conditions. The adopted modal-based approaches include the Mode Shape (MS), Mode Shape Slope (MSS), Mode Shape Curvature (MSC), and Mode Shape Curvature Square (MSCS) methods. These methods were applied to validate the damage locations identified in experimental tests through mode shape curvature analysis, in order to determine the most reliable approach for structural damage identification.
The results obtained from both experimental testing and finite element analysis (FEA) demonstrate that the mode shape slope (MSS) and mode shape curvature (MSC) methods exhibit a high degree of reliability in identifying damage locations. The effectiveness and consistency of these two methods were verified through validation on two symmetrical diagonal members that experienced cutting and buckling damage at two different locations, namely at mid-span and at one-fifth of the span. Furthermore, the error metric analysis derived from numerical simulations – used to assess the accuracy between the FEA and experimental results – shows that the mode shape slope (MSS) and mode shape curvature (MSC) methods consistently yield the lowest error values across all cases, for both mid-span and one-fifth span damage scenarios.
In addition, the results indicate that the mode shape slope (MSS) and mode shape curvature (MSC) methods produce more distinct and pronounced curvature peaks at the damage locations compared to the mode shape (MS) and mode shape curvature square (MSCS) methods. This behaviour can be attributed to the fact that curvature-based methods, particularly those involving second-order spatial derivatives of mode shapes, are more sensitive to local stiffness degradation, whereas modal displacement primarily reflects the global structural behaviour. Consequently, even minor damage can lead to a significant increase in curvature values, making damage locations easier to detect with higher accuracy. Therefore, the MSS and MSC methods can be regarded as reliable and effective tools for structural damage identification, as they are more sensitive to small-scale damage and clearly capture curvature changes caused by local stiffness loss at monitoring points.
Acknowledgements
This research was supported by the Center for Higher Education Financing and Assessment (PPAPT) and the Education Fund Management Institution (LPDP) of the Indonesian Government.
Notes
[1] Contributed by Author Contributions
D.K.F., H.K., and A.B.H. conceptualized the study, developed the research methodology, implemented the software, and conducted FEM validation. D.I. carried out the analysis, validation process, and prepared the original draft. B.S. collected data and contributed to review and editing. All authors critically reviewed and approved the final version of the manuscript and agreed to be accountable for all aspects of the work.