

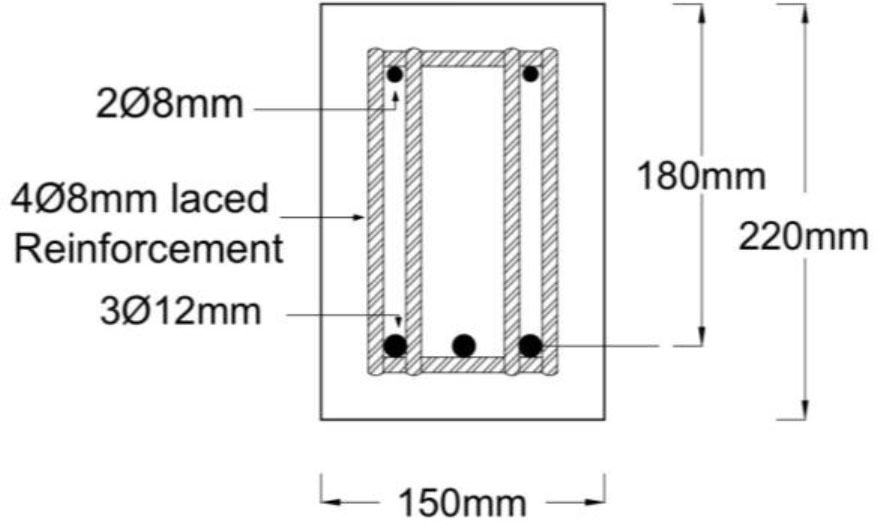
Figure 1:
Cross section of beams

Figure 2:
Solid beam
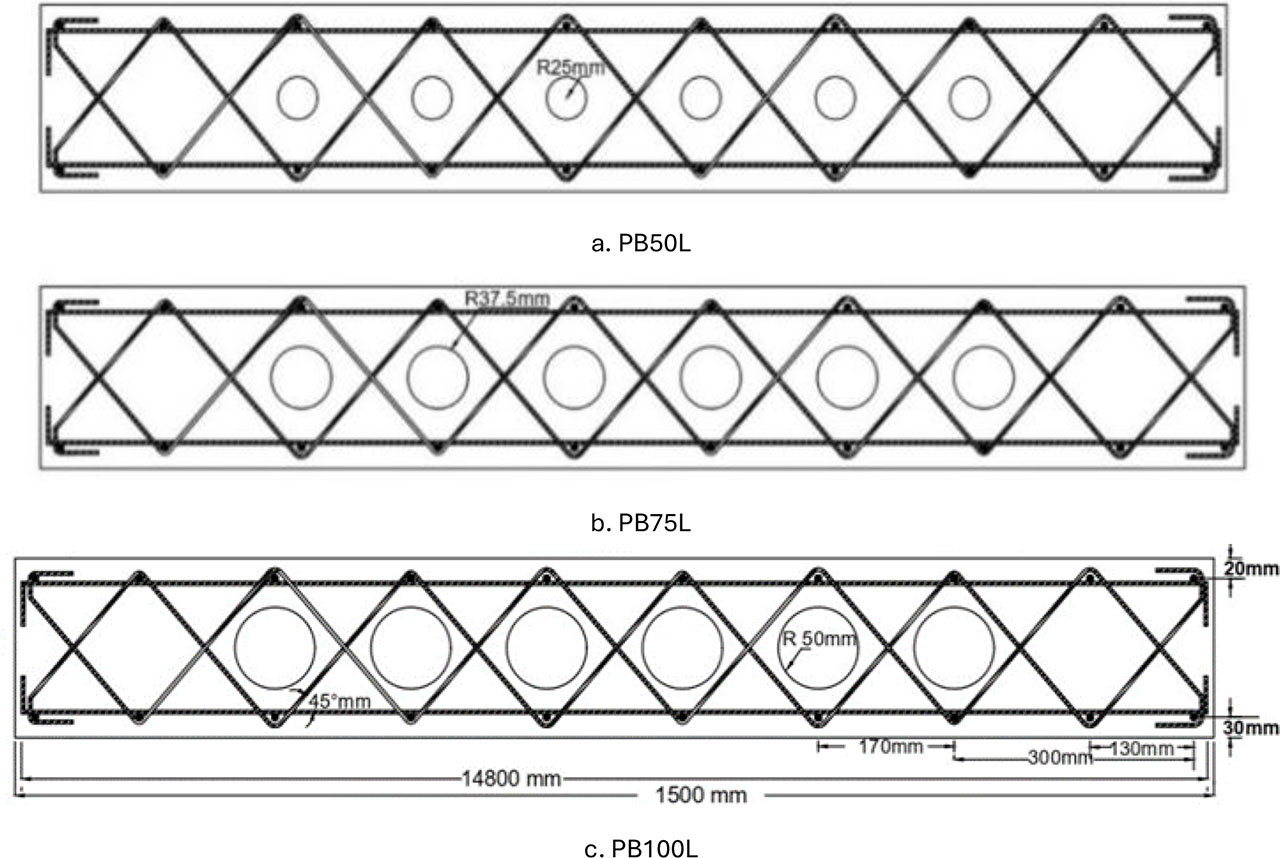
Figure 3:
Perforated beams (a, b, c)
Table 1:
Configuration of tested specimens
| Tested beams | Weight of concrete [kg] | Void ratio [%] | Details of beams | |
|---|---|---|---|---|
| SBL | 124 | 0.0 | Solid beam | Control beam |
| PB50L | 119.4 | 3.6 | Beam has six voids 50mm diameter enhanced by laced rebars with 45° inclination angles. | Studying the effect of voids sizes on the structural behaviour of beams reinforced by laced bars |
| PB75L | 113.8 | 8 | Beam has six voids 75mm diameter enhanced by laced rebars with 45° inclination angles. | |
| PB100L | 106 | 14.2 | Beam has six voids 100mm diameter enhanced by laced rebars with 45° inclination angles. | |
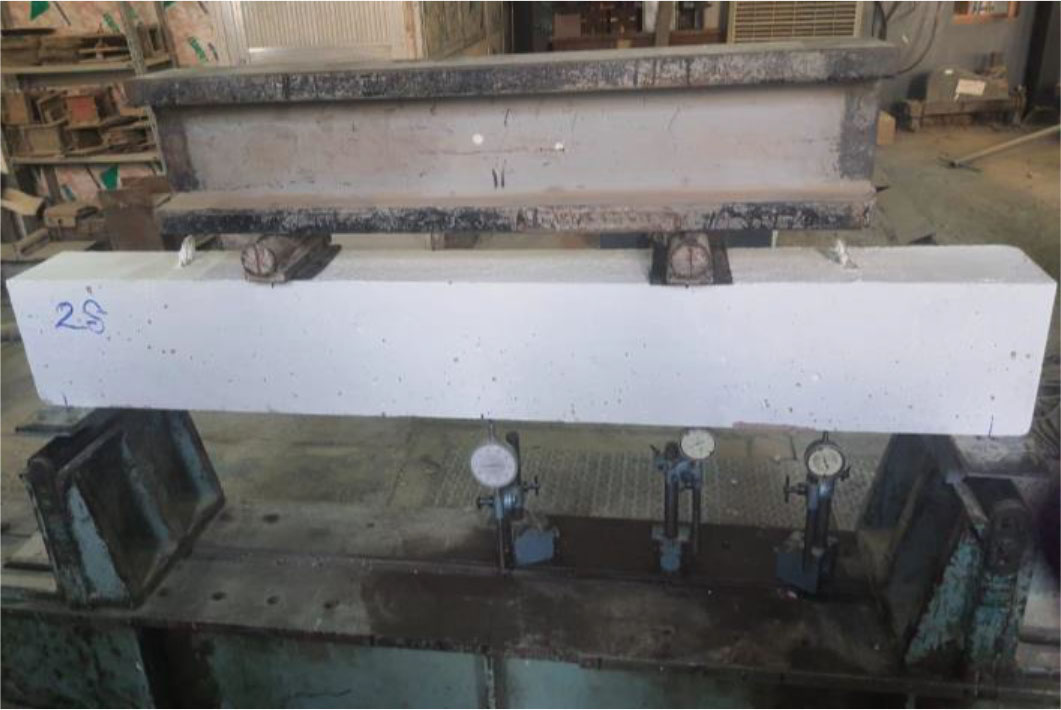
Figure 4:
Test setup
Table 2:
The mechanical properties of tested specimen
| Tested beams | fc' [MPa] | fr [MPa] | ft [MPa] | E [GPa] |
|---|---|---|---|---|
| SBL | 27.3 | 3.2 | 2.9 | 20.8 |
| PB50L | 29.2 | 3.5 | 3 | 22.8 |
| PB75L | 28 | 2.8 | 3.2 | 21.3 |
| PB100L | 30.5 | 3.1 | 2.7 | 19.6 |
Table 4:
Experimental results and details of specimen
| Tested beams* | Failure mode | Py (yield load) [kN] | Ultimate load [kN] | Deflection [mm] |
|---|---|---|---|---|
| SBL | Flexural | 150 | 200 | 5.14 |
| PB50L | Flexural | 135 | 201 | 5.33 |
| PB75L | Flexural | 120 | 196 | 4.4 |
| PB100L | Flexural + shear | 80 | 140 | Not applicable |
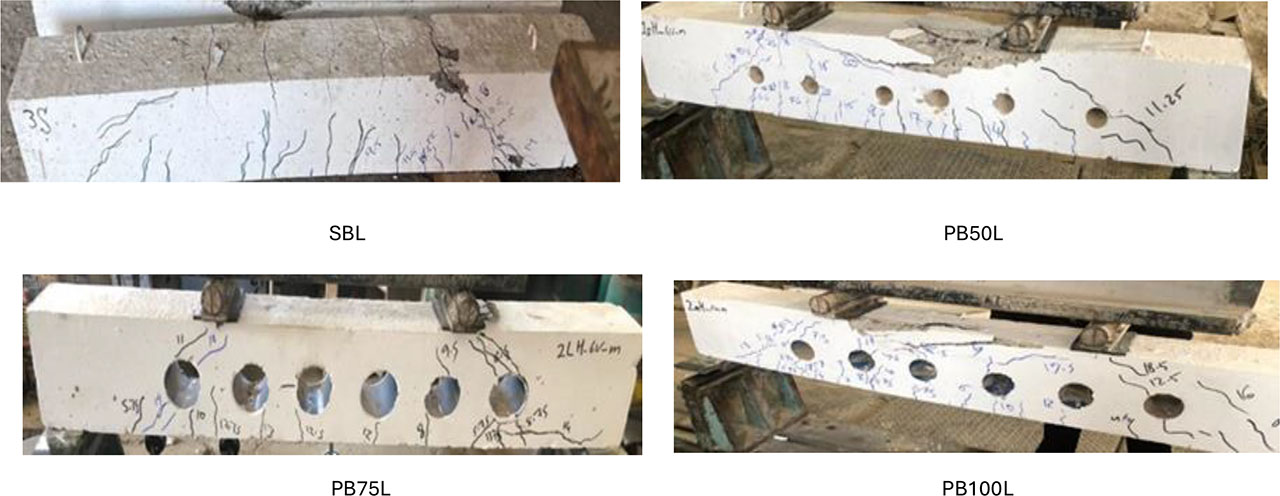
Figure 5:
Experimental crack patterns in beams at failure
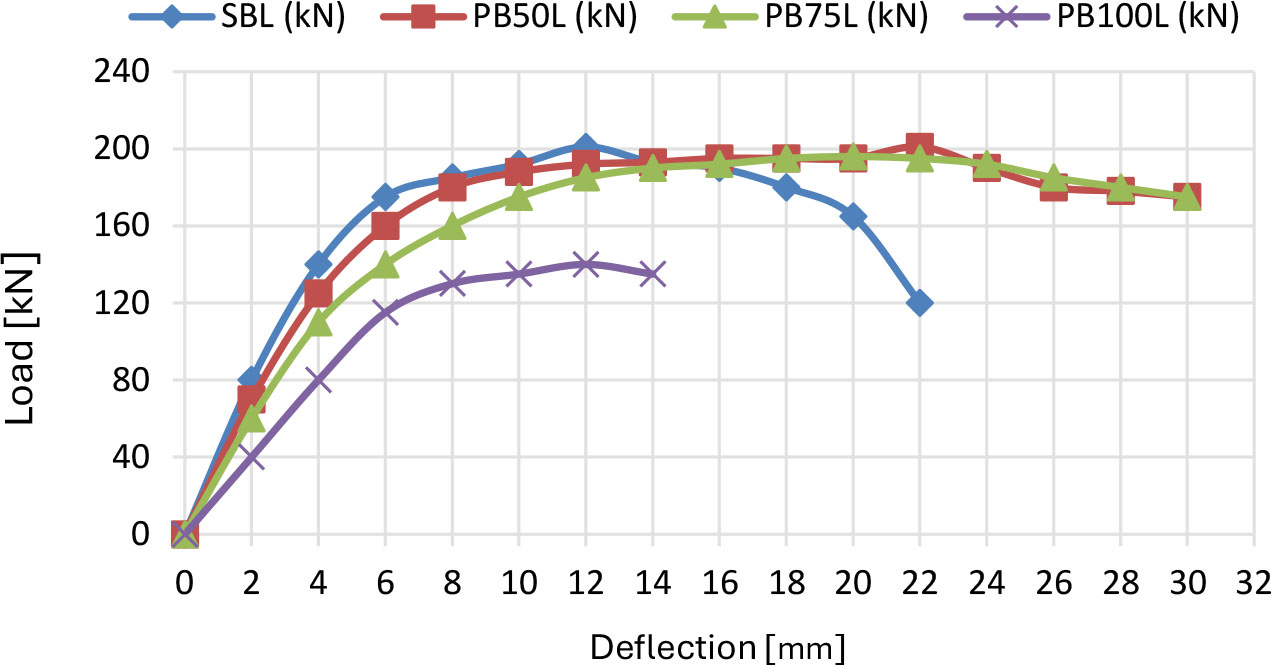
Figure 6:
Load deflection curves for all tested beams
Table 5:
Developed ductility versus ultimate capacity
| Tested beams | Concrete loses | Ultimate capacity gain | Ductility gain |
|---|---|---|---|
| SBL | - | - | - |
| PB50L | 3.7 % | 1 % | 3 % |
| PB75L | 8 % | −2 % | −14.4 % |
| PB100L | 14.2 % | −30 % | Not applicable |
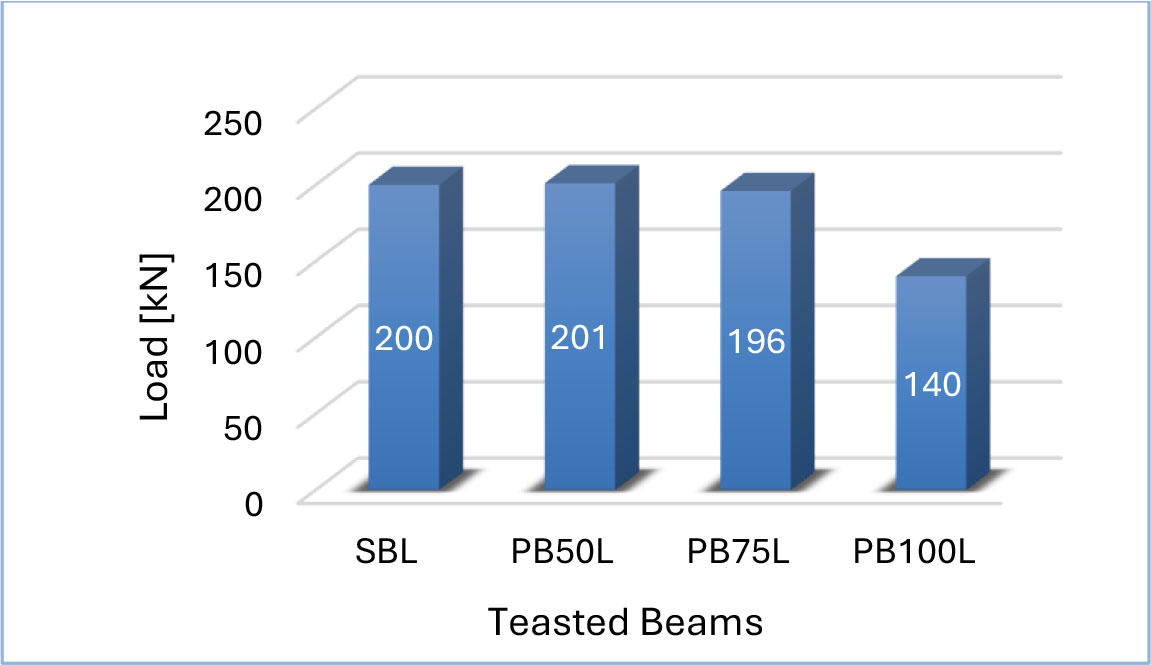
Figure 7:
Ultimate loads of all beams