

1. Introduction
Brace frames are structural systems designed to reduce the lateral deflection of steel structures, making them a common choice for resisting the forces of an earthquake. The brace frames enhance the stiffness of a building, enabling it withstand lateral loads like those from wind or seismic activity. While they are designed to perform well under normal conditions, brace frames are expected to undergo inelastic deformation (permanent deformation) when subjected to severe seismic actions (Malley & Popov, 1983; Kasai & Popov, 1986; Yiğitsoy, 2010; Sabouri-Ghomi & Payandehjoo, 2017; Salmasi & Sheidaii, 2017; Mirjalali, Ghasemi, & Labbafzadeh, 2019; Prinz, 2010). This controlled yielding is a primary part of their design, permitting them to absorb and dissipate energy from an earthquake, which prevents an abrupt collapse. The braces can be configured in various ways within a building's design to optimize their effectiveness.
There are two types of brace frames, which are concentrically brace frames (CBFs) and eccentrically brace frames (EBFs). The prime difference in the bracing members connect to the beams and columns.
Researches on concentrically brace frames (CBFs) have focused on improving their performance, specifically in high-seismicity regions (Banihashemi, Mirzagoltabar, & Tavakoli, 2015; Mahmoudi, Shirpour, & Zarezadeh, 2019; Yang, Sheikh, & Tobber, 2019; Zeng, Zhang, & Ding, 2019; Tajmir Riahi, Zeynalian, Rabiei, & Ferdosi, 2020; Hammad & Moustafa, 2021). The main deficiency with conventional CBFs is their behavior under cyclic loading, such as during an earthquake. While the brace in tension is yields and dissipates energy, the brace in compression is susceptible to buckling, this can cause to a fast loss of strength and stiffness (Astaneh-Asl, Topkaya, & Kazemzadeh Azad, 2017; Tamboli, n.d.; Issa, Stephen, & Mwafy, 2024; Al-Safi, Alameri, Ezzedine, & Alwalidi, 2022; Souri & Mofid, 2023; Gottem et al., 2023; Sugihardjo, Habieb, & Karuniawan, 2022).
The concept of eccentrically brace frames and the research into their seismic performance is documented in academic literature and design codes. Much of the foundational research on the EBFs was conducted at the University of California, Berkeley, in the late 1970s and 1980s (Roeder & Popov, 1978). The principles established by this early research were later incorporated into seismic design codes around the world, e.g., AISC 341-22 (American Institute for Steel Construction, 2022), Eurocode 8 (European Committee for Standardization, 2004), CSA S16-94 (Canadian Standards Association, 1994).
EBFs successfully combine the high level of ductility of moment resisting frames (MRFs) and the high level of stiffness of CBFs by inserting eccentricity between a frames braces and columns (Canadian Standards Association, 1994). The braces of the EBFs supply the elastic stiffness of the frames and the eccentricity of the braces forms a link that provides the ductility, consequently, energy dissipation capacity of the MRFs, where all other elements of the EBFs, including the beams, columns, and braces outside the link, are designed to remain elastic.
The link's behavior of the EBFs is highly impacted by its length, consequently effects on the type of hinges and the type of mechanism. Links are typically classified into two main types based on their length relative to their depth (American Institute for Steel Construction, 2022): short links: these links are designed to yield essentially in shear, and long links: these are designed to yield essentially in flexure (bending).
The fragility curves are a lognormal functions used to seismic risk assessment, they are probabilistic curves that show the likelihood of a structure experiencing a certain level of damage (or “damage state”) at a given intensity of earthquake (Popov & Engelhardt, 1988; Federal Emergency Management Agency, 2003).
By using fragility curves, engineers can make informed decisions about structural design and risk management of different bracing systems by comparing the fragility curves of their to determine which one is less vulnerable to a specific hazard. (Kianmehr, 2021) has evaluated how different types of bracing systems influence the seismic performance and collapse probability of steel structures during a maximum reliable earthquake, fragility curves show the probability of a structure reaching or exceeding a certain damage state (like complete damage) for a given earthquake intensity.
According to earlier versions of the Iraqi Seismic Code, Baghdad was placed in seismic zone II. Modern seismic codes as the ISC 2017 (C.O.S.Q.C., 2017) is used spectral response acceleration parameters (S1 and Ss) for seismic design instead of a zone number.
The purpose of this study is to assess the seismic vulnerability for two systems, eccentrically inverted V-brace frames (EBFs) and concentrically inverted V-brace frames (CBFs) in Iraq -Baghdad were designed according to codes (American Institute for Steel Construction, 2022; American Society of Civil Engineers, 2022; C.O.S.Q.C., 2017). This study is the first to develop fragility curves for CBF and EBF models designed per (American Institute for Steel Construction, 2022) under Iraqi seismic conditions. The fragility curves developed based on nonlinear static (pushover) analysis (NSP) in order to estimate seismic damage probability in terms of spectrum displacements. By comparing the seismic response of concentric vs. eccentric bracing systems, the results of story drift, formed plastic hinges, and fragility curves shows the eccentric system is more ductile and has a lower probability of extensive damage or collapse.
2. Description of the Studied Buildings
2.1. Design the Steel Building
The theoretical steel buildings with elven and eight stories above ground level, structured with eccentrically inverted V-brace frames (EBFs) and concentrically inverted V-brace frames (CBFs) with different storey as shown in Figure 1 are studied. The investigated frames in this study were designed according to (American Institute for Steel Construction, 2022; American Society of Civil Engineers, 2022; C.O.S.Q.C., 2017). The models assumed as office buildings existed in Baghdad, which consists of soft soils.
The buildings have the same plan layout storey as shown in Figure 2. The height of stories 3.0 m. The structures has four bays in the X direction and three bays in the Y direction with bay width is 7.0 m, considering eccentrically brace frames (EBFs) with shear link length equal to 1000 mm. The slabs are made of reinforced concrete (thickness slab equal to 150 mm) with fc = 25 MPa and are supported by secondary beams IPE200. The yield strength of the steel, fy = 414 MPa. The beam‐ column, beam‐brace and brace‐column connections are rigid according to (American Institute for Steel Construction, 2022). The design live loads for roof and floor are 1.0 kN/m2 and 2.4 kN/m2, respectively. The dead load from structural and non-structural elements, the gravitational load includes 25% of the live load contribution for the floor according to (C.O.S.Q.C., 2017).
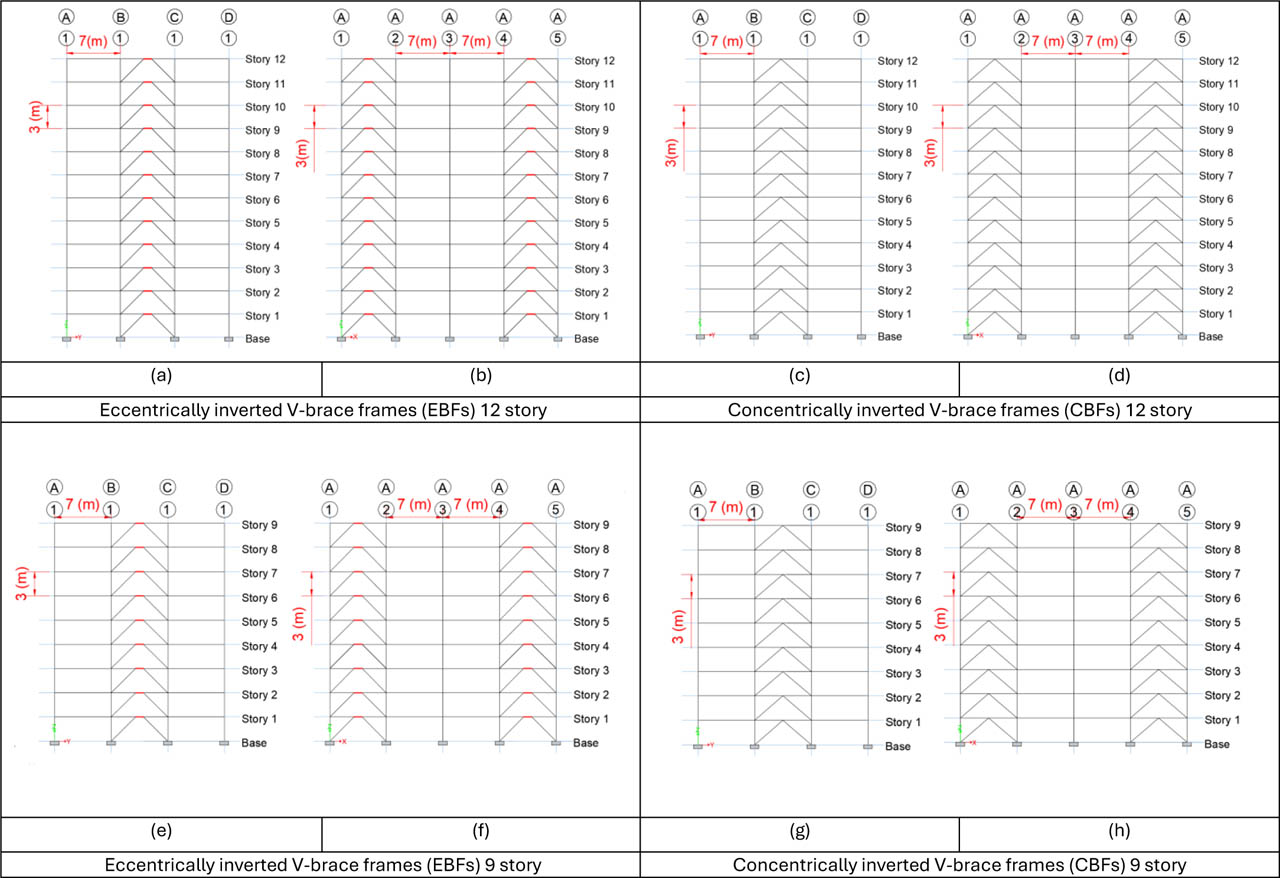
Figure 1:
Schematization of eccentrically inverted V-brace frames (EBFs) and concentrically inverted V-brace frames (CBF)
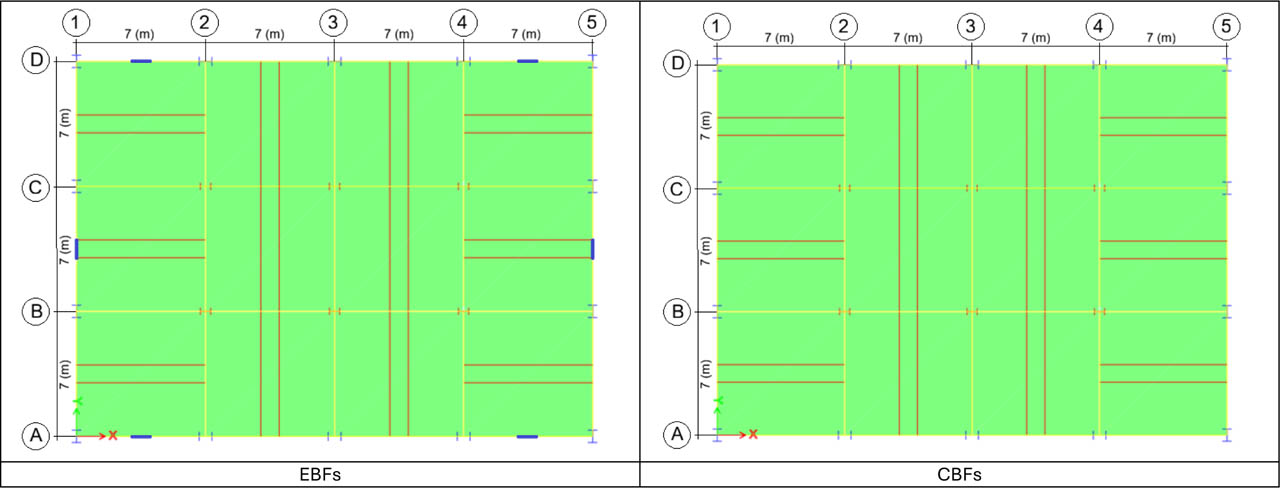
Figure 2:
Plan layout of eccentrically inverted V-brace frames (EBFs) and concentrically inverted V-brace frames (CBFs)
2.2. Structural Sections for the Building
The element cross-sections were suggested based on common construction practices, in line with the recommendations of design standards. For the design of the braces, links, beams, and columns, I sections with a yield strength fy = 414 MPa were used. The cross-section of columns and beams are shown in Table 1.
Table 1:
Structural sections for the building
| Building | Stories | Marginal Columns [mm] | Central Columns [mm] | Beams [mm] | Bracing [mm] | Link [mm] |
|---|---|---|---|---|---|---|
| 9 - story | 1st – 3rd | 740x630/30x45 | 580x470/20x35 | 430x300/18x25 | 490x350/15x20 | 444x220/15x18 |
| 4th – 6th | 610x560/25x40 | 510x480/20x30 | 390x280/15x20 | 464x330/12x18 | 400x200/10x15 | |
| 7th – 9th | 580x480/20x35 | 434x360/18x25 | 350x250/10x15 | 370x260/10x15 | 350x180/10x15 | |
| 12 - story | 1st – 3rd | 610x510/x25x40 | 490x410/20x35 | 350x200/15x25 | 360x260/10x15 | 364x130/10x18 |
| 4th – 6th | 450x410/20x30 | 400x410/15x25 | 310x200/10x15 | 277x240/10x15 | 316x100/8x12 | |
| 7th – 9th | 450x370/15x25 | 394x300/15x18 | 250x180/10x15 | 300x220/10x15 | 280x100/6x10 | |
| 10th – 12th | 400x330/15x20 | 370x280/12x15 | 236x180/8x12 | 276x200/10x12 | 260x100/6x10 |
3. Analysis Method and Modelling Member's Nonlinearity
The dynamic response of the structures is evaluated by nonlinear static (pushover) analysis (NSP) in ETABS - 19 (Computers and Structures, Inc., 2017). A 3-dimention structural model was created. The models that were designed for seismic zones of Baghdad according to codes (American Society of Civil Engineers, 2022; C.O.S.Q.C., 2017). The seismic parameters for structures are shown in Table 2. According to (American Society of Civil Engineers, 2022; C.O.S.Q.C., 2017), For NSP analysis, the modified coefficient method was utilized according to (Federal Emergency Management Agency, 2005) and recommendation in (American Society of Civil Engineers, 2017). To determine the target displacement, the pushover curves were developed by adopted the first mode distribution. The structural elements (braces, beams, and columns) was modelled as elastic elements and concentrated plastic hinges at each element end was employed, a lumped plasticity model is employed for frame elements (columns, brace, link and beams) as per (American Society of Civil Engineers, 2017). For beams and link, the moment rotation relationship was entered to ETAB utilizing steel beam – flexure hinge property type M3, also for columns utilizing steel columns – flexure hinge property type P-M2-M3 and for brace utilizing steel braces-axial. The lengths of plastic hinges was evaluated according to (Federal Emergency Management Agency, 2000), Lp = 0.5 of the section depth.
In order to modal the link element was used a technique employed by (Ramadan & Ghobarah, 1995), then modified by (Prinz, 2010). In this technique, the links was modeled as a linear elastic member with concentrated plastic hinges at each end.
The design load combinations that include earthquake effects, which should be used according to (American Concrete Institute, 2022; American Society of Civil Engineers, 2022), and the Iraqi seismic code (C.O.S.Q.C., 2017), are:
Where:DL = Dead load,
LL = Live load,
E = Effect of horizontal and vertical earthquake induced forces.
Table 2:
Seismic parameters according to American Society of Civil Engineers (2022) and C.O.S.Q.C. (2017)
| Seismic parameters | Values [-] | According to |
|---|---|---|
| Risk Category | II (offices) | (C.O.S.Q.C., 2017; American Society of Civil Engineers, 2022, Table 1.5-1) |
| Occupancy Importance Factor Ie | 1 | (C.O.S.Q.C., 2017; American Society of Civil Engineers, 2022, Table 1.5-1) |
| Seismic Design Category given that site class D (stiff silty clay soil ) and depends on (0.133 ≤ SD1 < 0.20) | C | (American Society of Civil Engineers, 2022, Table 11.6-2) |
| S1: mapped MCER, spectral response acceleration parameter at a long-period (at a 1.0 s-period), | 0.1 | (C.O.S.Q.C., 2017) |
| SS :mapped MCER, spectral response acceleration parameter at short periods (at a 0.2 s-period), | 0.3 | (C.O.S.Q.C., 2017) |
| SDS : design spectral response acceleration parameter at short periods, | 0.312 | (C.O.S.Q.C., 2017) |
| SD1 : design spectral response acceleration parameter at a period of 1.0 s, | 0.160 | (C.O.S.Q.C., 2017) |
| Damping | 5 % | |
| Response reduction factor (R) | Eccentrically Braced Frames (EBF) =8 Special Concentrically Braced Frames (SCBF)=6 | (American Society of Civil Engineers, 2022, Table 12.2-1) |
| Site class | D | (C.O.S.Q.C., 2017) |
| Overstrength Factor, Ω0 | 2 | (American Society of Civil Engineers, 2022, Table 12.2-1) |
| Deflection Amplification Factor, Cd | Eccentrically Braced Frames (EBF) =4 Special Concentrically Braced Frames (SCBF)=5 | (American Society of Civil Engineers, 2022, Table 12.2-1) |
4. Structural Analysis and Development of Fragility Curves
Nonlinear static (pushover) analysis (NSP) was performed using ETABS-19 (Computers and Structures, Inc., 2017) software program to calculate the target displacement (δt) then will be determined the capacity curve which represented the relationship between base shear force and displacement. The pushover curve adopting the modified coefficient method according to (Federal Emergency Management Agency, 2005), that was recommendation in (American Society of Civil Engineers, 2017). The NSP was performed in the both (±X and ±Y) directions, the analyses was including P-effects. According on (Federal Emergency Management Agency, 2005; American Society of Civil Engineers, 2017), the first mode distribution was utilized as a first distribution. In addition according on (Federal Emergency Management Agency, 2000), “the pushover curve is developed for at least two vertical distributions of lateral loads”. Therefore, the second distribution was uniform pattern of lateral force and third distribution was the equivalent lateral force (ELF), then the worst case will be the one governing. The design inter-story drifts was computed according to (American Society of Civil Engineers, 2022). The office buildings, as those in the current study, are classified as occupancy category type II according to (American Society of Civil Engineers, 2022). The life safety of performance level was employed according to (American Society of Civil Engineers, 2022), for which the maximum values of drift must not be exceed the 2%.
Seismic actions influences can be expressed in the fragility curves to assess the vulnerability of different steel bracing structures based on their probability of damage. In this study the fragility curves of the buildings under consideration were expressed the probability of the spectral displacement exceeds a specific damage state P (d ≥ ds).
Where the spectral displacement Sd take into account as a function to determine the strength of seismic action. The fragility curves characterized by the standard deviation βds and mean displacement Sdds. Thus, for a specified of damage state dsi, the fragility curves are expressed by the lognormal functions explained in Equation 4 (Federal Emergency Management Agency, 2003):
Where:ϕ - Standard normal cumulative distribution function,
βds - Standard deviation of the natural logarithm of spectral displacement of damage state, dsi,
Sdds - Median value of spectral displacement at which the building reaches the threshold of the damage state, ds.
The thresholds Sddsi, are expressed of yield and ultimate displacement of the structure obtained from the bilinear representation of the capacity curves as explained in Table 3.
Table 3:
Damage state thresholds (Federal Emergency Management Agency, 2003)
| Damage state | Damage state thresholds [mm] |
|---|---|
| Slight | Sdds1 = 0.70 x Dy |
| Moderate | Sdds2 = Dy |
| Severe | Sdds3 = Dy + 0.75 (Du - Dy) |
| Complete | Sdds4 = Du |
To estimate the variability of fragility curves for the damage states, the standard deviation (βdxsi) were used determined from values existed in (Federal Emergency Management Agency, 2003) for mid-rise buildings. Some propositions was made to fulfil this purpose as following:
1) The values of degradation (k) factor was determined accordance to (Canadian Standards Association, 1994) with assumptions that the seismic design level designation was high-code (HC) and for construction quality was Superior (S), the moderate of post-yield duration = 0.9
2) The structural systems of buildings with large capacity curves variability, βc = 0.4
3) The damage variability was small (0.2), βT,ds = 0.7 for slight damage.
4) The damage variability was moderate (0.4), βT,ds = 0.75 for moderate damage.
5) The damage variability is large (0.6), βT,ds = 0.9 for severe and complete damage, then was computed the lognormal standard deviation from Equation 5 (Federal Emergency Management Agency, 2003):
Where:βds - The lognormal standard deviation, which expresses the total variability of damage state (ds),
βc - The lognormal standard deviation, which expresses the variability of the capacity curve,
βT,ds - The lognormal standard deviation, which expresses the variability of the threshold of damage state.
The damage states classification are described in in Table 4.
Table 4:
Descriptions of primary structural performance levels (S-P Levels) according to American Society of Civil Engineers (2017) and Federal Emergency Management Agency (2000)
| S-P | Description | Overall Damage State |
|---|---|---|
| Immediate Occupancy (IO) | The building is safe to occupy and continues to function with minor damage and only limited cleanup. Repairs are not required before re-occupancy. | Minor yielding may occur in some elements (e.g., brace end zones, beam-end plastic hinges), but no significant strength or stiffness loss is permitted. |
| Life Safety (LS) | The structure is damaged significantly but retains a substantial margin against partial or total collapse. The risk of injury due to structural failure is low. Repair may be required before re-occupancy. | Moderate inelastic deformation is widespread. May involve yielding and minor local buckling of steel members (e.g., beam flanges, column webs) in moment frames or significant yielding in bracing members. |
| Collapse Prevention (CP) | The structure is heavily damaged and may be beyond economical repair, but it maintains its gravity load-carrying capacity. The structure retains no margin against collapse. | Extensive inelastic deformation is permitted. May involve severe local buckling, significant out-of-plane distortion, and fracture of non-load-bearing elements, provided the gravity system remains stable. |
| ||
5. Discussion of the Analysis Results
As mentioned in previous section, the NSP analysis was performed in (X and Y) directions for all models, the first load distribution in Y direction was adopted. Figure 2 shows the development of plastic hinges in models.
5.1. Development of Plastic Hinges
From Figure 3, it can be noticed that the forming of plastic hinges for concentrically inverted V-brace frames (CBFs) models was in braces, because the (CBFs) essentially resist lateral loads through axial forces (tension and compression) in the braces. When braces are exposes to a lateral load, one diagonal brace is put in tension, while the other is in compression. In an intense seismic activity, energy is dissipated primarily through the buckling and yielding of the braces. While the forming of plastic hinges for eccentrically inverted V-brace frames (EBFs) models was in links because the eccentrically brace frame is characterized by eccentricity through its possession of the link that is designed to yield and dissipate energy during an earthquake. This ductile behavior prevent premature buckling of braces, enabling a structure to absorb more seismic energy without an abrupt loss of strength.
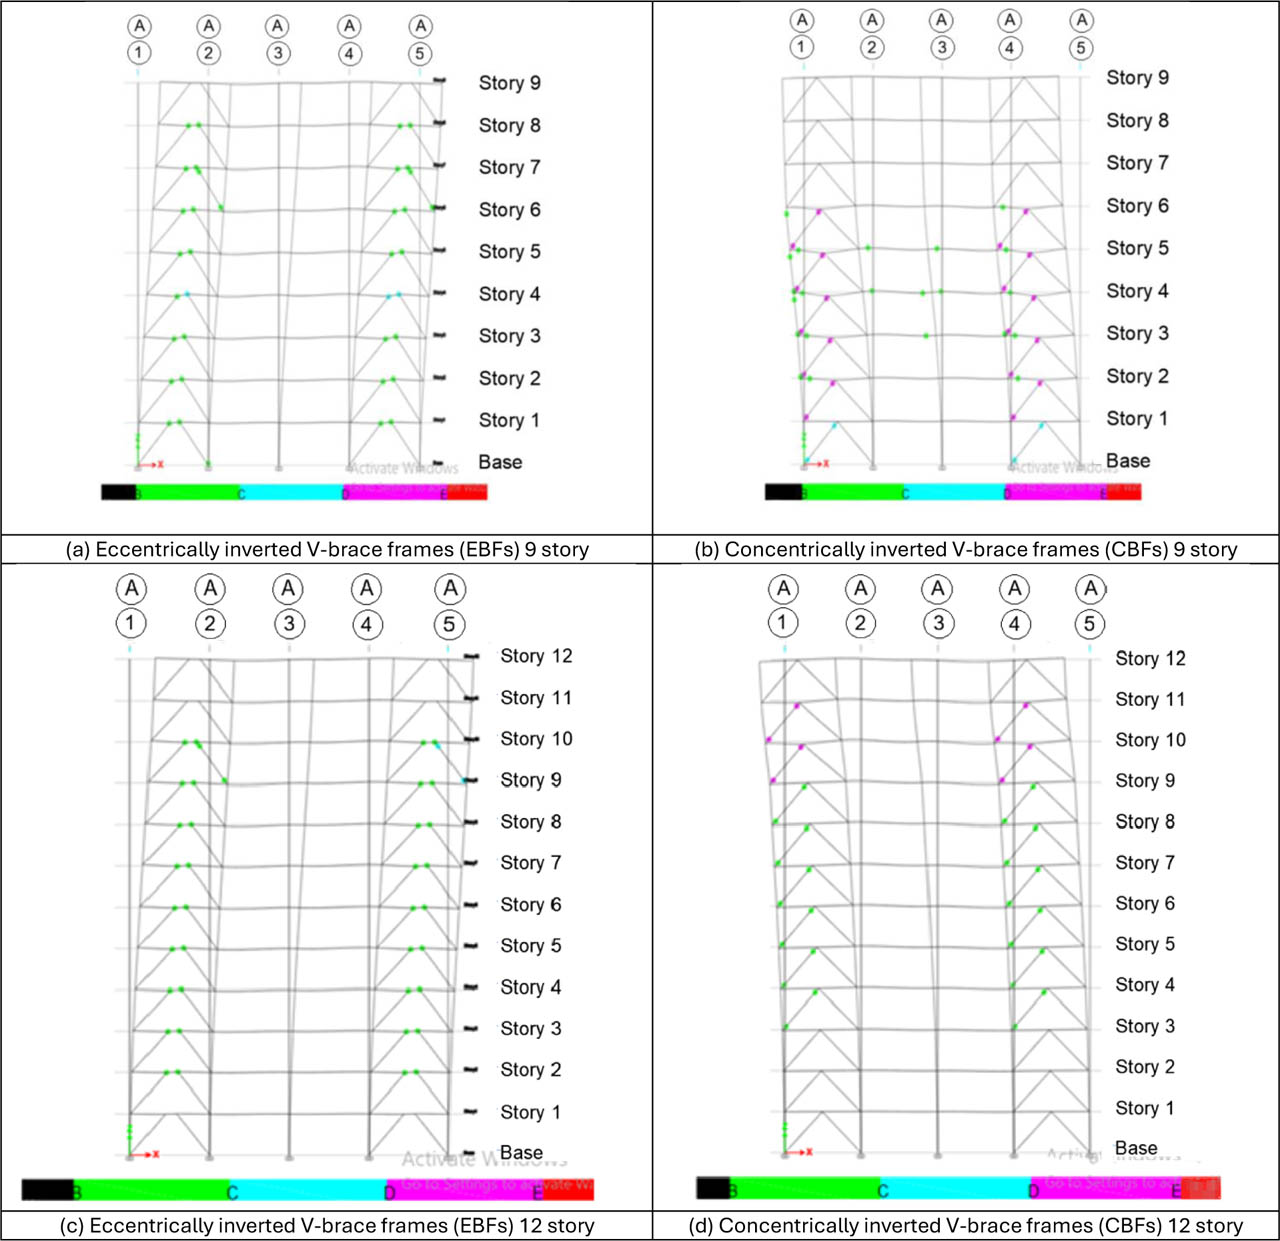
Figure 3:
Plastic hinges in models with 12 and 9 storyes
5.2. The Story Drifts
The story drifts for Y direction are shown in Table 5 and 6, all models fulfil the criteria of (American Society of Civil Engineers, 2022), for which the maximum values of drift must not be exceed the 2%. It can be noticed that the drift along the height for both 9 and 12 storyes of the eccentrically inverted V-brace frams (EBFs) models is less than the drift of the concentrically inverted V-brace frams (CBFs) models.
Table 5:
Story drifts for buildings with 12 story
| Story | Drift ratios [%] of EBFs model | Drift ratios [%] of CBFs model |
|---|---|---|
| 12 | 0.0051 | 0.0065 |
| 11 | 0.0060 | 0.0068 |
| 10 | 0.0089 | 0.0111 |
| 9 | 0.0077 | 0.0084 |
| 8 | 0.0048 | 0.0054 |
| 7 | 0.0044 | 0.0050 |
| 6 | 0.0032 | 0.0045 |
| 5 | 0.0032 | 0.0045 |
| 4 | 0.0029 | 0.0048 |
| 3 | 0.0032 | 0.0054 |
| 2 | 0.0023 | 0.0040 |
| 1 | 0.0012 | 0.0017 |
Table 6:
Story drifts for buildings with 9 story
| Story | Drift ratios [%] of EBFs model | Drift ratios [%] of CBFs model |
|---|---|---|
| 9 | 0.0075 | 0.0087 |
| 8 | 0.0055 | 0.0075 |
| 7 | 0.0054 | 0.0068 |
| 6 | 0.0051 | 0.0058 |
| 5 | 0.0047 | 0.0058 |
| 4 | 0.0046 | 0.0053 |
| 3 | 0.0044 | 0.0047 |
| 2 | 0.0034 | 0.0039 |
| 1 | 0.0015 | 0.0019 |
It can be observed from the results of story drifts for models with 9 in Y-direction are less for the EBFs model about (36% to 7%) along the height than the CBFs model. The story drifts for models with 12 in Y-direction is less for the EBFs model about (78% to 10%) along the height than the CBFs model.
5.3. The Fragility Curves
Figure 4 present the fragility curves of models under consideration, these curves were developed to quantify of the influence eccentrically inverted V-brace frames and concentrically inverted V-brace frames on the model's vulnerability. The displacement corresponding to the damage states for 50% and 90% probabilities is illustrated in Table 7.
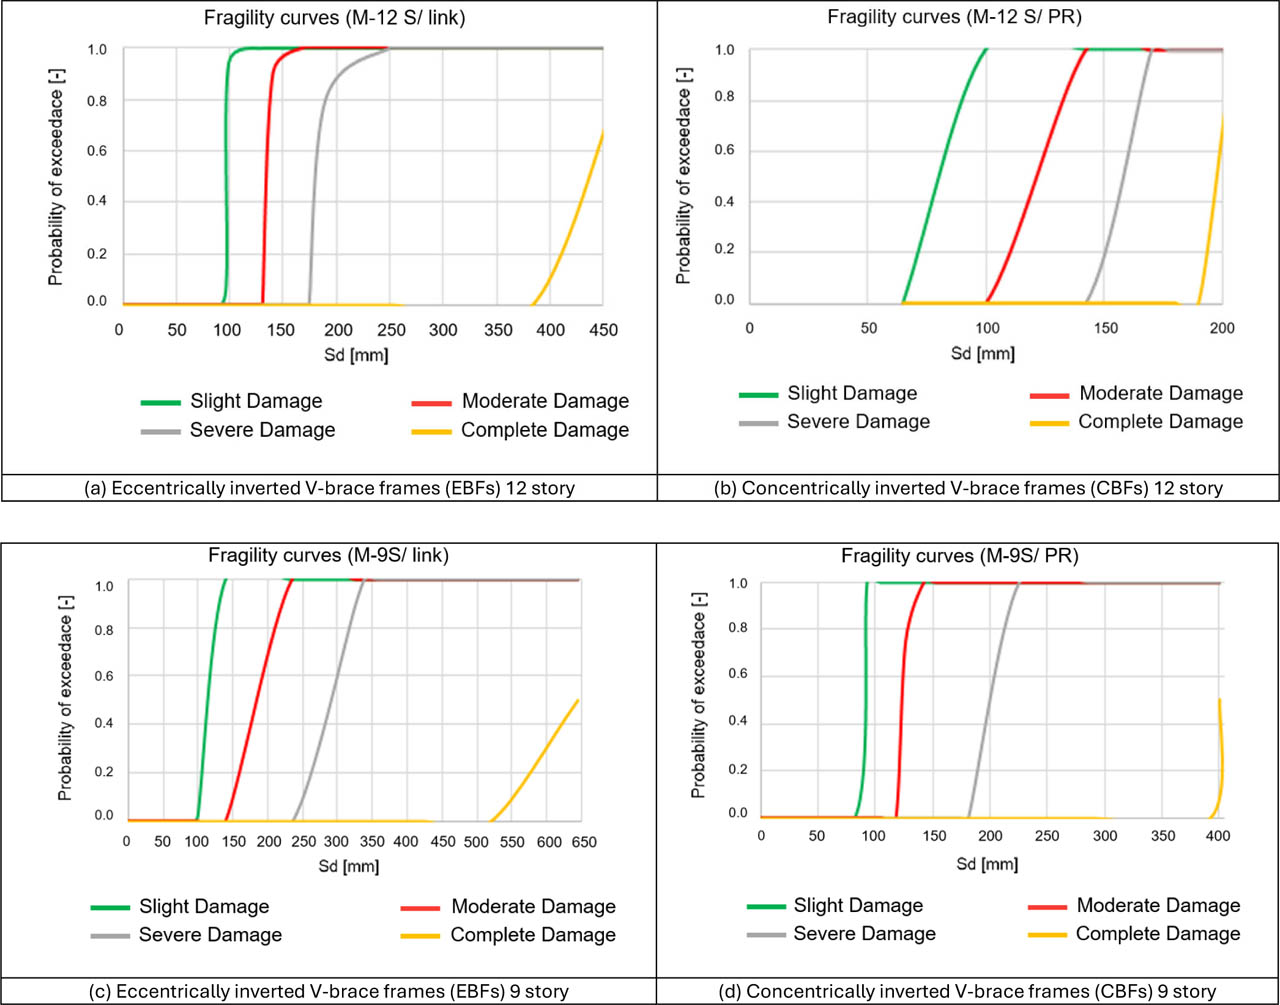
Figure 4:
Probabilities for models
Table 7:
Displacement (mm) corresponding to damage states for models
| Models | Probability of slight state | Probability of moderate state | Probability of extensive state | Probability of complete state | ||||
|---|---|---|---|---|---|---|---|---|
| at 50% | at 90% | at 50% | at 90% | at 50% | at 90% | at 50% | at 90% | |
| EBFs-12 story | 97 | 100 | 133 | 142 | 181 | 204 | 438 | - |
| CBFs-12 story | 66 | 95 | 123 | 137 | 157 | 167 | 198 | - |
| EBFs-9 story | 115 | 134 | 182 | 226 | 293 | 334 | 640 | - |
| CBFs-9 story | 90 | 92 | 122 | 132 | 203 | 219 | 392 | - |
It can be observed from the comparison of the results for models with 9 stories that the spectral displacement identical to the probability of slight damage state 50% and 90% of the EBFs is higher about 28% and 46% ,respectively as compared with the CBFs. For the probability of moderate damage state 50% and 90%, the spectral displacement of the EBFs is higher by 38 % and 71%, respectively as compared with the CBFs. For the probability of the extensive damage state 50% and 90%, the spectral displacement of the EBFs is higher about 44 % and 53%, respectively as compared with the CBFs. The probability of the complete damage state 50%, the spectral displacement of the EBFs is higher about 63 % as compared with the CBFs.
For models with 12 storyes that the spectral displacement identical to the probability of slight damage state 50% and 90% for the EBFs is higher about 21 % and 8%, respectively as compared with the CBFs. For probability of moderate damage state 50% and 90%, the spectral displacement of the EBFs is higher by 4 % and 13%, respectively as compared with the CBFs. For the probability of the extensive damage state 50% and 90%, the spectral displacement of the EBFs is higher about 24 % and 21%, respectively as compared with the CBFs. For probability of the complete damage state 50%, the spectral displacement of the EBFs is higher about 16% as compared with the CBFs.
6. Conclusion
In this study, the seismic response of the eccentrically inverted V-brace frames (EBFs) models and the concentrically inverted V-brace frames (CBFs) models with 12 and 9 story which are designed based on the codes (American Institute for Steel Construction, 2022; American Society of Civil Engineers, 2022; C.O.S.Q.C., 2017) locating on Baghdad were studied; the vulnerability was investigated by using fragility curves. The following observations are obtained:
○ Story drifts for the NSP analysis in Y-direction are less for the EBFs about (78% to 7%) along the height when compared to the CBFs models. The current models analysis lacks a dynamic time-history validation, although is more accurate. However, it can still proceed with a preliminary assessment using a simpler method as NSP.
○ For NSP analysis, it can be observed that the fragility curves for the CBFs models present poorer seismic performance and an increased damage hazard compared to the EBFs models. This is because the two systems have fundamental differences in how they dissipate seismic energy.
○ Fragility curves for the EBFs presents their controlled energy dissipation and higher ductility, significance they have a lower probability of significant damage or collapse even at higher seismic intensity levels. The damage is limited to the link beams, which can be reconditioned or replaced, thereby reducing the overall damage hazard.
○ Fragility curves for the CBFs indicates a higher probability of exposing a severe damage state or collapse at lower seismic intensity levels. The sudden loss of strength due to brace buckling and fracture contributes to this increased fragility.
From the above, by comparing the story drift, formed plastic hinges, and fragility curves of concentric vs. eccentric to determine which one is less vulnerable to a specific seismic hazard, it can be concluded that the eccentric bracing system is more ductile for a building in a seismic region, because its fragility curve shows a lower probability of extensive damage or collapse. For practice in Iraq, the EBFs are recommended for zones with high spectral acceleration; however, cost and detailing complexity should be considered.
Notes
[2] Contributed by Author Contributions
The authors collaboratively investigated the topic, systematically conducted the study, and jointly contributed to achieving the research objectives and deriving the final results.