

1. Introduction
Structural reliability analysis determines the probability that a structural system or component will fail. To conduct such an analysis, all possible uncertainties must be considered, including the variation of a structure's geometric and material characteristics and the uncertainty of the loads impacting it (Arrayago & Rasmussen, 2021; Brett & Lu, 2013; Cardoso, Rasmussen, et al., 2019; Cardoso, Zhang, et al., 2019; Zhang et al., 2016). Clarifying the effect of the importance factor needs to be done using many concepts, revealing its ability to affect the performance of any structure, depending on the reliability analysis of the survivor function, is one concept adopted here(Kuo & Zhu, 2012; Mi et al., 2020; Rusnak et al., 2024) (Kuo & Zhu, 2012; Mi et al., 2020; Rusnak et al., 2024).
One of the methods used for determining the importance factor value is Birnbaum's method, which uses the critical path set of the structure-function to specify the importance factor of each component (Qiu et al., 2022). Also, the dependency of each component's failure on the others plays a significant role in most engineering problems, due to the interactions and transitions of forces and stresses between the structural elements. So, it is more reliable to involve this effect in evaluating how the structure will perform with the presence of the important factor (Chatterjee et al., 2024; Lavaei et al., 2023; Zhang et al., 2014).
The challenge of handling uncertainty and managing the probability of failure in steel design has typically been addressed by minimizing the nominal strengths of members and connections using resistance factors calibrated to the required member reliability (Cardoso, Zhang, et al., 2019; Ellingwood, 2000; Galambos, 1990). Standard codes give provisions for these checks for materials such as steel and concrete, as follows (AISC, 2010; de Normalización, 2005):
Where:Ru : The required strength using load and resistance factor design (LRFD) load Combinations,
Rn : The nominal strength,
ϕ : The resistance factor,
ϕRn : The design strength.
Many studies have addressed structural reliability using various approaches. Abu Eusuf and Al Hasan (2013) studied the impact of structural elements and loading patterns on the reliability of structures throughout their lifespan. Structural elements are analyzed based on parameters such as height, span, and frame type, while loading patterns are identified in accordance with the serviceability limit of structural components. The study concludes that checking safety and serviceability is essential to fulfill the analysis and structural design requirements.
Arrayago and Rasmussen (2021) explored acceptable goal reliability indices for structural systems to create novel design techniques with sufficient system safety and system resistance factors. The research concentrated on developing rigorous structural reliability frameworks. In contrast, there are design guidelines based on sophisticated finite element analysis for the direct design of hot-rolled and cold-formed steel structures. The study covers three worldwide design frameworks—the Eurocode, US, and Australian frameworks—as well as the most popular stainless-steel families.
Zimmerman et al. (1992) used Monte Carlo simulation to estimate system reliability and deterministic rigid-plastic and stability analysis techniques. To ensure accurate predictions of structural behavior and safety, the authors emphasize the importance of accounting for both elastic and plastic collapse loads in structural analysis. Examples illustrate the technique and its application in structural reliability estimation.
Gharaibeh et al. (2002) used reliability-based methods to evaluate the importance of structural members in complex structures. The study introduced two important factors for members: the member reliability importance factor, which measures the impact of individual member reliability on system reliability, and the member post-failure importance factor, which assesses the effect of a member's failure on the overall system. This approach helps identify critical components, aiding in maintenance priorities and design improvements.
Zhang et al. (2016) investigated the reliability of frames designed with inelastic analysis. The study assesses the system reliability of two steel moment frames subjected to combined gravity and wind loads. These frames are designed using second-order inelastic analysis, and their strength and serviceability reliability are evaluated. The study explores how system resistance factors and wind-to-gravity load ratios affect system reliability. It also highlights critical research issues that must be addressed before adopting a system reliability-based design methodology.
The study concludes that inelastic analysis design can result in more integrated, cost-effective structures; however, additional research is necessary to meet minimum system reliability requirements.
Gholizadeh and Mohammadi (2017) introduced a methodology for optimizing seismic design in steel moment-resisting frames. This study combines particle swarm optimization (PSO) and bat algorithm (BA) into a hybrid metaheuristic, PSO-BA. This hybrid approach aims to improve the computational efficiency and reliability of seismic design optimization. They concluded that the proposed methodology can efficiently address reliability-based seismic design optimization problems, delivering reliable, cost-effective designs for steel structures.
Song and Kang (2009) investigated a matrix-based system reliability (MSR) approach that effectively uses basic matrix operations to calculate the probabilities of general system events. The MSR method uniformly applies to various system events, including series, parallel, cut-set, and link-set systems.
The study showed that the MSR approach can effectively calculate system sensitivity and reliability by employing basic matrix operations. The authors highlight the importance of accounting for statistical dependence in reliability analysis and propose a new matrix-based procedure to calculate the sensitivities of system reliability with respect to parameters.
Nguyen (2022) predicted the failure probability of a floor system using a reliability approach and Monti Carlo simulation. It was found that the likelihood of failure for shorter-span floors is almost zero; meanwhile, for larger spans, this probability exceeded 36% in both numerical and analytical reliability analyses.
Jabir et al. (2022) used reliability analysis to predict the half-cell potential and electrical resistivity of non-destructive corrosion for different concrete mixes. The corrosion probability was found to be higher for RH specimens than for reference specimens when exposed to high relative humidity.
In this study, a steel frame unit was chosen instead of a concrete frame unit to minimize the effect of the force and stress transitions that appear more with the interaction between steel and concrete, especially at the joint due to the continuity of the reinforced concrete members and the bonding between the concrete and the reinforcing bars. Still, there is also an interaction between the steel frame elements as the structure-function was formed, which was considered in evaluating the structural performance.
2. Solution Methodology
In order to distinguish the effect of the importance factor for each structural element of a steel frame unit on the survivor function, a Birnbaum's concept was used to find the degree of importance of each element of the frame. Before this procedure took place, the whole elements of the steel frame system were designed optimally using AI aids in order to get an optimum solution to be compared for the two cases of dependent and independent failure. Each element was limited in design by the constraints needed to make the design results more applicable and subjectable to the design specifications.
Fig. (1), Simplify the main steps of the design procedure, starting with defining the design variables for each element and the objective function to concluding the compared relation of dependent and independent failure of the whole system through introducing the effect of the importance factor of each of these designed elements.
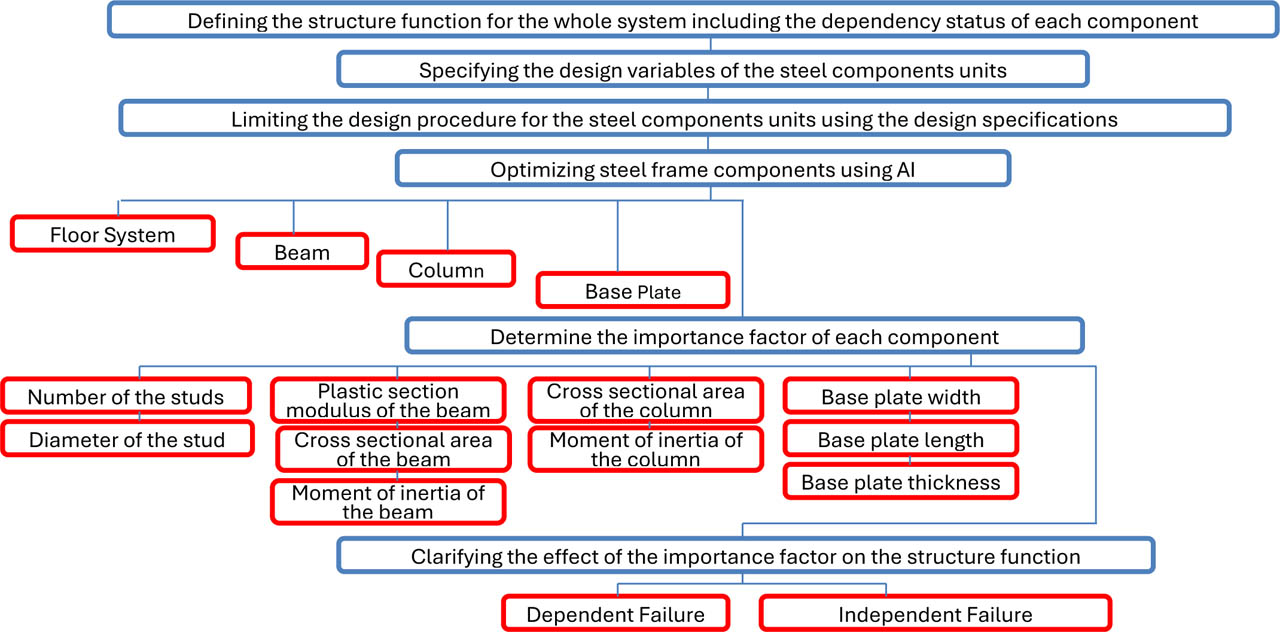
Figure 1:
Solution methodology flow chart
3. Frame system
Any functioning structure should be composed of several compound elements that, together, fulfill its main purpose. In this study, a frame structure unit will be designed through a fault tree analysis with a reliability diagram; this frame unit consists mainly of structural elements such as columns, beams, column-beam connections, base plates, and slab-beam shear connectors, as shown in Figure 2.
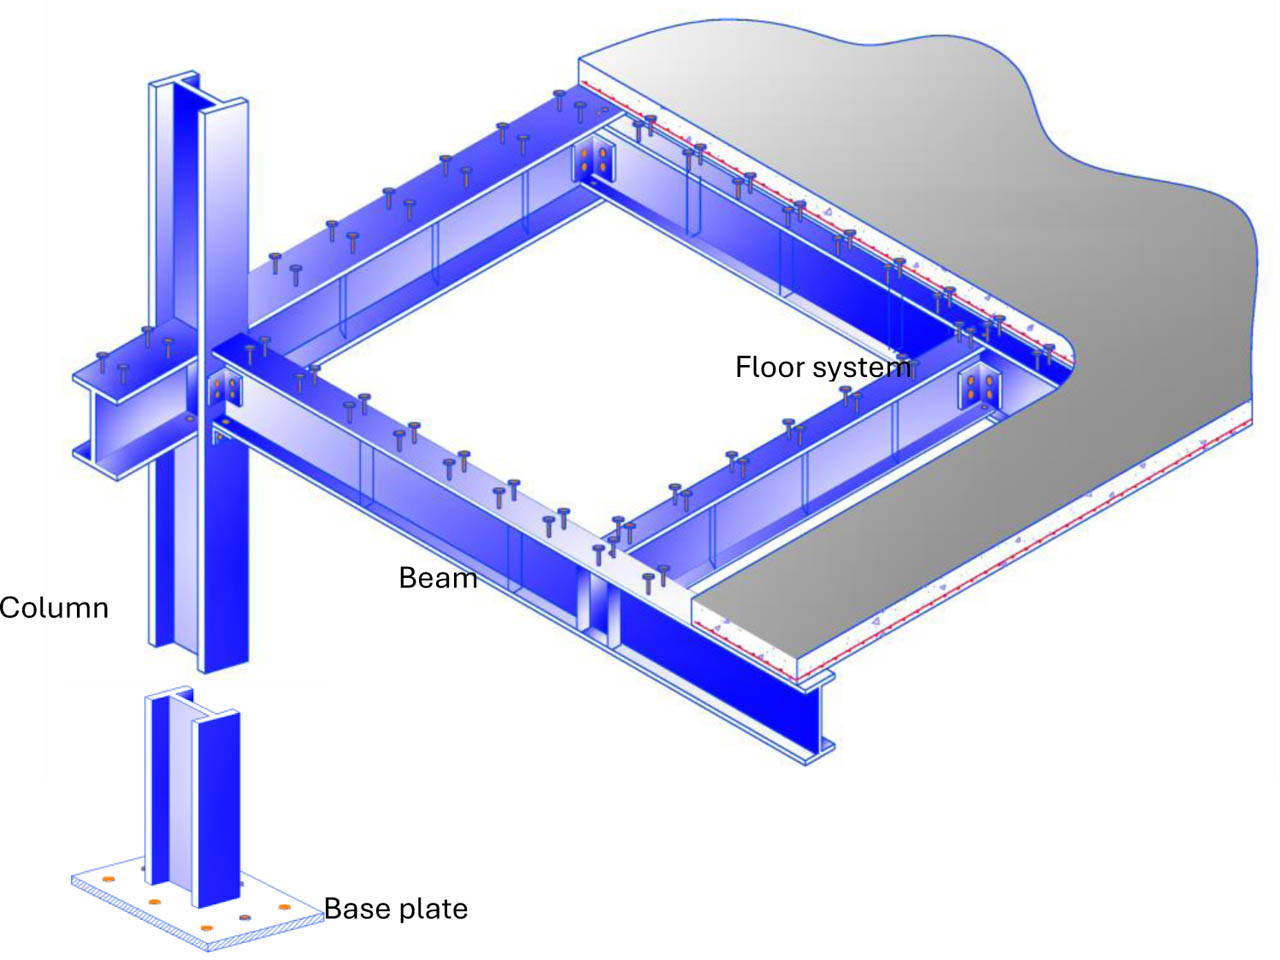
Figure 2:
Frame system units
Each of these elements may fail in many ways (Ghobashy et al., 2023), all kinds of these failures will be taken into consideration through the formation of the fault tree diagram, and, so through the design procedure, the structure-function of these failures for each element will be represented in a parallel structure way through an (AND Gate) that consider the element is failing through all types of failures that may took place, Figure (3). While the failure of the whole frame element as a final result will be represented in a series structure way through an (OR Gate) that allows the failure of the frame system to take place if any element fails, Figure 3.
4. Structure function
The structural function for any system represents the probability that the designed element does not fail under the applied loads through the considered failure types (flexural, shear, axial, … etc.) in design, it could be dependable for each part of its components (considering all types of failures for that element) or dependable for any part of its components (considering only one type of failure for that element), the first type is called a series structure where the system is called to be functioning if and only if all of its components are functioning. While the second type is called a parallel structure, where the system is considered to be functioning if only one of its components is functioning. As for the probability of failure, it represents the inverse of the structural (survivor) function for this case.
For a series structure, the structure function of the system can be represented by:
And for a parallel structure:
Where:x1, x2, x3,……, xn: are the components of the frame system units.
For this system unit to work properly, the structure components should be composed in a combined (series, parallel) way (Maihulla et al., 2022; Martz & Wailer, 1990; Rausand & Hoyland, 2003; Zhang et al., 2024). This means that, parts of the structure will function as a series structure with all of their components working at the same time, and other parts will function as a parallel structure with only one of them working, the two structural systems (series, parallel) will interact together as much as it will take to make the whole frame system's unit successfully pass as in (Xie et al., 2020). The fault tree construction for a frame system unit is shown in Figure 3.
Noticing that the fault tree diagram (in this case) is limited to two logical gates (AND gate, OR gate). According to (de Normalización, 2005), the reliability structural construction for this frame can be modeled using a reliability block diagram (RBD). The same results can be gained using both simulations. Transforming the fault tree diagram into a reliability block diagram is shown in Figure 4, using both parallel and series representations. As for (RBD) an OR gate may be represented by a series structure since the failure of one component of the structure will cause a system failure, while a parallel structure may represent an AND gate since the failure of the system in this representation needs all the elements to be failed.
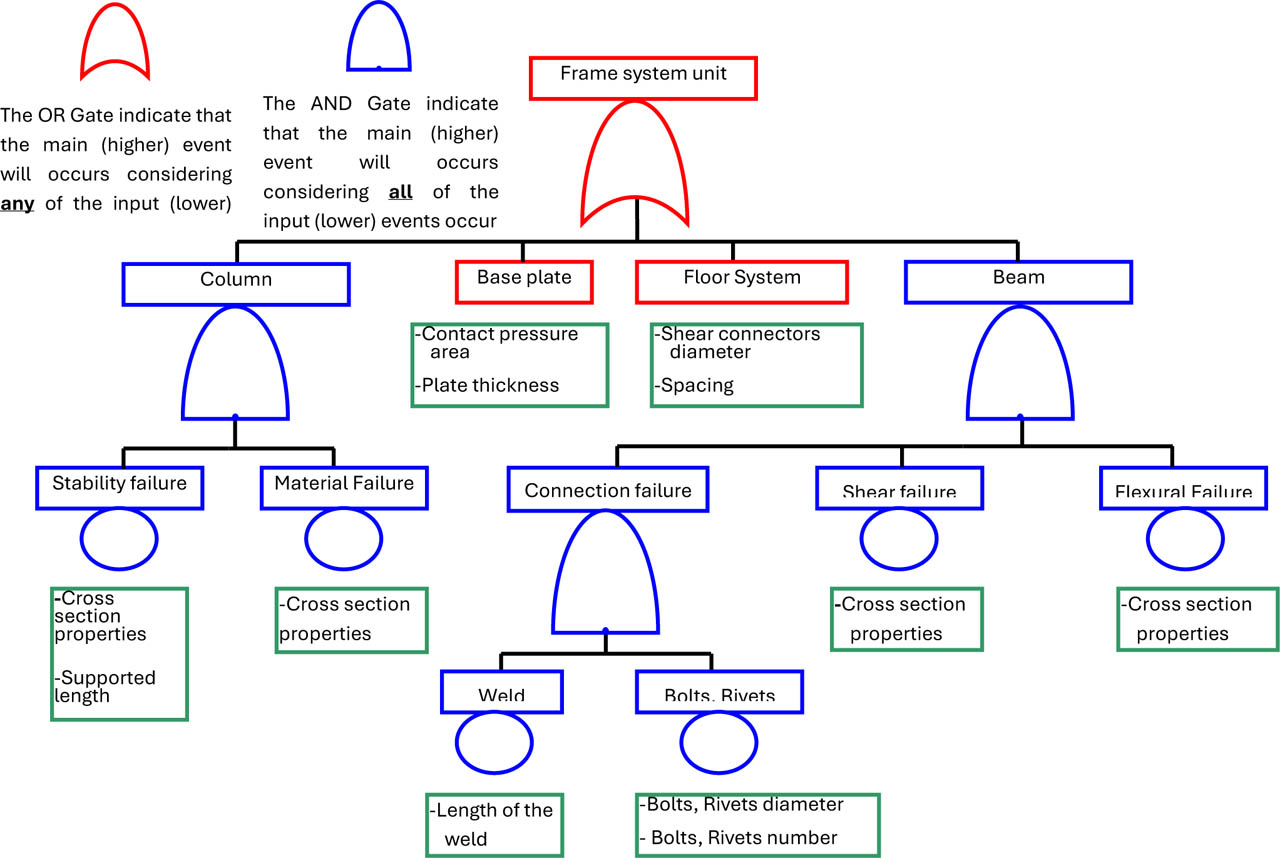
Figure 3:
Fault tree diagram for the frame system unit
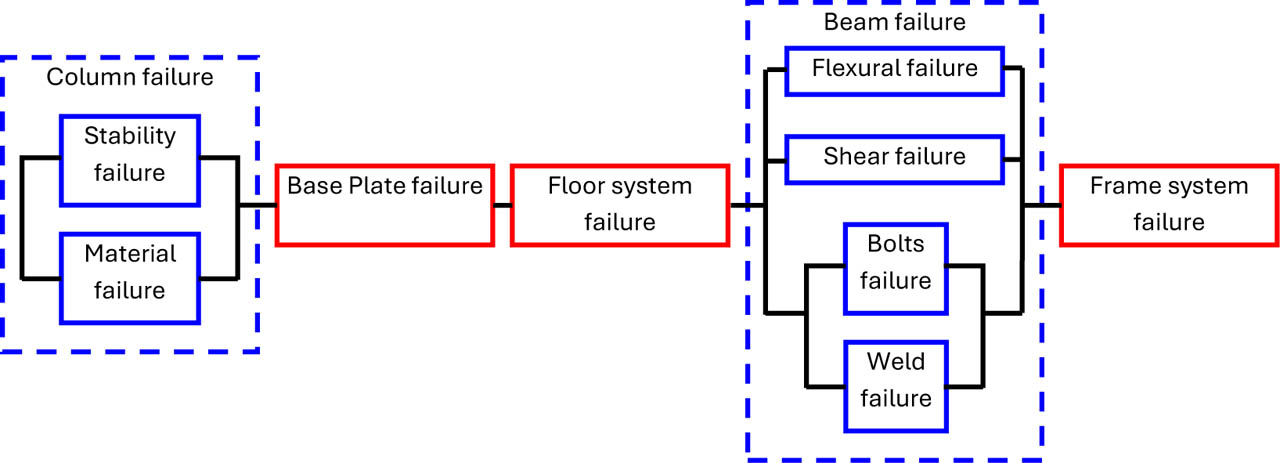
Figure 4:
Reliability block diagram for the frame system unit
For this specific case, the structure function will work in a series way with the main components, while each component will work in a parallel way with the failure mode.
Where:ϕ(sf): frame system function,
ϕ(sf) = 1, if the system is functioning,
ϕ(sf) = 0, if the system is failing,
n: number of frame system units.
ϕ(si): component of frame system function,
ϕ(si) = 1, if the system is functioning,
ϕ(si) = 0, if the system is failing,
m: number of modes of failure of component frame system units.
A MATLAB code was developed with the assessment of the pattern search method as a tool to find the exact values of the main parameters (variables) of the problem, which are, in this case ( the cross-sectional properties of the column, cross-sectional properties of the beam, base plate dimensions with its thickness, the number and the diameter of the bolts for beam-column connection, the length of the weld for beam-column connection, the diameter and the spacing for the shear connectors), as for other basic and mechanical properties their values will be fixed (yield strength, supporting condition, shape of the section, applied load, …..).
The importance of each frame element will not be included in the design procedure. Pattern search technique will be used to find the suitable designed elements with their distribution, if needed.
Regarding the importance of the structure's components, the Birnbaum's concept was used here through the following formula (Rausand & Hoyland, 2003):
Where:Bϕ(i): relative proportion of the 2n-1 possible state component.
By considering the notations shown in Table 1, the reliability block diagram in Figure 3 may be expressed by the following structure functions:
The beam's structure function:
The floor system's structural function:
The base plate's structure function:
The column's structure function:
The frame's structural function:
Table 1:
Structural components notations
| Component Notation | Component Failure | Component Notation | Component Failure | ||
|---|---|---|---|---|---|
| x1 | Flexural failure | Beam failure | x5 | Floor system failure | |
| x2 | Shear failure | x6 | Base Plate failure | ||
| x3 | Bolts failure | x7 | Stability failure | Column failure | |
| x4 | Weld failure | x8 | Material failure | ||
Due to a large number of possible cases for a system with eight components (1024 possible combinations), the calculations of finding the importance of component 1 for a three-component system are shown in Table 2 to explain the procedure of finding the component importance (Rausand & Hoyland, 2003) then, the rest of the components importance for the 8-component system with the structure function in eq. (8) are calculated with the same procedure using a truth table, and their summarized results are listed in Table 3.
Table 2:
The importance of component (1) for a three-system component (Rausand & Hoyland, 2003)
| (.,x2,x3) | ϕ(1, x2, x3) − ϕ(0, x2, x3) | C(11,x2,x3) |
|---|---|---|
| (.00) | 0 | |
| (.01) | 1 | {1,3} |
| (.10) | 1 | {1,2} |
| (.11) | 1 | {1,2,3} |
In this case the total number of critical path vectors for component 1 is 3:
while the total number of state vectors (.1, x2, x3) is 23-1 = 4. Hence:5. Optimum Design of Steel Elements
5.1. Design of Floor System
As for the floor system, part of the reinforced concrete slab will act as one unit with the steel beam, the floor system will be considered functioning if and only if the slippage between the slab and the beam was prevented, meaning that, the welded shear connectors (anchors) should resist the horizontal shearing force completely.
A fully composite beam will be considered in design by limiting the minimum number of anchors to a certain value, and the ribs of the metal deck (which work as a formwork for the slab) will be positioned perpendicularly to the beam; the contribution of this metal deck to the slab strength will not be considered in design.
Nominal shear strength of the studs should be limited by equation I8-1 from the (construction, 2010):
Where:Asa = cross-sectional area of steel-headed stud anchor, in2 (mm2),
Ec = modulus of elasticity of concrete,
, ,
Fu = specified minimum tensile strength of a steel-headed stud anchor, ksi (MPa),
Rg = 1.0 (One steel-headed stud anchor welded in a steel deck rib with the deck oriented perpendicular to the steel shape),
Rp = 0.75 (Steel-headed stud anchors welded in a composite slab with the deck oriented perpendicular to the beam and mid-height ≥ 2 in. (50 mm)).
The upper limit for the stud diameter was restricted to (2.5 × the flange thickness(tf ), while the minimum and maximum spacing were limited by (6 × the stud diameter (d)) and (8 × the slab thickness (ts) respectively (Segui, 2007).
In order to ensure that the nominal shear strength of the designed studs is capable of resisting the horizontal shear force, the objective function for choosing the suitable stud's diameter and its spacing, was chosen to be:
Where:Ns: Number of the studs for half the span (one line only),
Qn: Nominal shear strength of one stud,
Vc : Horizontal shear force corresponding to full composite action and is equal to:
or whichever is less
Where:
As: The area of the cross-section of the beam,
fy: The yield stress of the steel section,
AC : The area of the equivalent slab cross-section,
: Concrete compressive strength.
A composite beam with W18×35 that supports a 4.5-inch reinforced concrete slab with 20 psf partition load and 125 psf live load, the beam has a span of 30 ft and 90-inch effective width, material mechanical properties are , fy (50 ksi) and fu (65 ksi). The studs were designed using pattern search to find a suitable diameter and distribution of them. The design results show that a 0.5604-inch stud with a total number of (42.823743) should be distributed as a single line over the half span of the beam with a spacing of 4.186 inches that meets the minimum and maximum spacing limitations mentioned previously. The objective function was achieved through five iterations with zero constraint violations and a value of 0.0009366 kips (Figure 5), which gives the largest number and stud diameter that can resist the horizontal shear force.
5.2. Design of Beam
The objective here will be to have the most suitable section to resist flexural, shear, and deflection. For this reason, minimizing the plastic section modulus and the web cross-sectional area (Nguyen, 2022), while maintaining the designed W-section moment of inertia, was chosen as the objective function.
To conclude the design procedure, the three main variables ( Zx, Aw, I) were limited by the following design constraints:
Zx : Plastic section modulus of steel cross-section,
Cv : “Critical web stress to shear yield stress ratio” (Segui, 2007),
Aw : Web area.
The permissible live load deflection was limited to a maximum value of (L/240). All these limitations were set to ensure that the designed section will be durable and serviceable under the applied loads.
A best W shape was selected for a supported beam with Fy = 50 ksi and a full laterally supported length of 30 ft, the beam was carrying a 4.5 k/ft live load and 0.75 k/ft dead load, E = 29000 ksi and the limit state for this example was assumed to be shear yielding, so, Cv was taken to be equal to 1.0.
The final results were gained in four iterations with zero violation for the design constraints, Figure 5, and they were (Zx = 245.7 in3, Aw = 4.1 in2, and I = 1885.3 in4).
5.3. Design of Column
The design compressive strength will represent the objective function in this case.
Where:ϕ: Compression resistance factor (0.9),
Pn: Nominal compressive strength, kip (kN),
Pu: Factored load, kip (kN),
Fcr: Available critical stress, ksi (MPa),
Ag: The area of the designed cross-section, in2 (mm2).
The Euler stress of the elastic column was reduced to the following expression through the critical stress to take into account the initial crookedness effect.
Where:Pu : Euler load, kip (kN),
k: Effective length factor,
L: Length of the compression member, in (mm),
r: Radius of gyration, in (mm).
The design problem should be constrained by the design constraints; otherwise, the proposed solutions will not be reasonable or will be infinite in number. A recommended (but not required) upper limit on the slenderness ratio from AISC E2 will be used here to ensure the designed section is economical.
Also, to control the behavior within the elastic range, the slenderness ratio was limited with the following constraint:
Where:E: Modulus of elasticity of steel (29000 ksi).
A 20 ft length column was designed using pattern search with pinned ends to support a 350 kips ultimate load. Fy was taken to be 50 ksi. The designed compressive strength was achieved through 3 iterations with no constraint violations (Figure 5), and the difference from the applied load was 6104 kips. The designed section appears to have a moment of inertia of about 89.2383 in4 and a cross-sectional area of about 23 in2.
5.4. Design of Base Plate
The size of the base plate was chosen to represent the objective function in the design procedure as follows:
Where:B: The plate width,
H: The plate length,
t: The plate thickness.
A trading procedure was performed among those three variables to find an appropriate design result using pattern search.
Every design process should be limited by the required constraints according to the design specifications. In this case, the first design constraint was used to limit the concrete design strength beneath the base plate with a minimum value to resist the applied load by the following equation:
Where:A1: The base plate area,
A2: The largest supporting concrete area.
: Should be taken to be equal to 2.0 if the base plate was supported directly by a relatively larger foundation area than its area, and equal to 1.0 if it was supported by a pedestal with the same area (McCormac, 2006).
To find the smallest area of the base plate that can handle the applied loads, the following constraint was used.
Where:ϕc: 0.65 (for LRFD design),
Pu: The ultimate applied load.
The geometrical properties of the base plate were constrained by the following to make the design results more reliable and effective. Also, to ensure the designed variables match those available in the local market.
Where:d: Total depth of the column cross-section,
bf: Flange width of the column cross-section.
In order to make the base plate dimensions approximately equal, the following equality constraints were used throughout the design procedure.
The final equality constraint was used to find the suitable plate thickness to fulfil the base plate strength required to resist the applied load with the other dimensional variables.
Where:Fy: The yield stress of the base plate and w is the largest of:
A base plate was designed to support a W12×65 column with Fy = 36 ksi, the base plate was positioned on a 9 × 9 ft footing having . The column was transmitting an ultimate load of 720 k to the footing.
The design results showed that the most suitable base plate dimensions are (B=14.7169 in, H=14.7582 in, and t=1.3627 in). These final results were gained through 3 iterations with zero constraint violations, Figure 5.
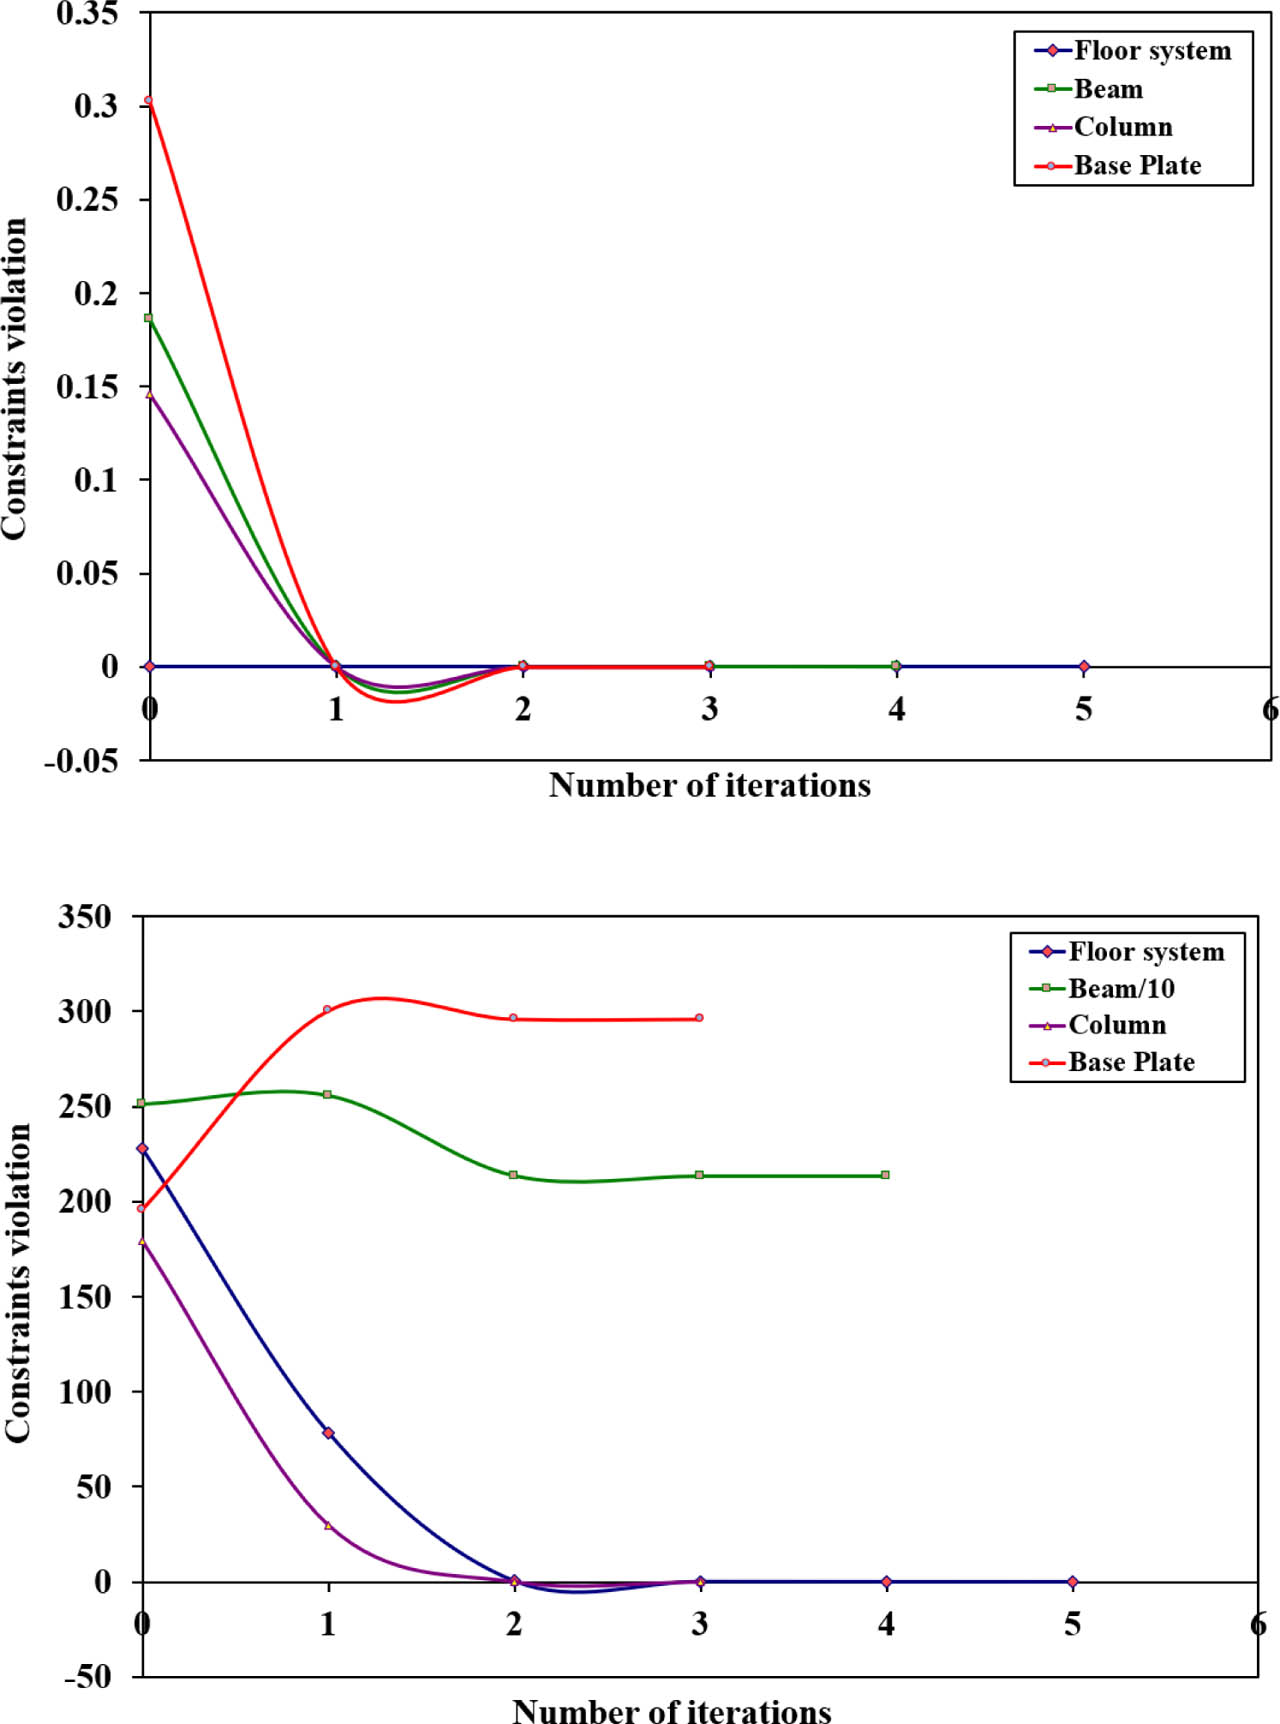
Figure 5:
Constraints violation and final objective function for frame system elements
6. Dependent and Independent Failure
The case in which the failure of an element affects another element in a structural unit is called dependent failure, whereas failing each element in the structural unit separately, without any interaction between them, is called independent failure (Rausand & Hoyland, 2003). The importance factor of each element of the frame system unit can be introduced to the overall structural objective function as follows:
Where:Sb: the structural importance factor of the beam element of the system,
Sf : the structural importance factor of the floor element of the system,
Sbb: the structural importance factor of the base plate element of the system,
Sc : the structural importance factor of the column element of the system,
f(x): the structural function of the beam element,
f(x)f: the structural function of the floor element,
f(x)bp: the structural function of the base plate element,
f(x)c : the structural function of the column element.
By solving the entire system optimally, including all structural components, as shown in the previous equation, with the same design constraints for each element, the new design was obtained in three iterations with zero constraint violations, as shown in Table 4. Slightly different results were achieved for each component when using a unified objective function compared to solving the component separately.
Counting the importance factor of each element in the objective function using the pattern search technique for independent failure did not change the optimal design results for each cross-section, depending on the degree of its importance, as shown in Table 5.
Table 4:
Objective function and constraints violation of the whole unified system
| Iterations | Objective Function | Constraints Violation |
|---|---|---|
| 0 | 3114.32 | 0.3029 |
| 1 | 2983.31 | 0 |
| 2 | 2438.8 | 0 |
| 3 | 2435.23 | 0 |
Table 5:
Importance factor effect on optimally designed frame system components
| Frame components | Independent Failure of separated components | Independent Failure of the whole system | % Difference | |
|---|---|---|---|---|
| 1 | Number of the studs | 43 | 45 | −4.65 |
| 2 | Diameter of the stud [in] | 0.5604 | 0.5 | 10.778 |
| 3 | Plastic section modulus of the beam [in3] | 245.7 | 245.7 | 0.0 |
| 4 | Cross-sectional area of the beam [in2] | 4.1 | 4.3 | −4.878 |
| 5 | Moment of inertia of the beam [in4] | 1885.3 | 1885.4 | −0.0053 |
| 6 | Moment of inertia of the column [in4] | 89.2383 | 89.2 | 0.0429 |
| 7 | Cross-sectional area of the column [in2] | 23 | 22.9 | 0.435 |
| 8 | Base plate width [in] | 14.7169 | 14.4 | 2.153 |
| 9 | Base plate length [in] | 14.7582 | 15.4 | 4.348 |
| 10 | Base plate thickness [in] | 1.3627 | 1.3 | 4.6 |
While for dependent failure, one of the commonly used methods is the β - factor model, which depends on the failure rate of each component of the system.
where:λi : the failure rate of component I,
n: number of the system's components.
Introducing the structural importance factor as an effective factor for failing each component, equation (28) for this case will be:
The survivor function R(t) (which is the probability that the items of the whole system unit survive before the time of failure under the applied conditions (external loads, service life-time of the structural element, environmental conditions, …etc.) through the design process) of the unit frame system can be expressed as follows:
In general, the failure rate (λ) (also called the hazard rate) indicates the probability that a component will fail per unit time, given that it is still functioning at that moment. Additionally, the constant failure rate (λ=1) assumption means the component maintains a constant failure rate over time. Here, time is greater than zero; the specific “time unit” depends on the context (hours, years, cycles, etc.) (Rausand & Hoyland, 2003). Considering that the beam has four parallel connected components and the column has two parallel connected components. In contrast, one component will represent the floor system, and one will represent the base plate. As mentioned earlier in Table 1, the effect of the structure importance factor on the survivor function of the whole structure could be found by assuming all the components have the same failure rate (constant failure rate, λ = 1) and calculating the β-factor first without using the importance factor and then by using it, eq. (29). Figure 6 and Table 6 show the deviation of this effect with time before failure (regardless of the unit of time) and compare the survivor function with and without the importance factor. Figure 6 and Table 6 show that the survivor function decreases progressively from 100% to 10% without the importance factor, indicating normal failure over time, while it drops steeply from 100% to 5% with the importance factor, suggesting that the structure is assessed under stricter reliability criteria. Conversely, the importance factor decreases the survivor function by 10% to 47% over the time range, with a reduction of approximately 22.5% at one unit of time when accounting for common-cause failure using the β-factor. This suggests that omitting the importance factor may lead to an inflated estimate of the survivor function for dependent failures in the frame system unit. This behavior reflects a more conservative design philosophy for high-importance structures—an essential element of risk-informed design and safety management.
Table 6:
Survivor function with and without the importance factor
| Time Unit | Survivor function without the importance factor effect | Survivor function with importance factor effect | % Reduction due to the importance factor impact |
|---|---|---|---|
| 0 | 1 | 1 | NA |
| 0.5 | 0.6959 | 0.6266 | 10 % lower |
| 1 | 0.40375 | 0.3133 | 22.5 % lower |
| 1.5 | 0.2074 | 0.13186 | 36.5 % lower |
| 2 | 0.0927 | 0.0494 | 47 % lower |
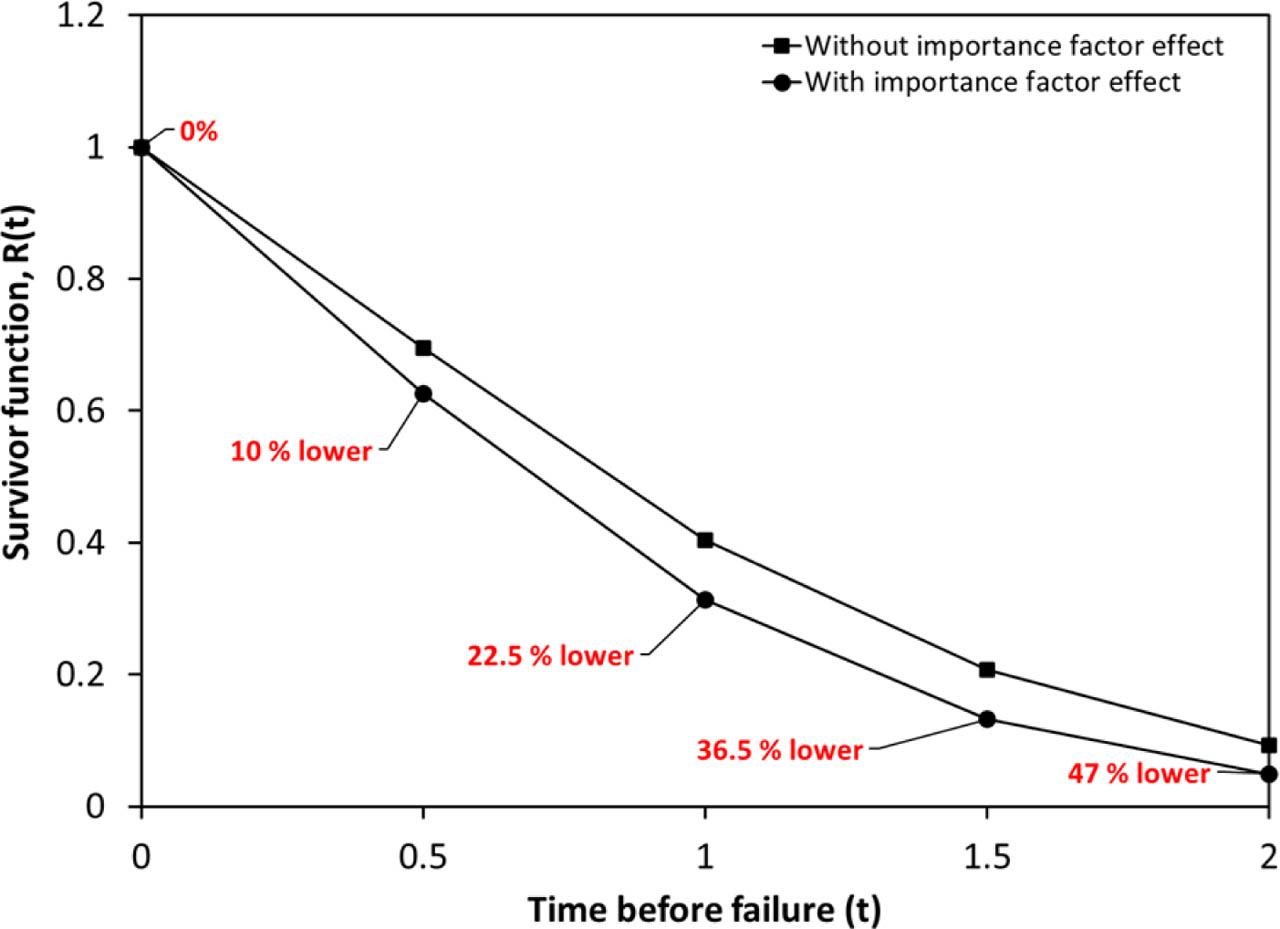
Figure 6:
Survivor function of frame system unit with time including and excluding the structural importance factor effect
7. Conclusion and Recommendations
This study conducts a reliability analysis of a steel frame system unit, represented by its main components, to determine the impact of each important factor on the overall survivor function of the entire frame, considering both independent and dependent failures. The importance factors for independent structural components had a slight effect on the objective function of a steel frame unit, taking into consideration the weight of the structural elements in design and the capacity of each element to resist the applied loads, even by including the importance factor through the objective function of the whole structural unit. On the other hand, considering dependent failure using the β in the factor method, the failure interaction between the components of the frame system unit reveals that the importance factor has a significant impact on the structure's survival function over time. Then, the following conclusions can be drawn from the results:
An additional design consideration (using or not using the importance factor) of beams and columns are insignificant compared to other structural units (whether to include or not in the solution), because the impacts of beams and columns are more than other structural elements in design. The importance factor has a positive impact on the design considerations for base plates, with an average 3.67% increase (significantly greater than that for beams and columns).
The most significant impact of this important factor is on the design considerations of the diameter of studs (rivets) (in case of fixing the number of studs), approximately 10%, highlighting the importance of the structural unit. However, the columns and beams are considered the most significant components in the whole steel system case because, as mentioned earlier, there is no need to introduce an importance factor into the design considerations, as it has already been taken into account through the safety factors. At the same time, their impact will be reduced in the presence of rivets due to their local failure and will not directly affect the whole unit system.
Including the importance factor reduces the survivor function by approximately 22.5%, indicating that excluding the importance factor may provide an exaggerated estimate of the survivor function of the frame system unit.