

Figure 1:
Fine aggregate

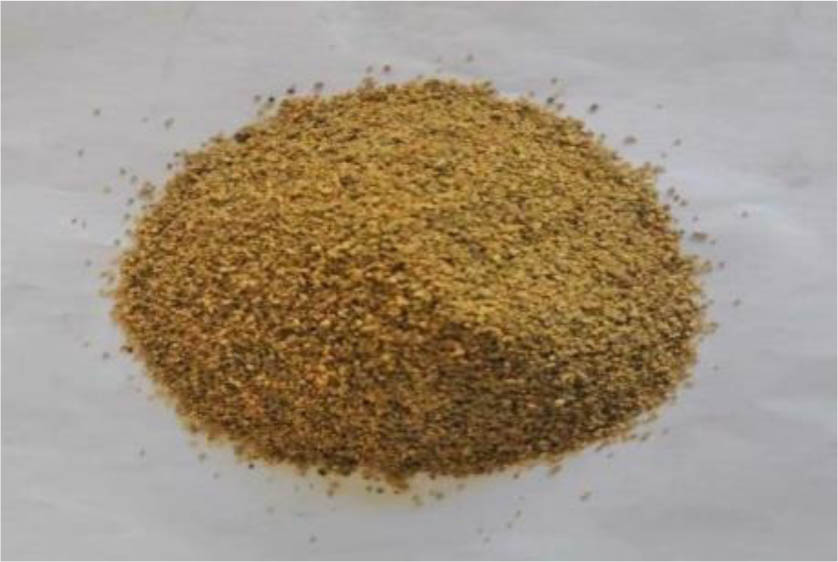
Figure 2:
Preparation process of PAC waste residue particles
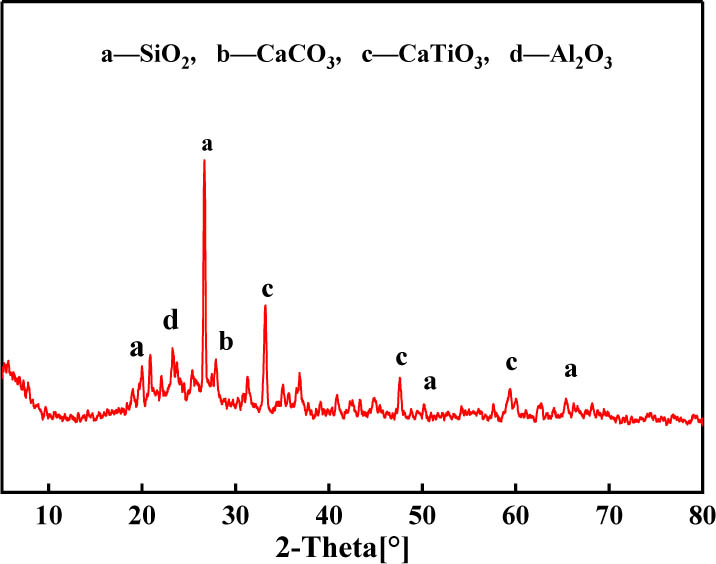
Figure 3:
XRD diffraction pattern of PAC waste residue
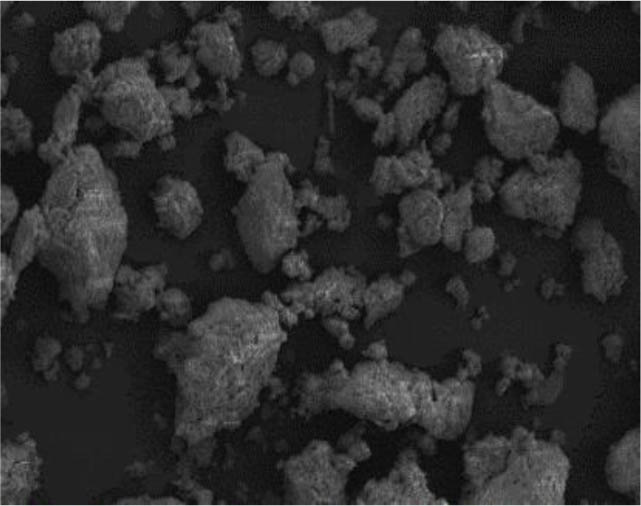
Figure 4:
Microscopic morphology of PAC waste residue
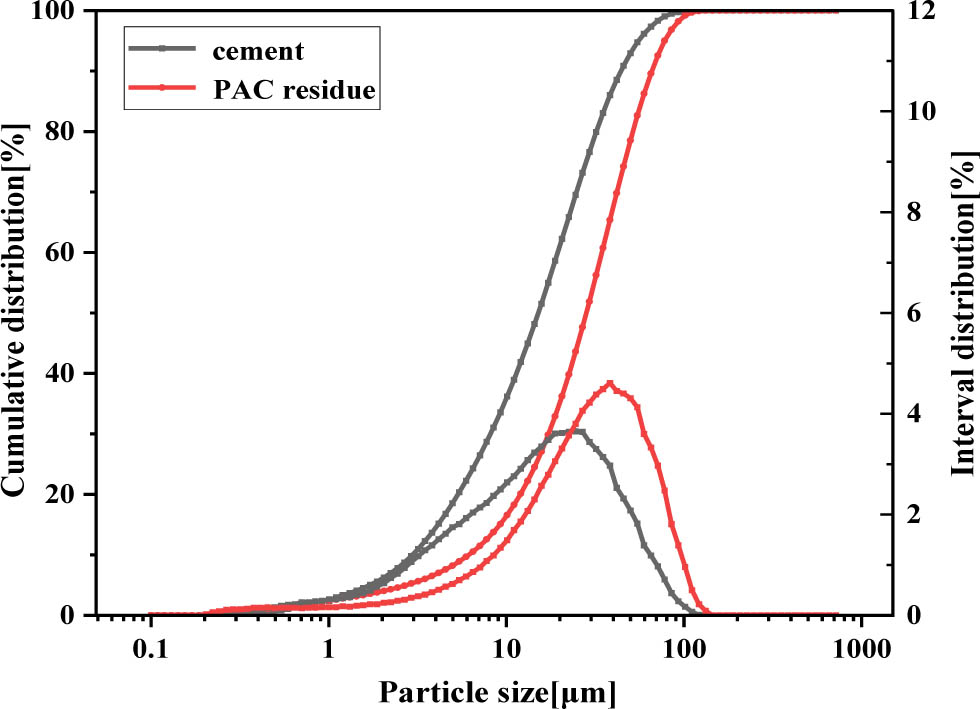
Figure 5:
Particle size distribution curves of cement and PAC waste residues
Table 1:
Mortar mix proportion
| Serial number [-] | Cement [kg/m3] | Water [kg/m3] | PAC residue [kg/m3] | Sand [kg/m3] |
|---|---|---|---|---|
| PACM0 | 402.0 | 323 | 0 | 1411 |
| PACM5 | 381.9 | 323 | 20.1 | 1411 |
| PACM0 | 361.8 | 323 | 40.2 | 1411 |
| PACM15 | 341.7 | 323 | 60.3 | 1411 |
| PACM20 | 321.6 | 323 | 80.4 | 1411 |
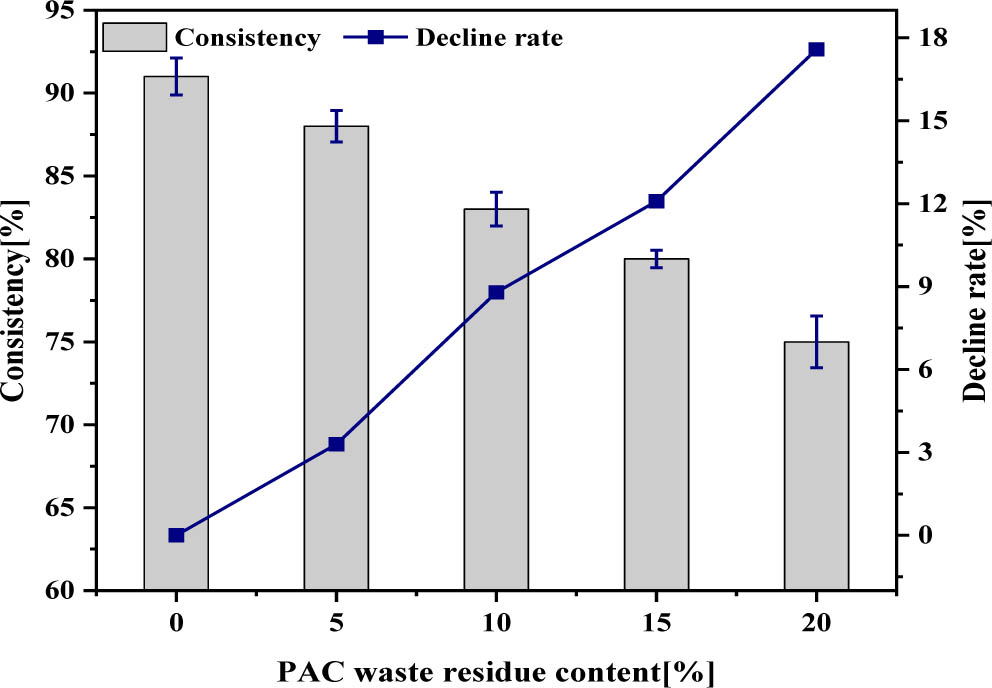
Figure 6:
Effect of PAC residue content on mortar consistency
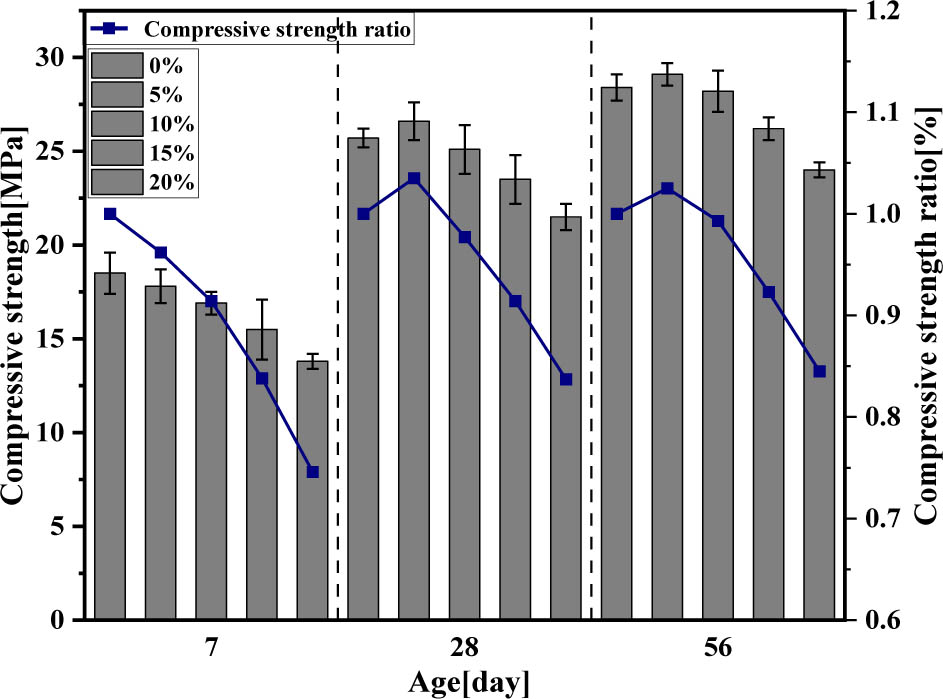
Figure 7:
Compressive strength and compressive strength ratio of mortar
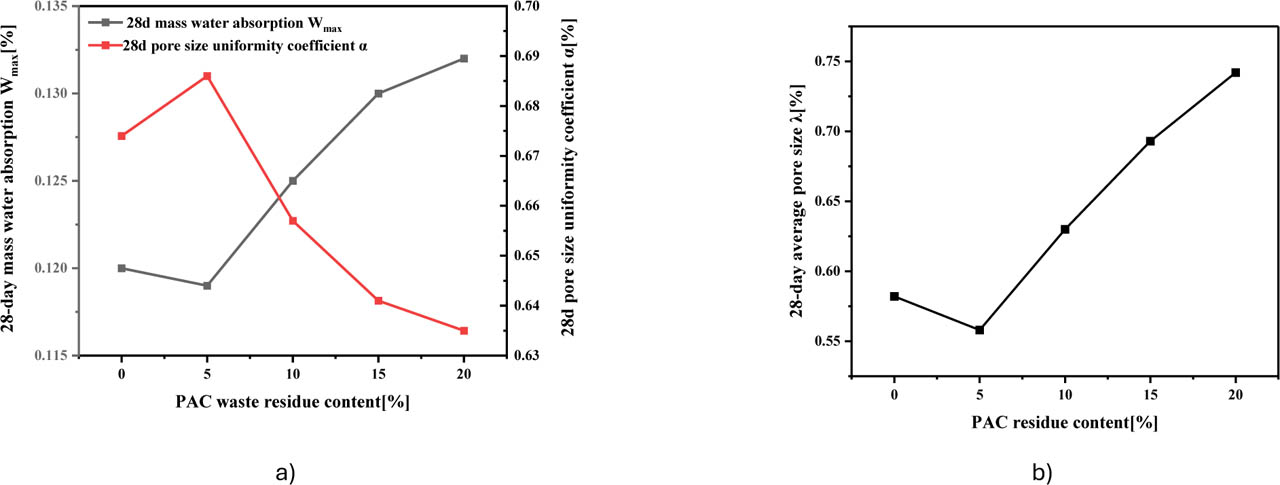
Figure 8:
Effect of PAC waste residue content on the structural parameters of mortar pores: a) 28-day mass water absorption and pore size uniformity coefficient; b) 28-day average pore size
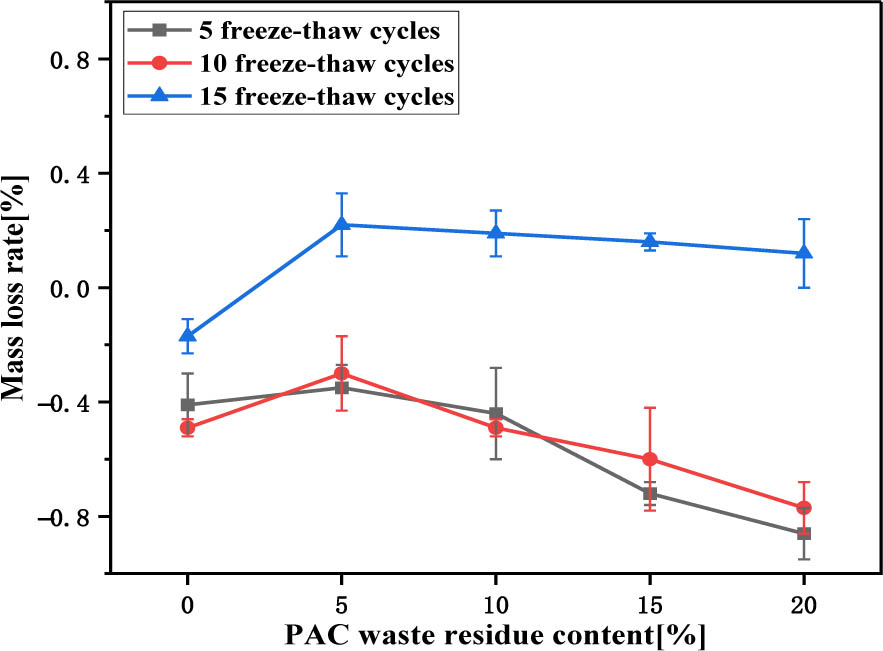
Figure 9:
Mass loss rate
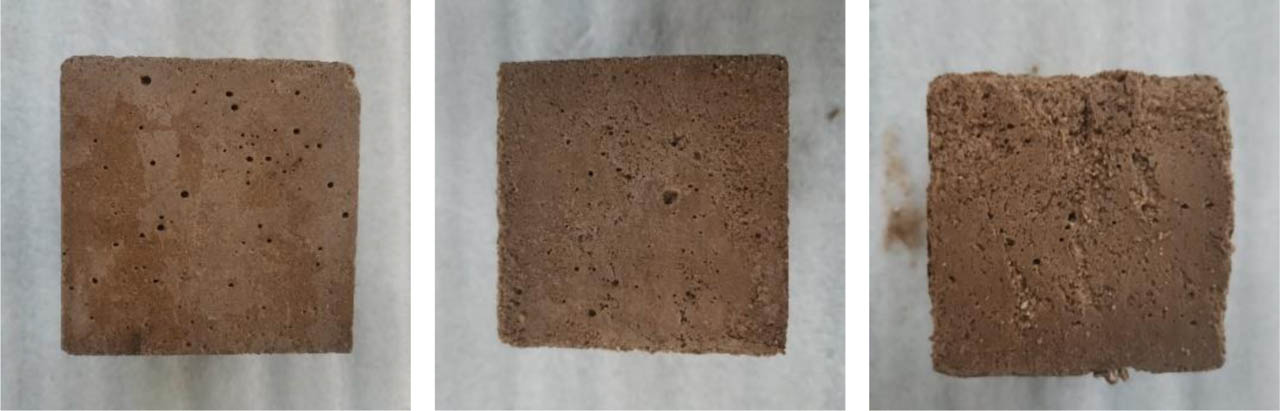
Figure 10:
Failure mode of the mortar freeze-thaw cycle test
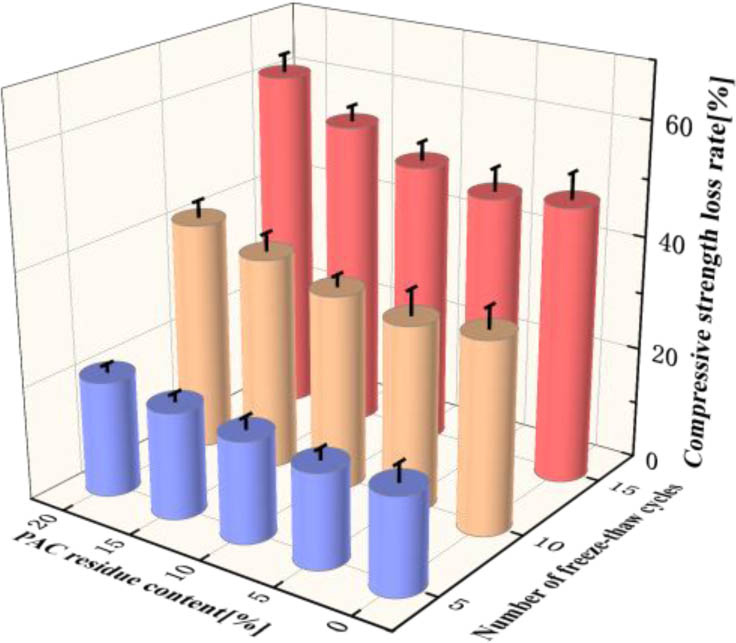
Figure 11:
Compressive strength loss rate
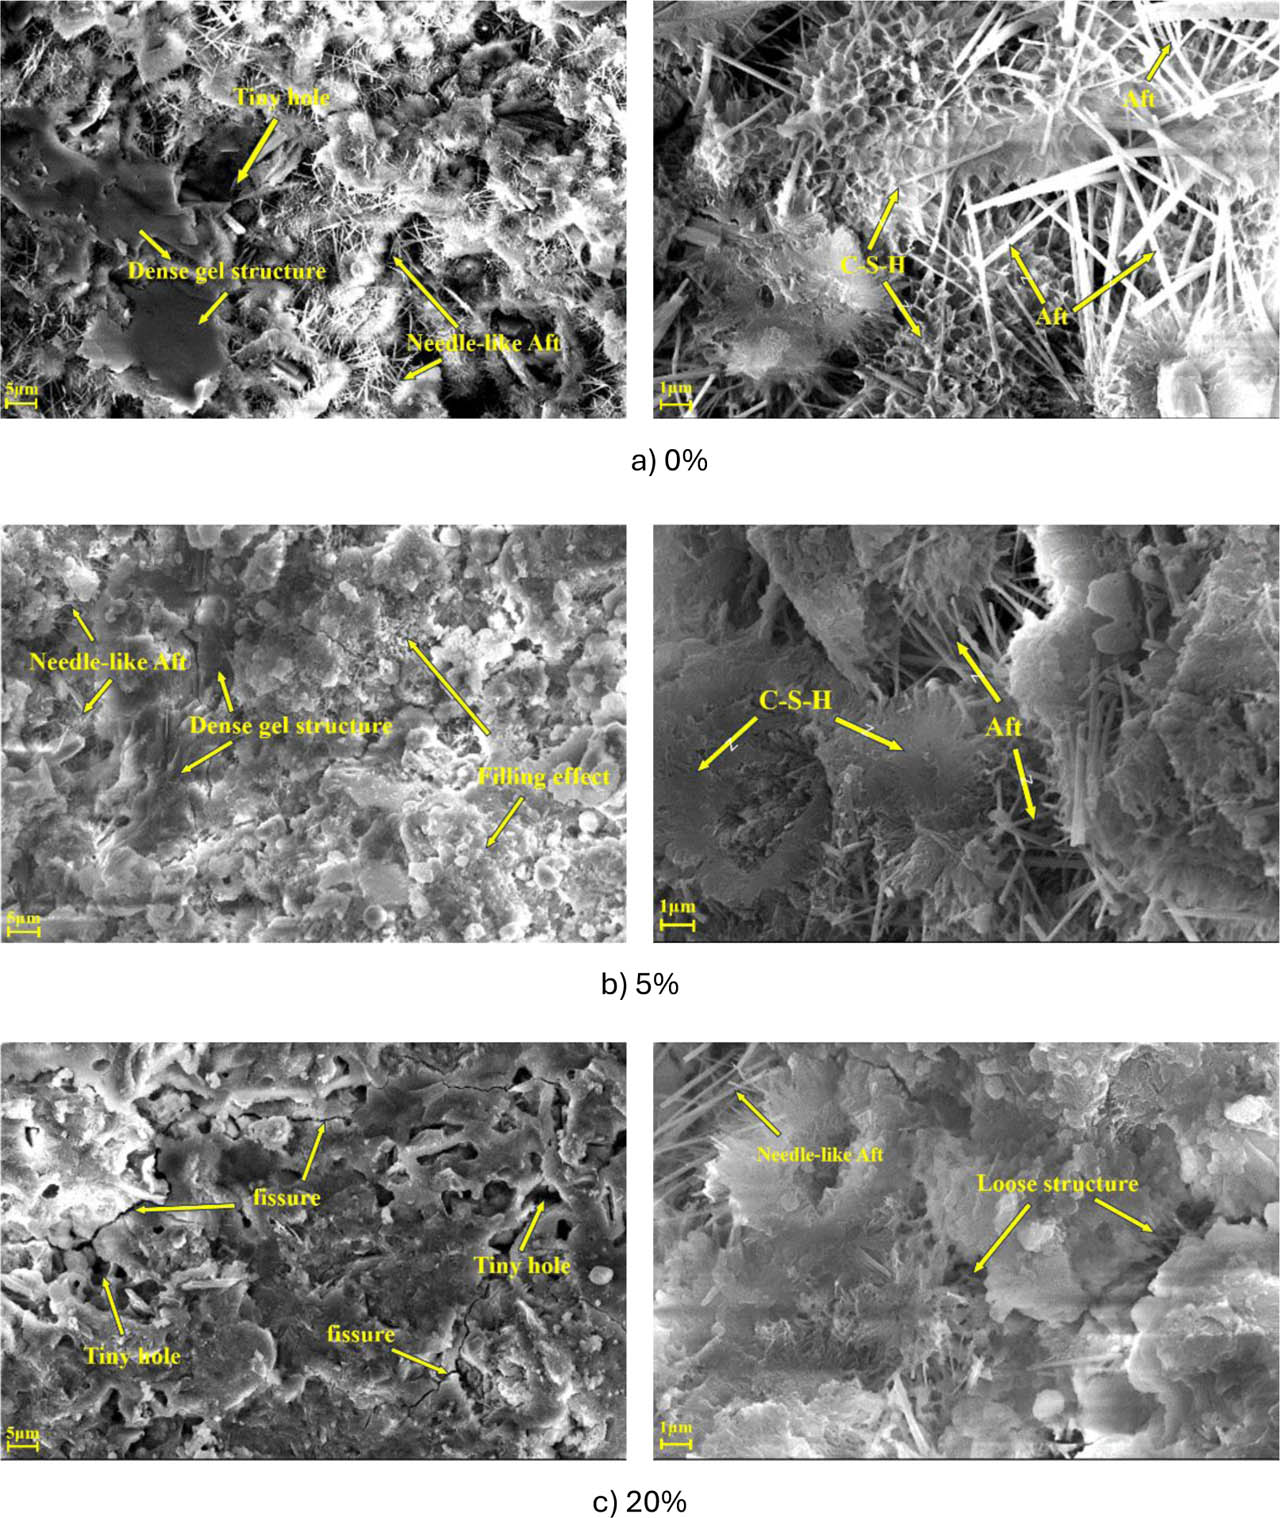
Figure 12:
Microstructure of mortar under different PAC waste residue contents