

Ensuring the safety and reliability of bridge structures is a key topic in current civil engineering, particularly in the context of the ageing infrastructure in the Czech Republic. A significant group is represented by bridges made of prefabricated prestressed elements, whose structural design and long-term operation often lead to the development of hidden defects and degradation mechanisms. These defects affect the dynamic behaviour of bridge structures and pose a considerable risk to their operational safety.
As part of solving this issue, the research focuses on combining operational modal analysis with numerical modelling to monitor changes in the modal parameters of a structure at various levels of damage. The aim is to create a sufficiently accurate computational model capable of replicating the real behaviour of bridge structures, which could be used as a tool for predictive diagnostics.
Recent studies highlight that operational modal analysis (OMA) has become an effective tool for assessing the condition of bridge structures without the need for artificial excitation. Compared to traditional static or forced vibration tests, OMA enables continuous monitoring under ambient or traffic-induced loading, which is particularly suitable for large bridges in operation (Cunha, Caetano, & Delgado, 2001; Caetano & Cunha, 2004; Hu, Caetano, & Cunha, 2013). Comprehensive reviews (Hasani & Freddi, 2023; Fu, 2025) emphasise its potential for structural health monitoring of ageing infrastructure, as well as the challenges associated with distinguishing environmental influences from actual structural damage (Komarizadehasl, Bado, & Casas, 2022).
In addition, recent advances show the integration of OMA with numerical modelling and machine learning techniques for automated damage detection and predictive diagnostics (Qiu et al., 2024; Ghosh, Suresh, & Nagarajaiah, 2025). Such approaches allow not only the identification of natural frequencies and mode shapes, but also their sensitivity to structural changes, providing a solid basis for advanced predictive maintenance strategies (Ewins, 2000; Maia & Silva, 1997; Zhang, Brincker, Andersen, & Ohlsson, 2005).
The experimental part of the research is carried out on a specific bridge structure on road I/50 in Brno, which crosses Černovičky Street (Figure 1).

Bridge on Road I/50 in Brno: a) underside view, b) installation of measuring equipment”
The bridge structure, consisting of prefabricated prestressed I-73 girders, was scheduled for reconstruction at the time of measurement. This situation made it possible to conduct measurements both under normal traffic operation and during the intentional weakening of selected structural elements. The resulting data were used to verify numerical calculations and to calibrate the model.
The numerical model of the bridge, developed in Midas Civil software, includes two variants of the structure with different levels of damage. Modal parameters are monitored for each variant, with the objective of determining their sensitivity to changes in the structural condition. The modelling results are compared with data from in-situ measurements of the real structure, ensuring the credibility of the simulations and their applicability in assessing the technical condition of similar structures.
In the initial phase, a simplified approach was adopted for modelling the load-bearing structure. The main I-section girders were modelled as BEAM elements positioned at the centroid of the cross-section. In the actual structure, the ends of the upper and lower cantilevers of adjacent girders are spaced 350 mm apart; in the model, this segment was represented by a BEAM element, which was connected on both sides using infinitely stiff elements of the elastic link – rigid type. This approach provided the necessary connection between individual girders while preserving the basic geometry of the structure (Figure 2).

Beam model assembled using rigid links
Based on a comparison of the results with experimental measurements, a different modelling approach was selected for further analysis (Section 2.2). Although the initial modelling concept allowed the simplified geometric scheme to be preserved, it also resulted in an overestimation of the overall structural stiffness, particularly in bending. In this context, the model did not represent the actual conditions with sufficient accuracy and reliability.
To simulate the dynamic response of the bridge structure, a beam-element model was created in Midas Civil (Figures 3 and 4), representing an effective compromise between computational efficiency and the required accuracy. The individual main girders were modelled as BEAM elements with defined geometric and material properties (Sections 2.3 and 2.4), including self-weight.

Axonometric view of the frame structure with supports
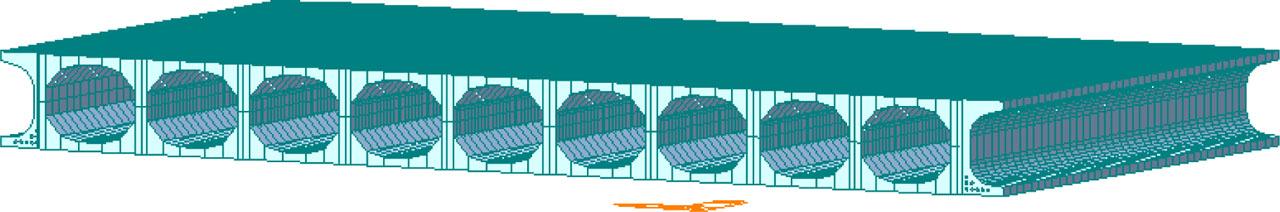
Structure displayed with cross-section thicknesses and shapes
The structure was divided into individual segments to allow for the consideration of various damage or weakening scenarios — for example, a reduction in stiffness in either the longitudinal or transverse direction.
The main girders, represented by an I-section with openings for prestressing tendons, were modelled at the top surface of the cross-section and defined to include self-weight. Zero-weight elements were used to simulate the transverse connections between individual prefabricated elements, with cross-sectional properties corresponding to the actual concrete segments in the connection areas (Figures 5 and 6).
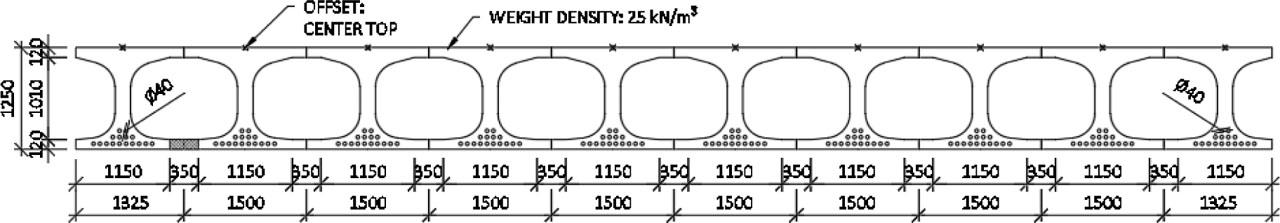
Visualization of the structure with thicknesses and cross-sections
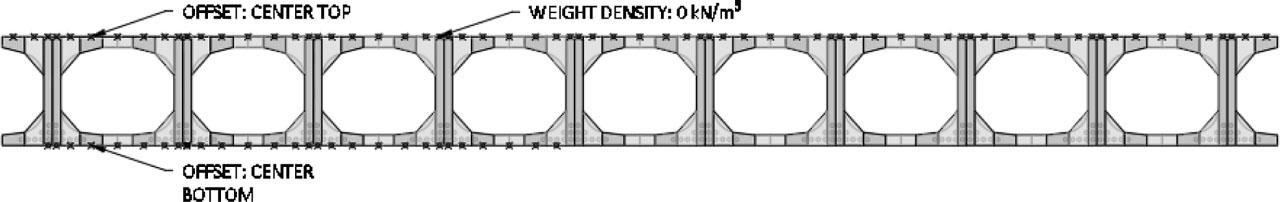
Detail of transverse link modelling
For the correct functioning of the transverse links, was used a simplified slab-wall model subjected with a unit horizontal load in both directions. Based on the resulting deformations, the moments of inertia of the individual beam connections in the final model were adjusted to ensure the appropriate spatial stiffness of the structure in the transverse direction, without the need for complex volumetric modelling of the entire bridge deck.
The prestressing reinforcement was modelled using the dedicated prestressing module within Midas Civil, where the individual tendons were defined by the coordinates of the prestressing cables (Figure 7) and subsequently assigned to the corresponding girders. The prestressing force was defined through a stress value, which was assumed constant over the entire tendon length.

Position of the prestressing reinforcement
The plan layout of the bridge is set at an angle, with the supports designed as point bearings on individual girders. On one abutment, a fixed bearing was considered, while on the opposite side, movement in the x-direction – that is, in the longitudinal direction of the structure – was allowed (Figure 3). The distance between the end points of the girders is 27 m.
The geometry of the girder’s cross-section is based on archival documentation (Figure 8a). The section without hinged joints is considered to have a height of 1250 mm and a width of 1150 mm. The bottom flange of the girder contains 16 openings for cable ducts. Prestressing effects are accounted for in the model by applying a specified stress, while the mass of the grouting material and the self-weight of the tendons themselves are included in the calculation as a line load. The model also incorporates loads from the weight of the pavement, bridge deck waterproofing, and parapet guardrails.
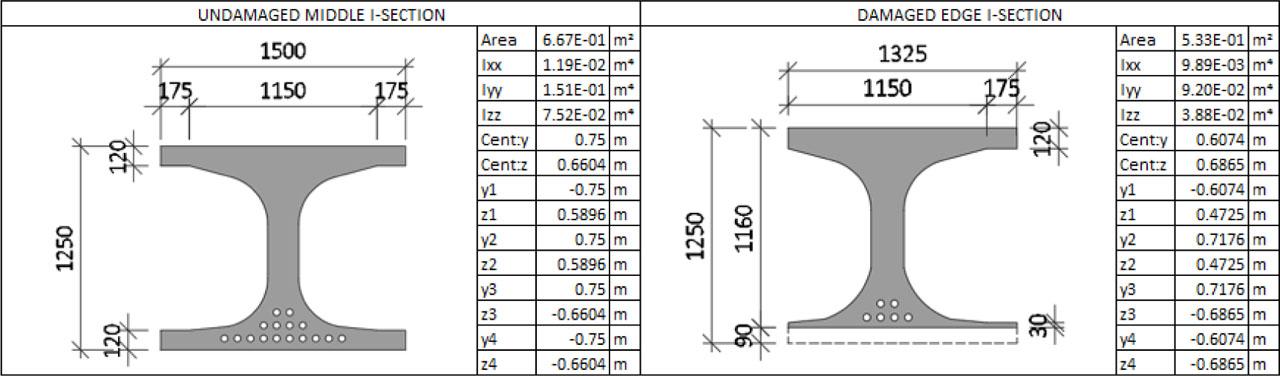
Cross-sectional properties: a) full section, b) weakened section
To achieve a reduction in structural capacity and modified behaviour in the dynamic analysis, the main girder was modified by reducing the height of the bottom flange and removing the lower row of prestressing ducts along the entire girder length (Figure 8b). The change in cross-sectional properties corresponds to the simulated real-world damage of the actual structure observed during experimental verification (Section 3). The modified cross-section was applied only to selected segments of the girder corresponding to the actual damage locations, approximately at one-third of the span. In these segments, the cross-section of the transverse connections in the bottom flange was also weakened accordingly in the computational model.
The material properties were adopted from previous diagnostic surveys of similar types of structures. The concrete class of the girder is C30/37 (Table 1).
Material properties – concrete
| BEAM (C30/37) | Property | Value [−] |
|---|---|---|
| Modul of elasticity | E | 38,5 GPa |
| Compressive strength | fck | 30 MPa |
| Tensile strength | fctm | 2,9 MPa |
| Unit weight | γ | 25,5 kN/m3 |
| Poisson’s ratio | ѵ | 0,2 |
The girder contains a total of 16 prestressing strand tendons, each consisting of 20 parallel strands with a diameter of 4.5 mm (Table 2).
Material characteristics – prestressing reinforcement
| PRESTRESSING CABLES | Property | Value [−] |
|---|---|---|
| Modul of elasticity | E | 190 GPa |
| Ultimate tensile strength | ϭp | 1130 MPa |
| Strand area | Ap1 | 15,9*10−6 m2 |
| Unit weight | γ | 25,5 kN/m3 |
| Poisson’s ratio | ѵ | 0,3 |
As part of the TAČR research project, dynamic measurements were carried out on a real bridge structure located within the built-up area of the city of Brno, on road I/50 (Figure 1b). The objective was to monitor changes in the modal parameters of the structure, particularly its natural frequencies, as a result of simulated damage.
The bridge was tested in two conditions: first in original (undamaged) state, and then after intentional damage had been carried out at a total of four locations (Figures 8–10). Specifically, it involved cutting the bottom row of prestressing tendons at both edge girders. The dynamic response was recorded during controlled excitation, achieved by driving a heavy truck over an artificial road hump (Figure 12).

Location of intentional damage (marked in red)

Damage to the edge girders before next measurement
For the purposes of dynamic measurement, Seika B1 capacitive accelerometers were used in combination with a QuantumX data acquisition unit (Figure 11a). The Seika B1 sensors (Figure 11b) are high-stability capacitive accelerometers designed for precise dynamic measurements. Owing to their integrated gas damping, they achieve low noise levels and minimise the occurrence of resonances, making them ideal for monitoring vibrations and seismic phenomena.

Bridge measurements: a) placement of measuring equipment, b) Seika B1 accelerometer
These sensors allow acceleration measurements within a range of ±3 g (approximately ±30 m/s2) with very fine resolution below 0.001 g. They capture frequencies in the range of 0 to 160 Hz and operate reliably across a wide temperature range from − 40 °C to +85 °C. For measurements on the bridge structure, the sensors were magnetically mounted directly onto the steel components of the arch and the deck girders, ensuring a tight and precise mounting.
Data collection was carried out using a QuantumX data logger, which enables multi-channel sensing in real time. The unit used was equipped with eight channels, each capable of sampling at rates of up to 19.2 kHz per channel. Data collection was managed via the CatmanEasy software, which ensured measurement synchronisation and control.
A major advantage of this measurement setup is the ability to perform monitoring under normal traffic conditions without any intervention in the structure itself. The sensors are magnetically mounted onto steel plates that are securely fixed to the bridge in advance (Figure 11b). This solution is time-efficient, easy to install, and non-intrusive to the diagnosed structure.
For frequency-domain evaluation, operational modal analysis (OMA) was employed. OMA is a method for the experimental determination of a structure’s modal parameters – mode shapes, natural frequencies, and damping. The modal parameters are determined under normal operating conditions, with the excitation forces acting on the structure being unknown. This method provides information about the modal characteristics of the structure under actual boundary conditions and the actual loading level.
Since the excitation forces acting on the structure are not known or recorded, OMA algorithms for determining modal characteristics operate solely with the measured structural response. It is assumed that the excitation forces can be represented as Gaussian white noise with zero mean, meaning the excitation is broadband and all modes are activated during excitation. This assumption is not explicitly verified during measurement.
Two fundamental approaches to modal parameter identification differ in the domain in which they operate: subspace identification (SSI) works in the time domain, whereas frequency domain decomposition (FDD) operates in the frequency domain.
The FDD method is based on expressing the equation of motion using convolution. It operates on the signal after a Fourier transform, from which the power spectral density (PSD) is determined. The PSD matrix is square and consists of auto-spectra on the diagonal and cross-spectra off the diagonal. The matrix dimension m corresponds to the number of sensors used.
Natural frequencies are identified from resonance peaks in the PSD plots, which leads to the task of locating maxima in m2 plots. This task is solved by singular value decomposition (SVD) of the PSD matrix into singular values and singular vectors. The natural frequencies are then given by peaks in the singular-value plots, and the corresponding mode shape is the singular vector associated with the given singular value.
Extended variants of the FDD method further account for the fact that resonance may involve multiple modes with closely spaced frequencies around the resonant peak in the singular-value plot. These vectors can be identified based on their mutual similarity (MAC values indicating linear dependence). The determined natural frequencies and mode shapes are then expressed as a weighted average of singular values and vectors with a MAC value greater than the selected threshold.
The truck crossings (Figure 12) were carried out at three different speeds (20, 33, and 40 km/h). It was found that the lower speed (20 km/h) resonates more effectively with the first bending frequency of the bridge (~4 Hz), leading to pronounced excitation of this mode. In contrast, the higher-speed crossings (40 km/h) are more suitable for exciting higher-order vibration modes. An example of the measured acceleration record during the crossings (Figure 13a).

Truck crossing
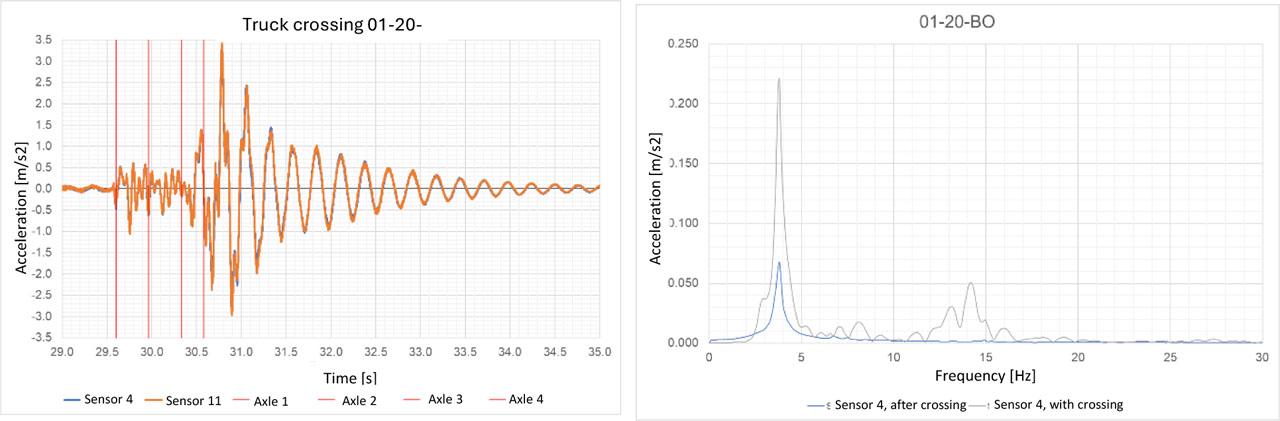
Excitation at L/2 on the left side: a) acceleration record, b) frequency spectrum
Based on the measured data, the first four natural vibration modes of the bridge were identified – the first and second bending modes and two torsional modes. For comparison, the structural states before damage and after the intentional weakening of the girders were evaluated. The measured natural frequencies for the first bending mode ranged from 3.809 Hz in the undamaged structure to 3.735 Hz in the damaged structure (Figure 13b). The slight decrease in natural frequency indicates the effect of the bridge damage.
These measurements confirmed that the correct selection of crossing location and speed has a significant impact on the quality of the acquired data and enables the effective detection of even relatively small changes in the structural stiffness.
The intentional damage to the bridge resulted in a reduction in the stiffness of the edge girders and, consequently, in the expected change of the modal parameters – the natural frequencies. For the undamaged structure, the first natural frequency was determined as 3.78 Hz (Table 3). This value, obtained from measurements and confirmed by the simplified numerical model, shows good agreement between the experimental and computational approaches.
Frequencies of the undamaged structure
| Frequency | Measured [Hz] | Midas Civil [Hz] |
|---|---|---|
| f1 | 3,78 | 3,78 |
| f2 | 6,87 | 4,98 |
| f3 | 7,98 | 11,01 |
| f4 | 9,20 | 13,71 |
The first natural mode (f1) is a bending mode, and the model shows exact agreement with the measured data (Table 3). The second mode (f2) corresponds to a torsional mode, for which the model predicts a lower frequency than that measured. The third mode (f3) represents horizontal (lateral) vibration, while the fourth mode (f4) is the second vertical bending mode. In this case, the difference between the model and reality is noticeable, suggesting that the computational model could be further refined. However, comparing the first natural frequency already provides a basis for the preliminary conclusions presented below.
After the structure was intentionally weakened, the first natural frequency dropped to 3.72 Hz (Table 4). Although this represents a relatively small reduction, it is fully consistent with the theoretical assumption that a partial loss of prestressing tendons leads to a reduction in the global stiffness of the structure and, consequently, to a decrease in its resonant frequency.
Frequencies of the damaged structure
| Frequency | Measured [Hz] | Midas Civil [Hz] |
|---|---|---|
| f1 | 3,72 | 3,66 |
| f2 | 6,62 | 4,57 |
| f3 | 7,63 | 8,91 |
| f4 | 8,86 | 12,99 |
The results indicate that even local reductions in the stiffness of prefabricated girders and prestressing tendons can manifest in the modal parameters of the structure in a way that is both measurable and comparable with computational models. It should be noted, however, that the numerical model assumes that damage results in a complete loss of prestressing along the entire length of the affected tendons, without accounting for potential degradation of the grouting material or the gradual reduction of prestressing effects due to corrosion.
Furthermore, the results show that the first natural frequency (f1) was predicted with complete accuracy (3.78 Hz), demonstrating that the basic global bending stiffness of the computational model was set correctly. For higher natural frequencies, however, significant discrepancies were observed – the second mode (f2) was notably underestimated, while the third (f3) and fourth (f4) modes were overestimated.
Such differences between measured and modelled results could be caused by multiple factors, including structural detailing effects — for example, the connections between prefabricated elements, the actual thickness of structural components, and other local irregularities. A similar discrepancy between real measurements and numerical modelling was also reported in, where the authors noted that higher-order modes are often not well captured in numerical models due to the simplified representation of connection details and structural geometry.
The partial loss of prestressing resulted in only a slight decrease of the first natural frequency, whereas higher modes were more strongly affected and demonstrated greater sensitivity to local stiffness changes. For diagnostic purposes, monitoring higher or asymmetric mode shapes is therefore more suitable for detecting early stages of structural degradation. The transverse stiffness and modelling of girder connections also play a crucial role, as they predominantly influence torsional and lateral vibrations rather than vertical bending alone. Incorporating these effects into the numerical model can significantly improve agreement with experimental measurements and enhance the sensitivity to local damage.
Regarding the weakening of the prestressing tendons in terms of physical damage to the structure, it should be noted that the bridge consists of ten precast girders. Each girder contains 16 prestressing steel ducts, with each duct contains 20 strands of 15.9 mm2 cross-sectional area. In the damage scenario, the bottom row of strands was cut, so that the affected girder was effectively prestressed by only 6 of the original 16 steel ducts. As a result, the prestressing force in the individual girder was reduced by 62,6%. At the level of the entire bridge system, where only two edge girders were weakened, the total prestressing force decreased by just 12.5%. Importantly, the main central girders – carrying most of the traffic load – were not impaired.
The numerical model was developed under the assumption of the most unfavourable scenario, namely that the grout in the prestressing ducts had completely lost its function and the prestress was eliminated along the full tendon length. In practice, the actual condition may differ; however, this damage scenario was selected to reflect the real circumstances of the reconstruction, which focused primarily on the edge girders.
This analysis confirms that even simplified damage scenarios can provide valuable insights into the sensitivity of modal parameters and highlight the need for accurate modelling of structural details.
This analysis confirms that even simplified damage scenarios can provide valuable insights into the sensitivity of modal parameters, highlighting the need for accurate modelling of structural details, while also demonstrating that partial loss of prestressing, although not critical for global stability, leaves a measurable trace in higher modes that makes them a key indicator for early diagnostics.
This paper presented experimental and numerical research on changes in the modal parameters of bridge structures composed of precast prestressed girders. Operational modal analysis under real traffic conditions proved effective for detecting stiffness changes without requiring any intervention in the structure, making it suitable for long-term bridge monitoring.
The intentional damage introduced into the bridge resulted in measurable changes in modal parameters: the first natural frequency decreased only a slight decrease from 3.78 to 3.72 Hz, while higher modes showed more significant deviations, confirming their greater sensitivity to local stiffness reductions. This demonstrates that higher and asymmetric modes are the most reliable indicators for early detection of structural degradation.
Numerical modelling showed a high degree of agreement with the measured data for the first mode, but discrepancies in higher modes underline the importance of incorporating realistic detailing, particularly transverse connections between girders. Refining these aspects improves the predictive accuracy of computational models and enhances their ability to capture the effects of local damage.
The combination of operational modal analysis with numerical simulation has proven effective and represents a useful tool for predictive diagnostics of bridge structures. Future work will focus on refining the models, particularly in terms of detailed modelling of structural connections and the use of harmonic analysis, to improve the accuracy and reliability of this approach for practical bridge assessment.