

1. Introduction
Water is a fundamental need for an acceptable quality of life, since access to clean and sufficient drinking water is crucial for human growth, health, and institutional development (Adedoja et al., 2021; Kefyalew, 2018). The modelling of water supply systems has emerged as an essential instrument for engineering decision-making, enhancing network design, operating dependability, and productivity (Romano et al., 2014). Given that water distribution systems are often built for extended operation. it is essential to evaluate future determinants such as demographic expansion, infrastructure enhancement requirements, pipe specifications, and pumping capacity (Gemici et al., 2015). Performance assessment, defined as any methodology that facilitates the evaluation of a process's efficiency or effectiveness using performance metrics, is therefore essential for long-term sustainability (Desta & Befkadu, 2020; Muranho et al., 2014).
Pressure and Velocity critical metrics for assessing distribution system performance, since transient situations with variable pressures and velocities can damage pipes and equipment or interrupt service under low-pressure scenarios (Ghorbanian et al., 2016). Water distribution system (WDS) losses are often classified into actual losses, resulting from leaks, pipe cracks, or joint failures, and apparent losses, due to meter errors or illegal usage (Dai, 2021; Puust et al., 2010). To tackle these issues, many software tools for network modelling have been created, such as EPANET, LOOP and WaterCAD; however, WaterGEMS exhibits enhanced capabilities and is extensively used in performance assessment studies (Nazari & Meisami, 2008). Yuliandra et al. conducted research in West Sumatra, Indonesia, to determine the operational effectiveness of the urban water delivery systems in flood risk settings through the application of Fuzzy Delphi Method (FDM) and thematic analysis. The studies looked at procedural, structural, and organizational signals of system efficiency and persistence during an emergency, promoting the realization of water safety plans and early warning systems as well as the strengthening of institutional and regulatory frameworks to enhance the resilience of networks. (Yuliandra et al., 2024).
Previous study has shown the effectiveness of using hydraulic models with field calibration to assess the efficiency of water networks across different locations Within those studies. Berhane and Aregaw developed a hydraulic model for the water distribution network in Wukro, Ethiopia, using WaterGEMS. The highest pressure before to optimization was 31.1 m, which increased to 38.1 m after improvements, while the lowest pressure during peak hours grew from 7.9 m to 16 m. The study concluded that the Water GEMS model provides an effective method for improving water distribution networks (Berhane & Aregaw, 2020). Beker and Kansal evaluated the hydraulic efficiency of the water distribution network in the first zone of Dire Dawa, Ethiopia, using WaterGEMS V8i. The results suggested that certain locations had elevated pressure, perhaps resulting in water leakage, while the pipe velocities were inadequate. The study determined that improvements, including the installation of pressure control valves and alterations to major pipe sizes, may improve the hydraulic performance of the network (Beker & Kansal, 2021). Pantelis et al. assert that a dependable hydraulic model may be established in Farsala, Greece, despite limited data availability, by using AutoCAD, GIS, field surveys, and SCADA data with WaterGEMS. Their results indicated that a calibrated and verified model offers significant assistance in decision-making related to network enhancements, leakage management, and intelligent infrastructure design. (Sidiropoulos et al., 2025).
In another study Rushikesh evaluated the water distribution network in Nanded, India, to resolve pressure and discharge issues, especially at the system extremities. The study used WaterGEMS, an advanced hydraulic modeling software, along with the Darwin Designer module to simulate pipes and nodes and optimize diameters within hydraulic parameters. The findings showed the effectiveness of WaterGEMS in enhancing hydraulic performance of the network, and achieving favorable pressures at nearly all nodes, with limitations at a few outside points, illustrating its significance as a dependable tool for sustainable water distribution network management (Yennawar, 2024). Awad et al. demonstrated that WaterGEMS and Microsoft Excel were excellent tools for establishing and assessing sustainable water distribution networks in their research done in Bernolákovo, Slovakia. Their findings demonstrated that the suggested system could provide high-quality drinking water in the necessary volume while reducing operational issues and costly (Awad et al., 2025).
Alaa Nabil created a hydraulic model for the water distribution network of the Egyptian Media Production City (EMPC) using WaterGEMS. The model was calibrated with 12 nodes and validated with an additional 8 nodes. simulations demonstrated inconsistent performance: whereas average demand secured supply, hardly 50 percent of the network sustained sufficient pressure. During peak demand, shortages arose from restricted reservoir capacity, the proposed methods enhanced pressure equilibrium, elevating pressures in 70% of the network, decreasing in 15%, and maintaining constancy in 15%, thereby guaranteeing a dependable and sustainable water supply (El-HAZEK et al., 2025). Hussein conducted an investigation of the principal water transmission line in the city of Karbala in Iraq using WaterCAD software. The study is based on field data and their calibration throughout many seasons to ensure the accuracy of the hydraulic modelling results. The findings revealed that the actual pumping capacity (about 950 m3/h) is less than the intended capacity (1200 m3/h), leading to reduced pressure and velocity in the terminal zones. The study concluded that the design capacity has to be increased to 2000 m3/h and that the current pumps should be replaced, emphasizing that field calibration is crucial for ensuring the reliability of hydraulic analysis and enhancing network efficiency (Hussein et al., 2021).
Kadhim et al. evaluated the water distribution network in the Karada region of Baghdad, Iraq, using Bentley WaterGEMS and GIS technology. Pressure and flow data were evaluated based on an average daily use of 350 litters per capita. The results demonstrated that flow velocities were adequate, while water pressures ranged from 0.7 to 2.2 bar, maintaining within acceptable parameters for maximum network efficiency, the investigation stated that the network exhibited hydraulic effectiveness and that computational modelling methods are beneficial for evaluating and improving water distribution systems (Kadhim et al., 2021).
Abdulrahman et al. investigated the water supply and distribution system in Baghdad, Iraq, using ArcMap 10.8 and WaterGEMS CONNECT Edition, calibrating the model according to flow and pressure data at designated locations. The results indicated pressures between 8 and 21 mH2O, accompanied by a correlation coefficient of 0.988, while the velocities in the main pipe remained within allowed parameters (0.5–2 m/s). Increased velocities were observed in secondary pipes as a result of less consumption (Abdulsamad & Abdulrazzaq, 2022).
Al-Mousawey developed the model and assessed the hydraulic characteristics and residual chlorine levels in the water distribution system of Najaf city, Iraq. Using WaterGEMS, the investigation included both field and laboratory studies to validate the model, revealing significant alignment between observed and predicted values. The simulation indicated that pumping units were unable to meet peak demand, resulting to pressure losses ranging from 0.2 to 2.1 bar. The study confirmed that water network modelling is an effective method for understanding network efficiency and improving water supply quality (Al-Mousawey & Abed, 2022).
Zahraa et al. conducted research to evaluate the turbidity behavior within the Al-Saray water distribution network in the Najaf Governorate, which was conducted using the PODDS model. The study investigated how daily flow rates and consumption patterns impact water quality in the network. What was discovered was that as a result of augmented flows, shear stress and mobilization of deposits in the pipes increased, thereby causing an enhancement in the turbidity levels. The importance of this study lies in its use of numerical simulation as an effective tool to predict the behavior of networks and associate it with the efficiency of operation and service quality (Abed et al., 2024).
Mahomed et al created a hydraulic model for the water distribution network of Tikrit City, Iraq, using WaterGEMS. The model attained elevated calibration and validation accuracy (R2 = 0.97, NSE = 0.93). Findings revealed that 26% of the nodes saw pressures below the stipulated 1.4 bar at peak demand, but 77% of the pipes exhibited velocities under the advised 0.3 m/s. These conditions limit the hydraulic efficiency of the network, resulting in silt build up and adversely affecting water quality and supply dependability (Mohammed & Mohammed-Ali, 2025).
Although advancements in water network management are being made, there is a thorough evaluation of water distribution systems. The present study aims to evaluate the performance of the water distribution network in Muhandisin Al-Nidal in Karbala, Iraq, by hydraulic modelling and field calibration, evaluating pressures and flows, and recommending evidence-based options to enhance network efficiency and ensure long-term sustainability.
2. Methodology
2.1. Study Area Description
The Muhandisin Al-Nidal district is located in the geographic coordinates (32.5893435 N, 43.9778961 E) in the northwest section of Karbala's city centre, as shown in Figure 1. The district has an area of around 0.73 square kilometers. Muhandisin Al-Nidal now has a population of 1,554 residents, representing 20% of the district's total population. The estimate will be based on the number of developed housing units and the typical household size in the region, which is 6 persons according to the local water authority.
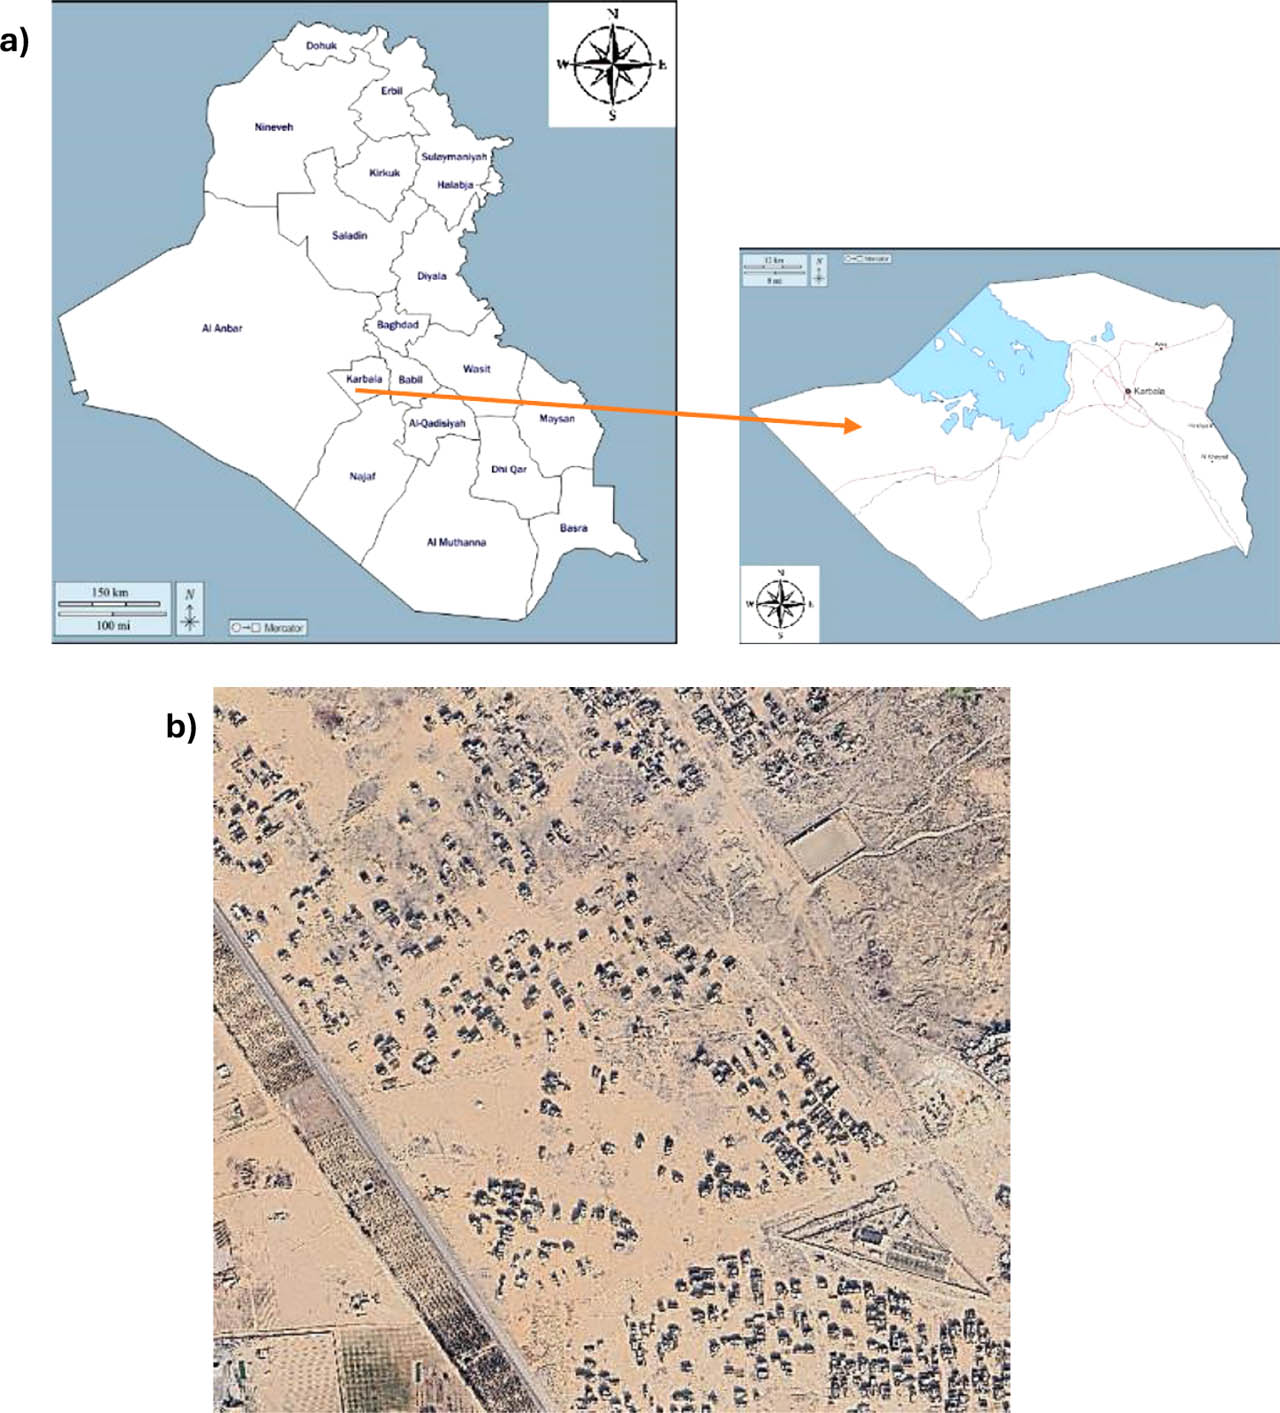
Figure 1:
Location and Arial map of Muhandisin Al-Nidal neighborhood, Karbala City: a) Map of Karbala governorate location; (b) Arial map of Muhandisin Al-Nidal neighborhood
2.2. Study Structure
The study's structure, which presents the theoretical order used to achieve the research objectives, is depicted in Figure 2. Data collection, network digitization, field data recording, model calibration, model validation, and results analysis are the six main steps of the study's structure. This methodical process ensures the creation of an accurate hydraulic model for the water distribution network.
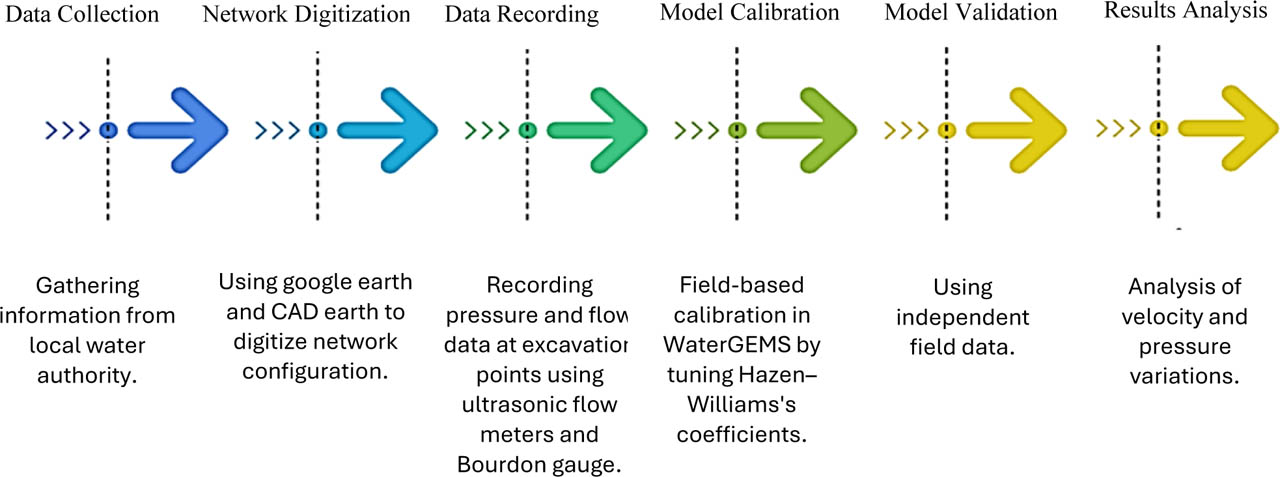
Figure 2:
General structure of the study
2.3. Data Collection
The data detailing the layout of the water network was acquired from the Karbala Water Directorate. The elevation data of the study area was accurately obtained by using Google Earth Pro and CAD Earth tools, enabling exact geographical and hydraulic evaluation the materials (e.g., instruments, software) and procedures used during the study.
2.4. Network Description
In 2023, a new water distribution network was established to service the Muhandisin Al-Nidal district as a component of Karbala's current infrastructural enhancement initiatives. The Muhandisin Al-Nidal district receives intermittent water supply, with water pumped twice daily during high demand periods according to a fixed timetable overseen by the Karbala Water Directorate. The three principal pipe diameters in the network are 225 mm, 160 mm, and 110 mm (Figure 3). The 225 mm pipelines, spanning 3,158m in length, are the primary transmission line and constitute the system's outer loop. The 160 mm pipes of the secondary distribution lines extend about 4,040 m. The system of internal distribution, utilizing 110 mm pipes, extends roughly 16,098 m across the residential area.
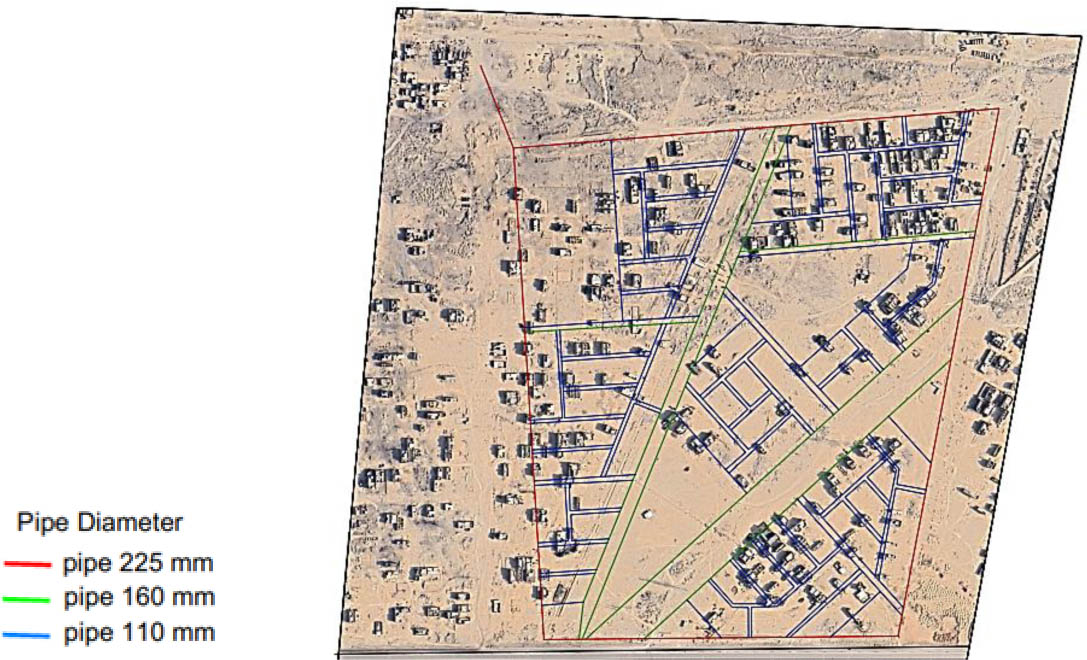
Figure 3:
Arial map of water distribution network layout
2.5. WaterGEMS Software
WaterGEMS is a software program developed for the simulation of hydraulics and water quality, particularly built for water distribution systems. The program enables engineers to proficiently study, design, and optimize water distribution networks, in addition to assessing energy usage, fire flow, water quality parameters, and overall operating expenses. WaterGEMS enables the simultaneous management of several forms of infrastructure and system-related data to improve decision-making and operational strategies for water utilities (Walski et al., 2003).
2.6. Field Work
Systematic fieldwork was conducted to allow proper data compilation on the establishment of the hydraulic model, where pressure and flow rates were the key characteristics. The methodology of the fieldwork can be summarized as follows:
Pipe Detection: Pipelines were identified at seventeen excavation places.
Pressure Data Collection: Bourdon gauges were placed, and the acquired pressure data are depicted in Figure 4.
Flow Data Collection: EUROSONIC 2000 ultrasonic flow meters were fitted to monitor regularly, as depicted in Figure 5.
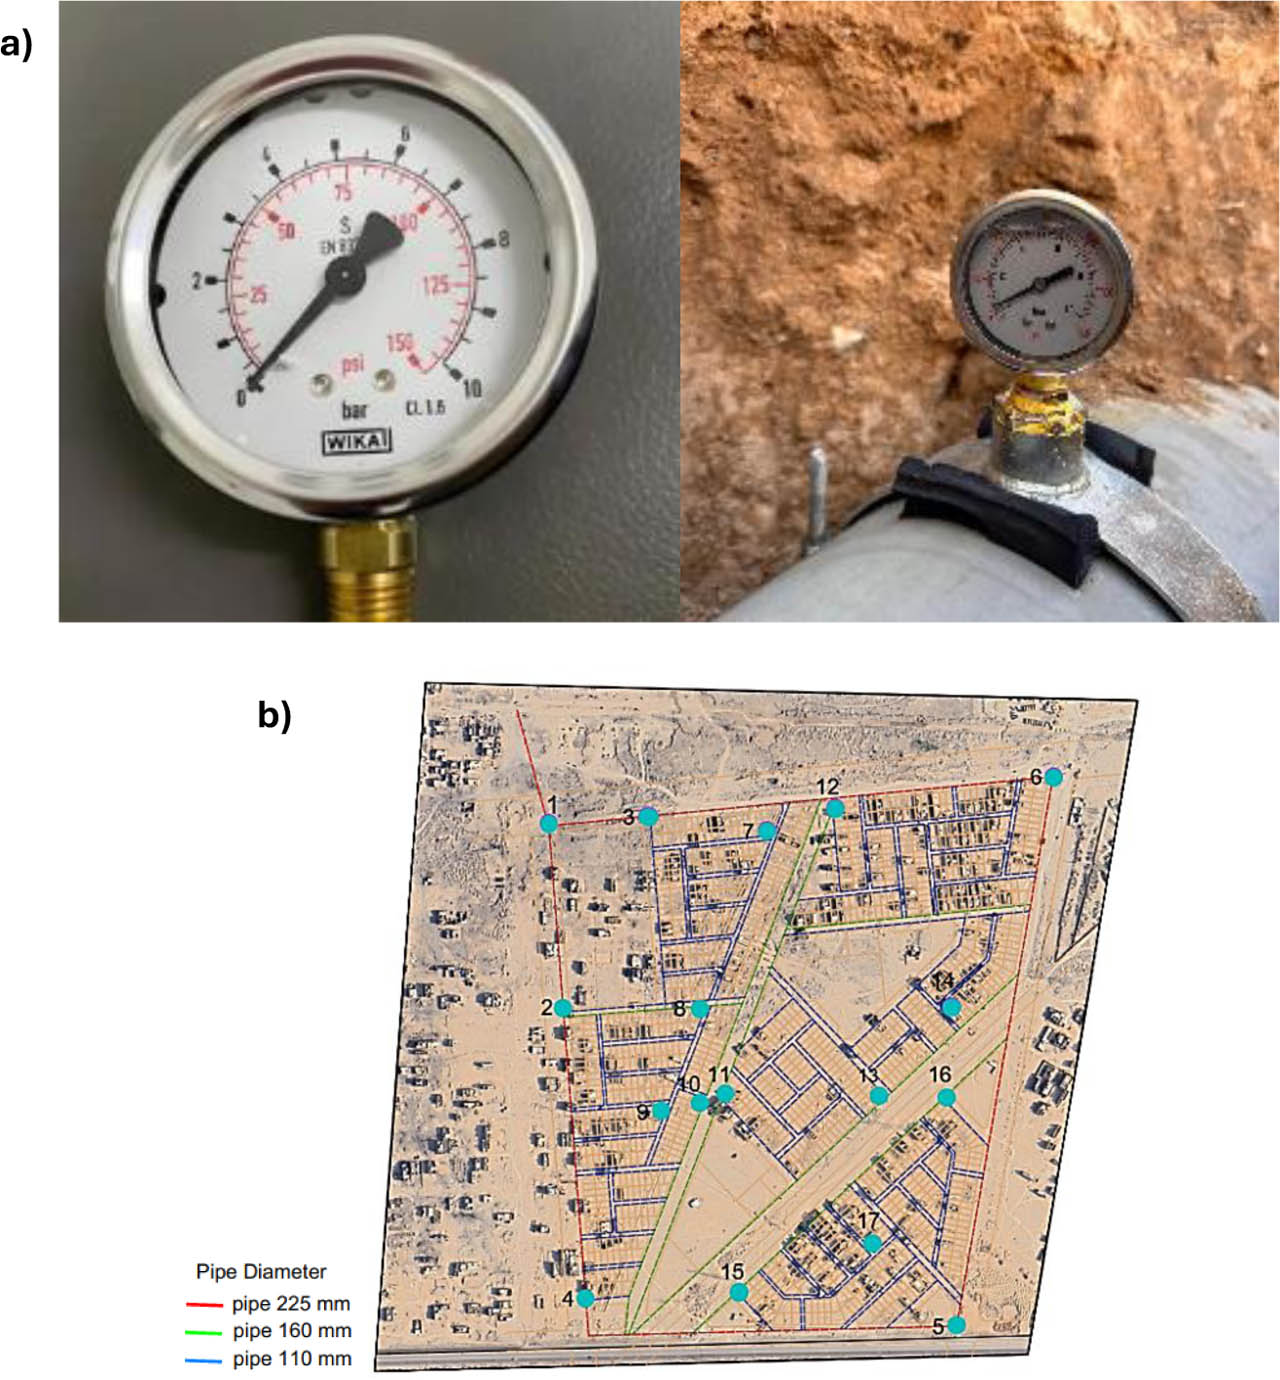
Figure 4:
Pressure measurement: a) Device used to measure water pressure; b) Location of measured points
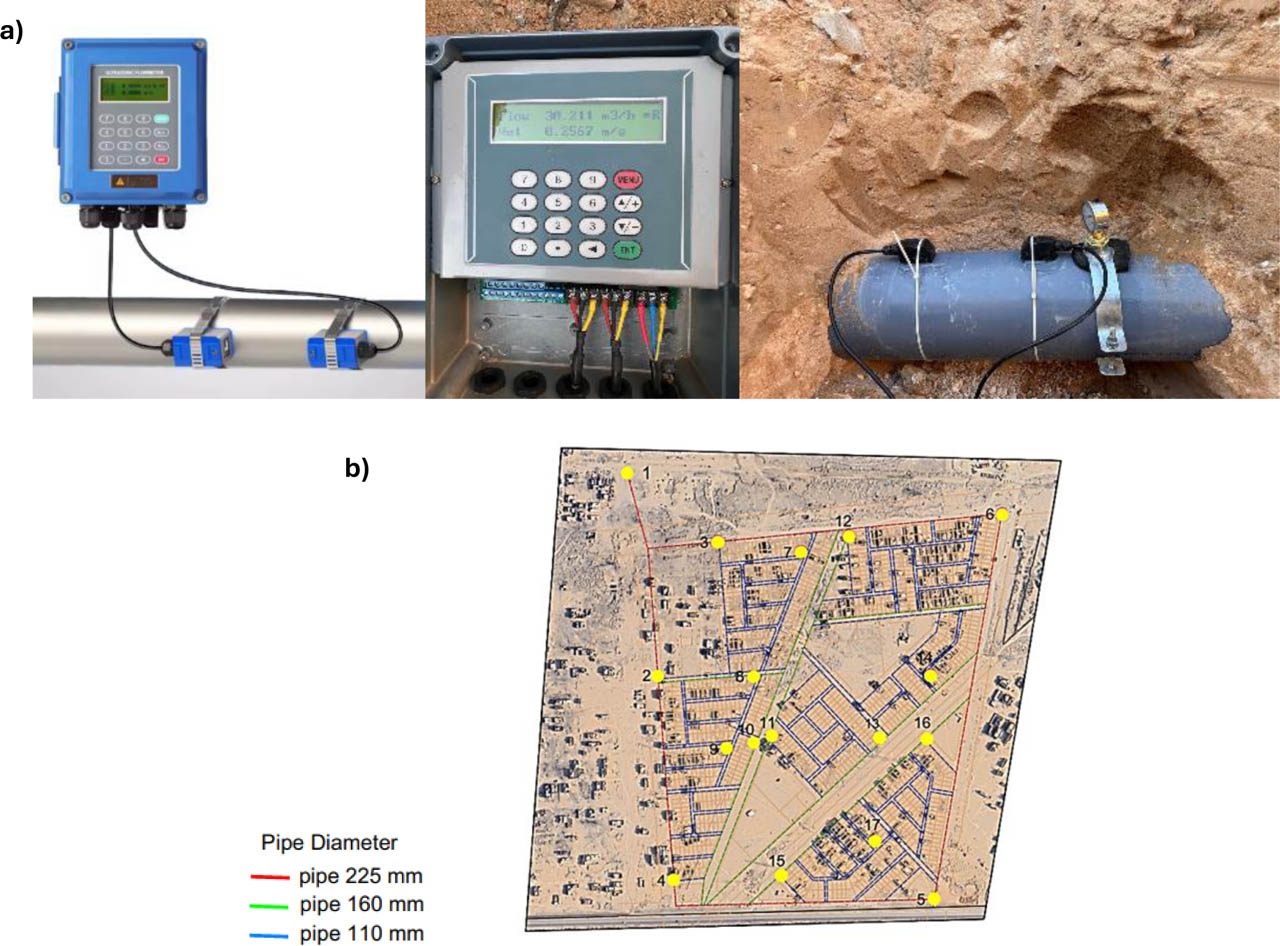
Figure 5:
Flowrate measurements: a) Wall-mount ultrasonic flow meter (Eurosonic 2000) device; b) Location of measured points
2.7. Model Calibration
The models of the water distribution systems are used in the design, management, and evaluation of these systems. Calibration is an essential stage in modeling water distribution systems, since it involves adjusting the model's input data to ensure that the output regarding water quality and hydraulic performance aligns with field data (Udovyk, 2006). The calibration technique is difficult and expensive to get high accuracy; however, the difficulty of the method may be mitigated by creating a sufficiently basic input that accurately reflects the network and its components (Walski et al., 2003). Parameters such as pipe roughness were used to ensure excellent accuracy in this network, and Hazen-William's coefficient of 140 were allocated to both the main and internal pipes. The results of these decisions more precisely represent reality. Equations 1 and 2 are used to determine the conventional statistical parameters R and RSME, respectively (Asuero et al., 2006; Chai & Draxler, 2014).
Where:n = number of values,
yi = the observed value,
ȳi = average of the observed value,
y = the simulated value,
ȳ = average of the simulated value.
The total flow at the primary source of the network was recorded at point (1), as shown in Figure 4, with a value of 64.25 m3/h. The demand was then disseminated across the network based on the requirements of each area.
3. Results Analysis and Discussion
3.1. Model Calibration
The water distribution network model was calibrated to provide accurate modeling of water quality and hydraulic performance, using pipe roughness coefficient with Hazen-Williams's coefficient of 140. The calibration results showed the highest correlation coefficient, and the lowest root mean square error (RMSE), demonstrating the model's precision in depicting the network. Field measurements were conducted to verify the model and then compared with simulation findings. The mean relative error of water pressure was 6.56%, as shown in Table 1 and Figure 6, which provides a comparison between observed and simulated water pressure values. The average relative error of demand was 7.338%, as shown in Table 2 and Figure 7.
Table 1:
Calibration results using C=140: simulated vs observed water pressure with absolute and percentage error
| Number of points | Junction | Observed pressure [psi] | Simulated pressure [psi] | Absolute pressure difference [psi] | Percentage error [%] |
|---|---|---|---|---|---|
| 1 | J-25 | 9.485 | 9.36 | 0.125 | 1.318 |
| 2 | J-26 | 8.16 | 7.12 | 1.04 | 12.745 |
| 3 | J-24 | 8.975 | 9.25 | 0.275 | 3.064 |
| 4 | J-38 | 7.925 | 5.4 | 2.525 | 31.861 |
| 5 | J-1 | 1.7 | 1.63 | 0.07 | 4.118 |
| 6 | J-13 | 4.1 | 4.9 | 0.8 | 19.512 |
| 7 | J-190 | 6.25 | 6.31 | 0.06 | 0.960 |
| 8 | J-229 | 6.75 | 6.98 | 0.23 | 3.407 |
| 9 | J-223 | 7 | 6.95 | 0.05 | 0.714 |
| 10 | J-216 | 6.75 | 6.51 | 0.24 | 3.556 |
| 11 | J-123 | 6 | 6.25 | 0.25 | 4.167 |
| 12 | J-170 | 7.5 | 7.01 | 0.49 | 6.533 |
| 13 | J-113 | 4 | 4.17 | 0.17 | 4.250 |
| 14 | J-95 | 3.6 | 3.57 | 0.03 | 0.833 |
| 15 | J-92 | 2.85 | 3.04 | 0.19 | 6.667 |
| 16 | J-51 | 3.7 | 3.89 | 0.19 | 5.135 |
| 17 | J-77 | 4 | 4.11 | 0.11 | 2.750 |
| Average Error | 6.56 | ||||
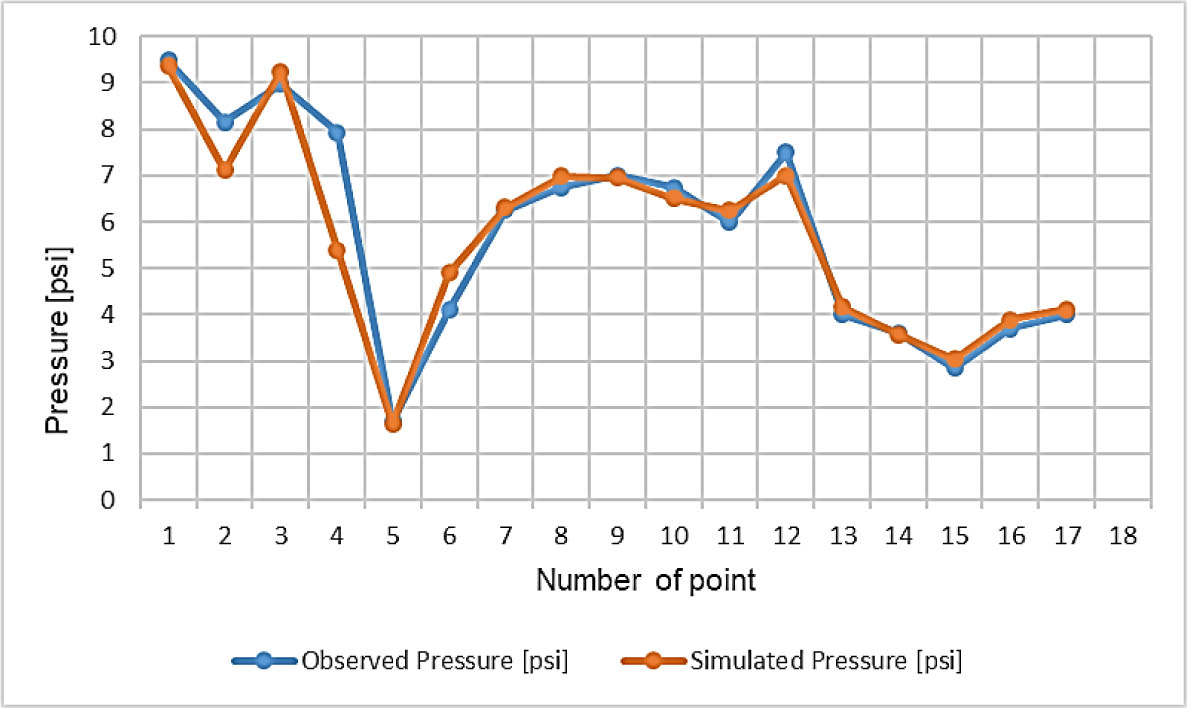
Figure 6:
Calibration results using C=140: simulated vs observed water pressure
Table 2.
Calibration Results using C=140: simulated vs observed Demand with absolute and percentage error.
| Number of points | Pipe | Observed demand [m3/h] | Simulated demand [m3/h] | Absolute demand difference [m3/h] | Percentage error [%] |
|---|---|---|---|---|---|
| 2 | P-49 | 34.718 | 30.708 | 4.01 | 0.116 |
| 3 | P-24 | 32.47 | 32.752 | 0.282 | 0.009 |
| 4 | P-36 | 12.16 | 12.191 | 0.031 | 0.003 |
| 5 | P-25 | 2.082 | 2 | 0.082 | 0.039 |
| 6 | P-13 | 11.232 | 9.566 | 1.666 | 0.148 |
| 7 | P-279 | 1.8 | 2.126 | 0.326 | 0.181 |
| 8 | P-108 | 4.528 | 4.818 | 0.29 | 0.064 |
| 9 | P-307 | 1.1379 | 1.08 | 0.0579 | 0.051 |
| 10 | P-101 | 3.998 | 4.06 | 0.062 | 0.016 |
| 11 | P-77 | 1.389 | 1.441 | 0.052 | 0.037 |
| 12 | P-86 | 9.6016 | 8.696 | 0.9056 | 0.094 |
| 13 | P-72 | 0.439 | 0.45 | 0.011 | 0.025 |
| 14 | P-204 | 0.451 | 0.435 | 0.016 | 0.035 |
| 15 | P-64 | 3.94 | 3.067 | 0.873 | 0.222 |
| 16 | P-52 | 1.421 | 1.463 | 0.042 | 0.030 |
| 17 | P-155 | 0.0697 | 0.077 | 0.0073 | 0.105 |
| Average Error | 7.338 | ||||
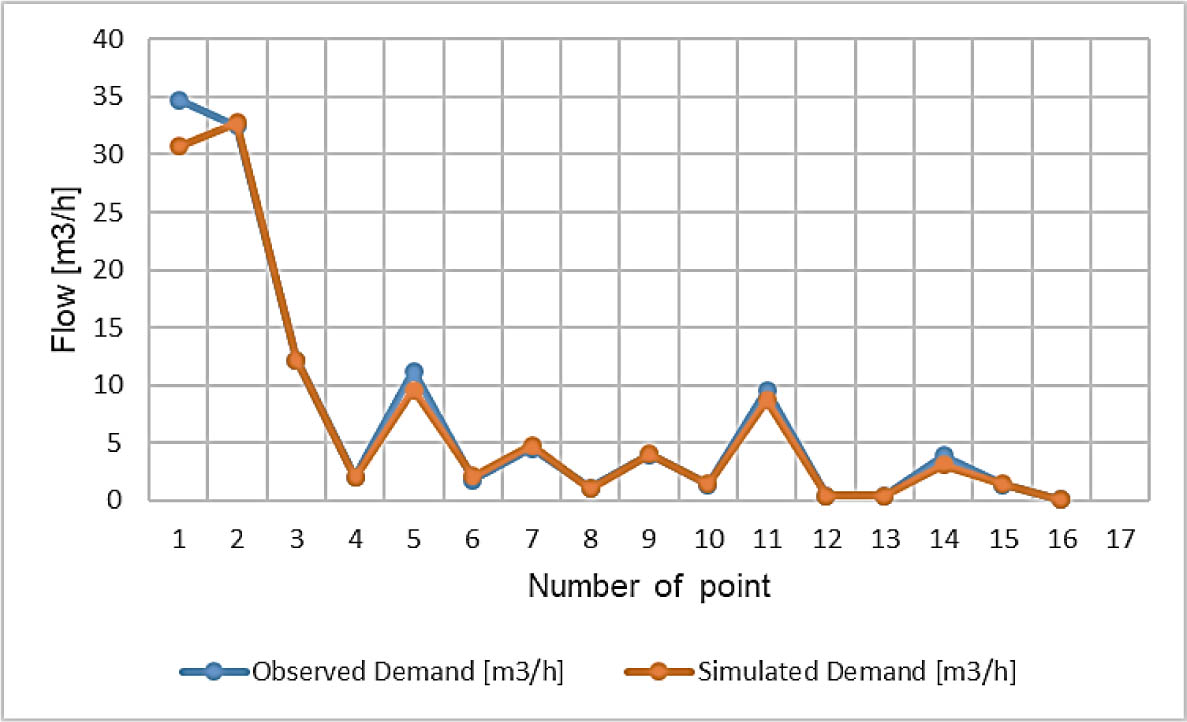
Figure 7:
Calibration results using C=140: simulated vs observed demand
The comparison of actual findings with simulation results showed an impressive degree of accuracy. The correlation coefficient (R) for pressure was 0.9492, accompanied by a root mean square error (RMSE) of 0.7165; conversely, for demand, the correlation coefficient was 0.9964, with an RMSE of 1.1382. These statistics validate the model's remarkable accuracy in modeling the actual hydraulic behavior of the network. The findings of statistical parameters are displayed in Table 3.
3.2. Model Validation
The validation of the water distribution network model was conducted using the same locations used during the calibration phase, although with distinct sets of pressure and demand data where the total demand was 63.75 m3/h The validation findings indicated an acceptable accuracy level, with average relative error of pressure at 6.85%, displayed in Table 4 and Figure 8, and an average relative error of demand at 6.595% displayed in Table 5 and Figure 9. The results underscore the model's capacity to sustain a high level of dependability when used with new datasets, therefore validating its resilience in modeling the hydraulic dynamics of the network.
Table 4:
Validation results using C=140: simulated vs observed water pressure with absolute and percentage error
| Number of points | Junction | Observed pressure [psi] | Simulated pressure [psi] | Absolute pressure difference [psi] | Percentage error [%] |
|---|---|---|---|---|---|
| 1 | J-25 | 9.45 | 9.36 | 0.09 | 0.952 |
| 2 | J-26 | 8 | 7.13 | 0.87 | 10.875 |
| 3 | J-24 | 8.98 | 9.26 | 0.28 | 3.118 |
| 4 | J-38 | 7.85 | 5.42 | 2.43 | 30.955 |
| 5 | J-1 | 1.58 | 1.64 | 0.06 | 3.797 |
| 6 | J-13 | 4.4 | 4.91 | 0.51 | 11.591 |
| 7 | J-190 | 6.28 | 6.32 | 0.04 | 0.637 |
| 8 | J-229 | 6.8 | 6.99 | 0.19 | 2.794 |
| 9 | J-223 | 6.85 | 6.97 | 0.12 | 1.752 |
| 10 | J-216 | 6.65 | 6.53 | 0.12 | 1.805 |
| 11 | J-123 | 6.2 | 6.26 | 0.06 | 0.968 |
| 12 | J-170 | 7.5 | 7.02 | 0.48 | 6.400 |
| 13 | J-113 | 3.85 | 4.19 | 0.34 | 8.831 |
| 14 | J-95 | 3.5 | 3.59 | 0.09 | 2.571 |
| 15 | J-92 | 2.85 | 3.42 | 0.57 | 20.000 |
| 16 | J-51 | 3.7 | 3.9 | 0.2 | 5.405 |
| 17 | J-77 | 4.3 | 4.13 | 0.17 | 3.953 |
| Average Error | 6.85 | ||||
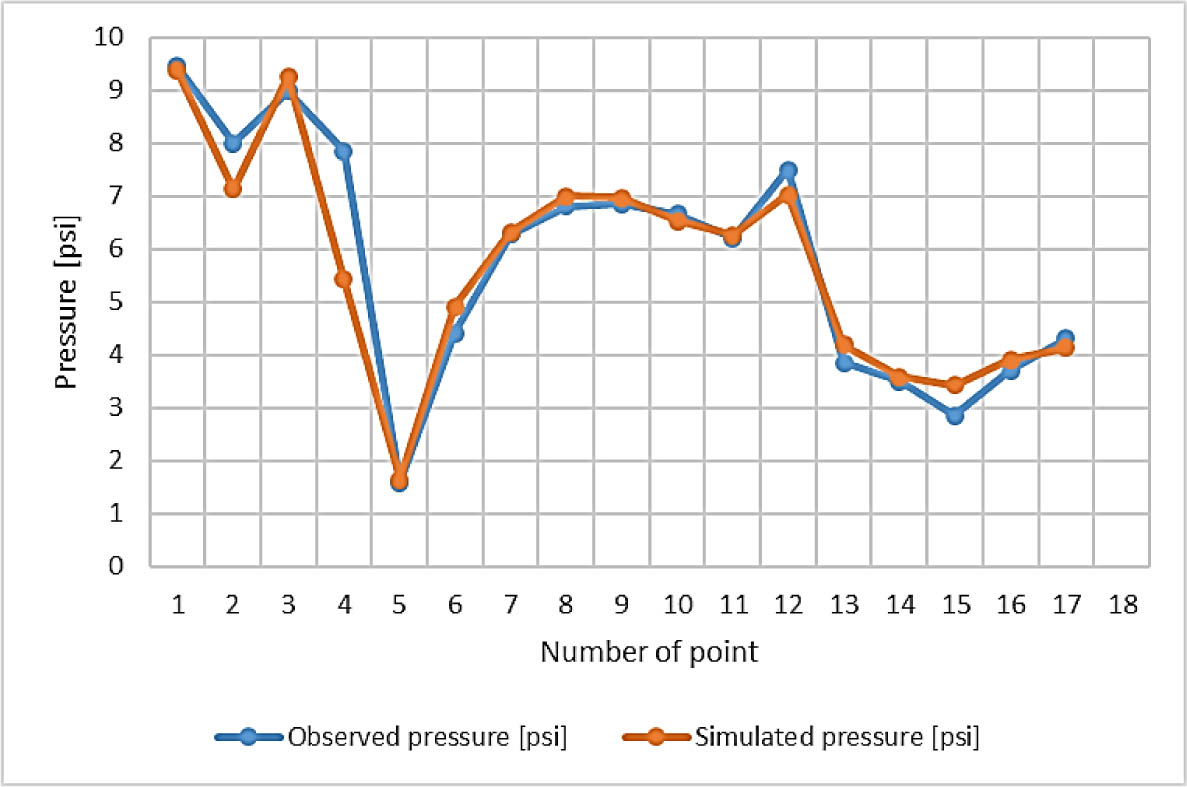
Figure 8:
Validation results using C=140: simulated vs observed water pressure
Table 5:
Validation results using C=140: simulated vs observed Demand with absolute and percentage error
| Number of points | Pipe | Observed demand [m3/h] | Simulated demand [m3/h] | Absolute demand difference [m3/h] | Percentage error [%] |
|---|---|---|---|---|---|
| 2 | P-49 | 33.624 | 30.21 | 3.414 | 0.102 |
| 3 | P-24 | 32.133 | 32.234 | 0.101 | 0.003 |
| 4 | P-36 | 11.76 | 10.948 | 0.812 | 0.069 |
| 5 | P-25 | 1.899 | 1.968 | 0.069 | 0.036 |
| 6 | P-13 | 10.465 | 9.413 | 1.052 | 0.101 |
| 7 | P-279 | 1.96 | 2.092 | 0.132 | 0.067 |
| 8 | P-108 | 4.226 | 4.739 | 0.513 | 0.121 |
| 9 | P-307 | 1.235 | 1.062 | 0.173 | 0.140 |
| 10 | P-101 | 4.05 | 3.996 | 0.054 | 0.013 |
| 11 | P-77 | 1.391 | 1.418 | 0.027 | 0.019 |
| 12 | P-86 | 9.018 | 8.544 | 0.474 | 0.053 |
| 13 | P-72 | 0.42 | 0.443 | 0.023 | 0.055 |
| 14 | P-204 | 0.437 | 0.428 | 0.009 | 0.021 |
| 15 | P-64 | 3.95 | 3.017 | 0.933 | 0.236 |
| 16 | P-52 | 1.45 | 1.44 | 0.01 | 0.007 |
| 17 | P-155 | 0.0751 | 0.076 | 0.0009 | 0.012 |
| Average Error | 6.595 | ||||
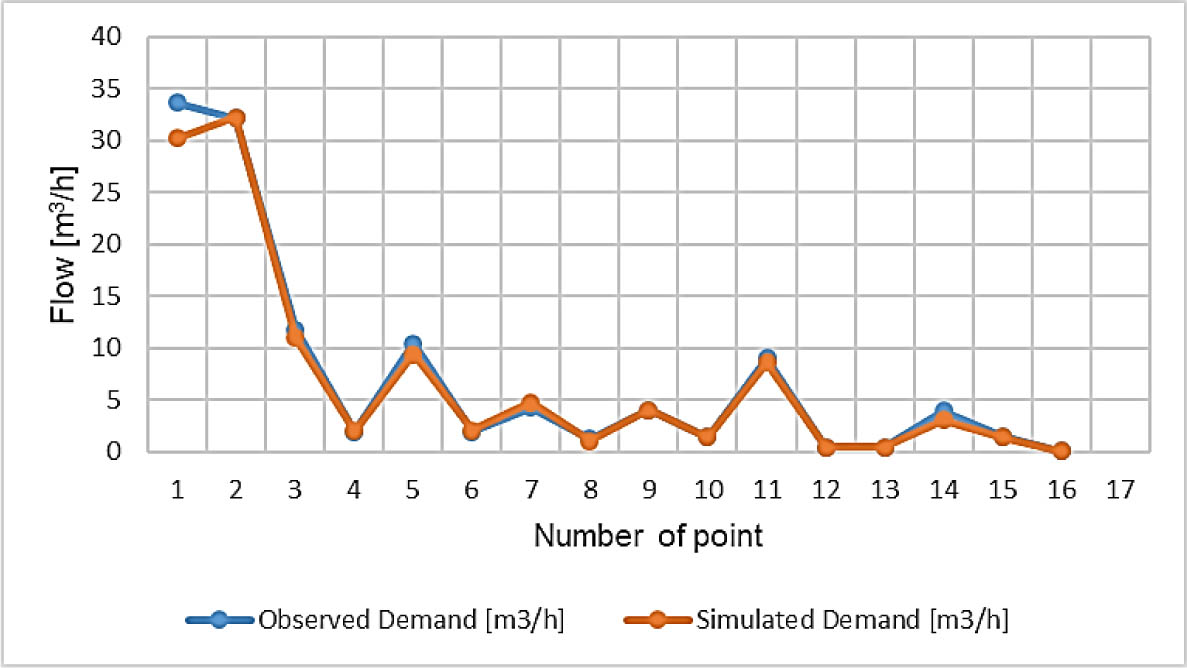
Figure 9:
Validation results using C=140: simulated vs observed demand
The validation findings indicated the model's high effectiveness, with pressure exhibiting a correlation value of R = 0.953 and an RMSE of 0.679, while flow displayed remarkable accuracy with R = 0.997 and RMSE of 0.963 displayed in Table 6. These indicators underscore the model's robust generalization ability, as it displayed significant enhancements in RMSE for both pressure and flow relative to the calibration results, accompanied by modest increases in correlation coefficients, thereby establishing its reliability in replicating the actual hydraulic dynamics of the network. . Subsequent to calibration and validation, the network demonstrated a 58% exceedance, mirroring field-recorded circumstances.
3.3. Analysis of Network Water Pressure
Water pressure distribution analysis is an essential factor in modeling water distribution networks. Simulations performed on the current models indicated that the network experiences relatively low pressure, as shown in Figure 10, with Table 7 depicting the pressure distribution among the nodes. 9.13% of the network nodes exhibited comparatively low pressures (1–4 psi), while the 4–6 psi the range comprised the majority percentage at 47.72%, followed by the 6–8 psi range at 41.49%, this distribution indicates that a substantial segment of the network functions at insufficient pressure levels, potentially compromising service quality for consumers and diminishing water supply efficiency.
Table 7:
The percentage distribution of pressure ranges within the water distribution network
| Pressure Range [psi] | Number of Junctions | Percentage of Total [%] |
|---|---|---|
| 1 – 4 | 22 | 9.13 |
| 4 – 6 | 115 | 47.72 |
| 6 – 8 | 100 | 41.49 |
| 8 – 9.4 | 4 | 1.66 |
| Total | 241 | 100 |
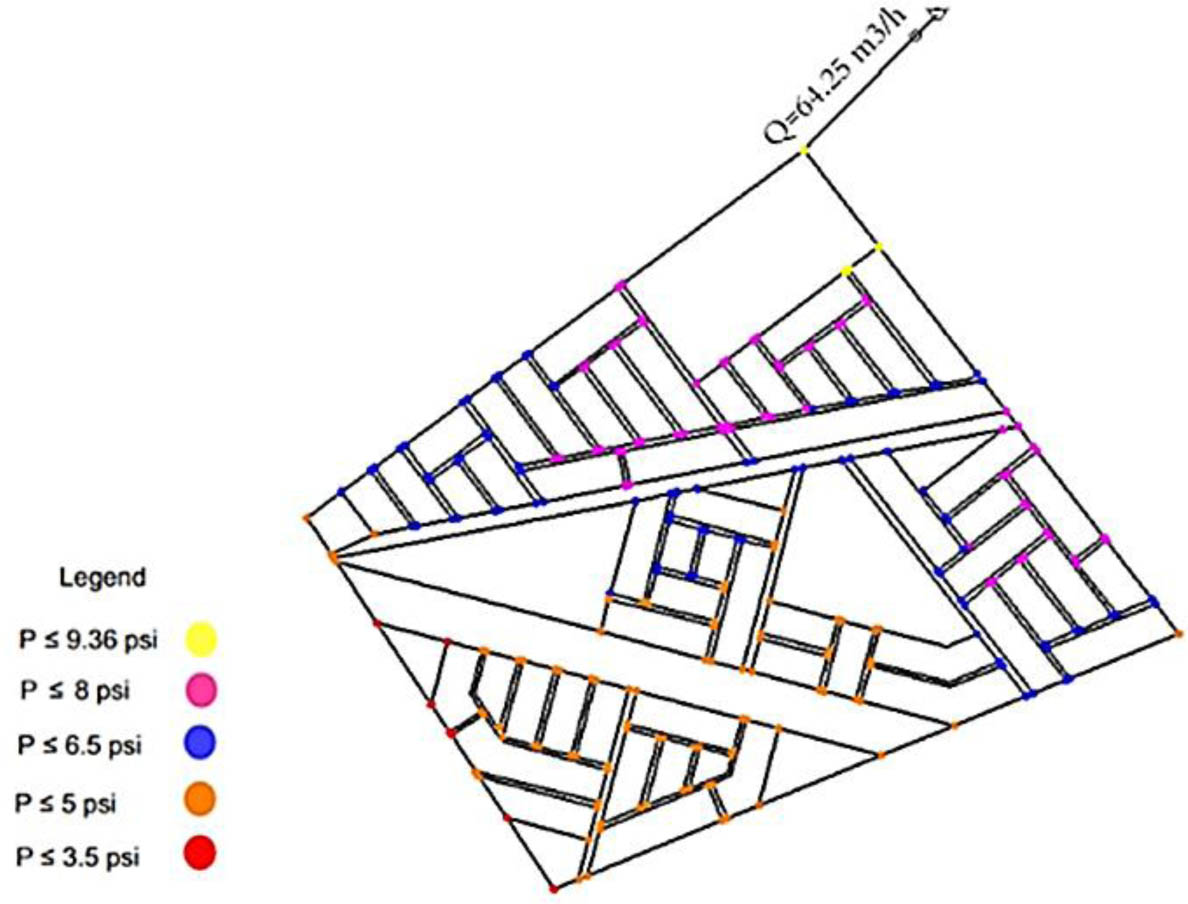
Figure 10:
Illustrating the fluctuations of pressure values across the network
3.4. Analysis of Network Flow Velocity
The velocity distribution study conducted on the present state models of all water supply networks revealed that most pipes function at velocity levels below those that are recommended, as shown in Figure 11. The data shows that over 91% of the pipe lengths operate at velocities less than 0.1 m/s, which is far slower than the design criteria recommended to prevent sedimentation, maintain water quality, and restrict bacterial growth in the pipe system. In comparison, Table 8 reveals that just 1.07% of the pipes operate at velocities greater than 0.5 m/s.
Table 8:
Flow velocity range in the water distribution network pipes
| Flow velocity range [m/s] | Percentage of pipe length [%] |
|---|---|
| < 0.01 | 28.91 |
| 0.01 – 0.1 | 62.32 |
| 0.1 – 0.2 | 4.22 |
| 0.2 – 0.3 | 3.48 |
| 0.3 – 0.4 | 0.0 |
| 0.4–0.5 | 0.0 |
| 0.5–0.6 | 1.07 |
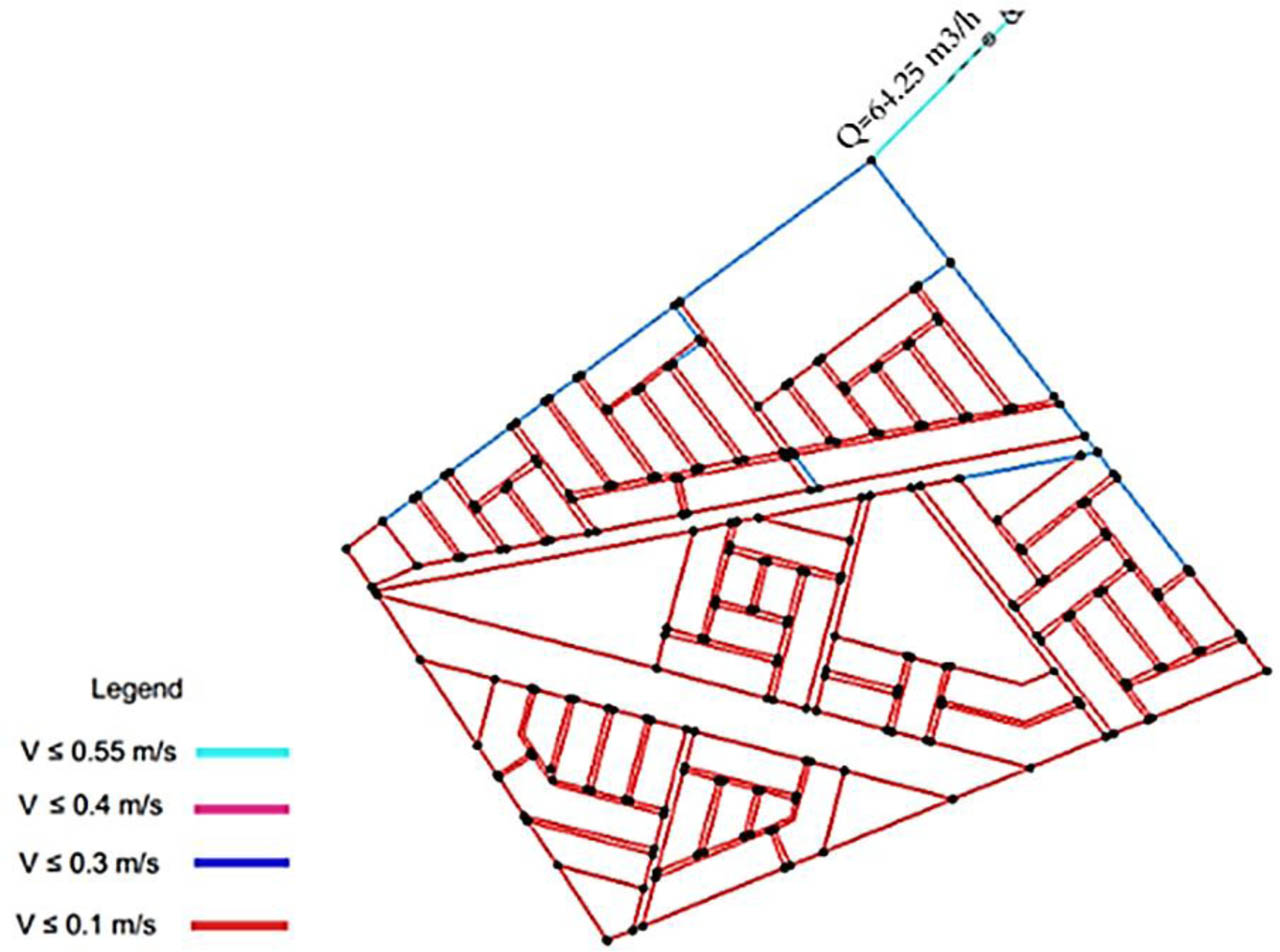
Figure 11:
Illustrating the fluctuations of velocity values across the water distribution network
4. Conclusions
The present study aims to evaluate the water supply performance of the Muhandisin Al-Nidal network by analyzing and modeling its hydraulic parameters. The main conclusions of this study are as follows:
According to the study's results, the hydraulic simulation model of the water distribution network in the study region demonstrated high accuracy with excellent agreement between the simulated values and field data. The validation procedure also substantiated this degree of accuracy and dependability.
A significant portion of the network functions at comparatively low pressures, which has an adverse effect on the effectiveness and quality of water supply to customers.
Most pipes had low flow velocities, which suggested that the network's hydraulic performance was subpar.
The investigation, which reflected actual field circumstances and operational realities, revealed that the network experienced a 58% overconsumption because of certain users taking illicit water withdrawals from nearby regions after the network was calibrated and validated.
According to the study, using programs such as Google Earth Pro and CAD Earth in conjunction with simulation programs such as WaterGEMS is essential for efficient network management and the analysis of different operating situations.
Notes
[1] Contributed by Author Contributions
A.A.A. conceived and designed the study. R.J.M.Al-S. conducted the experiments and collected the data. J.H.Al-B. performed the statistical analysis. All authors contributed to data interpretation and manuscript drafting. All authors critically reviewed and approved the final version of the manuscript and agreed to be accountable for all aspects of the work.