

In Europe, approximately two-thirds of existing road bridges are older than fifty years (fib Bulletins no. 110, 2023). Their operation, maintenance, repairs and renewal consume more funds every year. The situation is the same in Slovakia. Inadequate funding and the requirement to maintain roads in operation increase the pressure on efficient handling of funds. Therefore, in the process of making decisions about bridges in bad technical condition, it is necessary to more accurately determine their residual bearing capacity using detailed diagnostics and assessment of load capacity. In order to prevent the unexpected failure of bridges in poor technical condition, it is also advisable to introduce detailed monitoring to control the behaviour of the bridge during operation. In this way, it is possible to extend the life of the existing bridge until its complex rehabilitation and strengthening take place.
The ageing of the bridges is one of the main causes for rehabilitation need, but not the only one (PIARC TC 4.2 Road Bridges, 2022). The article presents the case study of a bridge, with the assessment of the load capacity of which the authors encountered recently.
Slovakia is a landlocked country in Central Europe with an area of approximately 49,000 km2 and a population of 5.5 million. The state authorities manage 8,100 bridges on its road net, cities and municipalities manage another 9,200 road bridges (Paulik, 2014). Slovakia, as well as the whole of Europe and North America, has gradually reached a situation where it is necessary to solve the problem of ageing road infrastructure immediately. At least half of the road bridges reached, or within a few years it will reach the limit of its lifespan. The reason is the massive construction in the 1950s and 1960s of the 20th century, driven by new, albeit imperfect, technologies. At that time, prestressed bridges were built using imperfect grouting technology, and new precast girder technologies or segmental structures were also being developed. Also, insufficient knowledge regarding the degradation of prestressed and reinforced concrete structures, low concrete cover, imperfect and not well-maintained waterproofing layers of bridge decks.
The time development of the construction of road bridges in Slovakia is shown in the graphs in Figure 1 and Figure 2 (Paulik, 2014). The graph includes reinforced concrete and prestressed bridges and points to the beginning of a more massive use of prestressing in the 1960s. In the same period, prefabrication for bridges of small and medium spans began to be promoted. The deteriorating condition of post–World War II bridges, along with recent severe bridge failures both domestically and abroad, has intensified discussions about the urgent need for repairs and reconstruction of existing structures (Vičan et al., 2023).
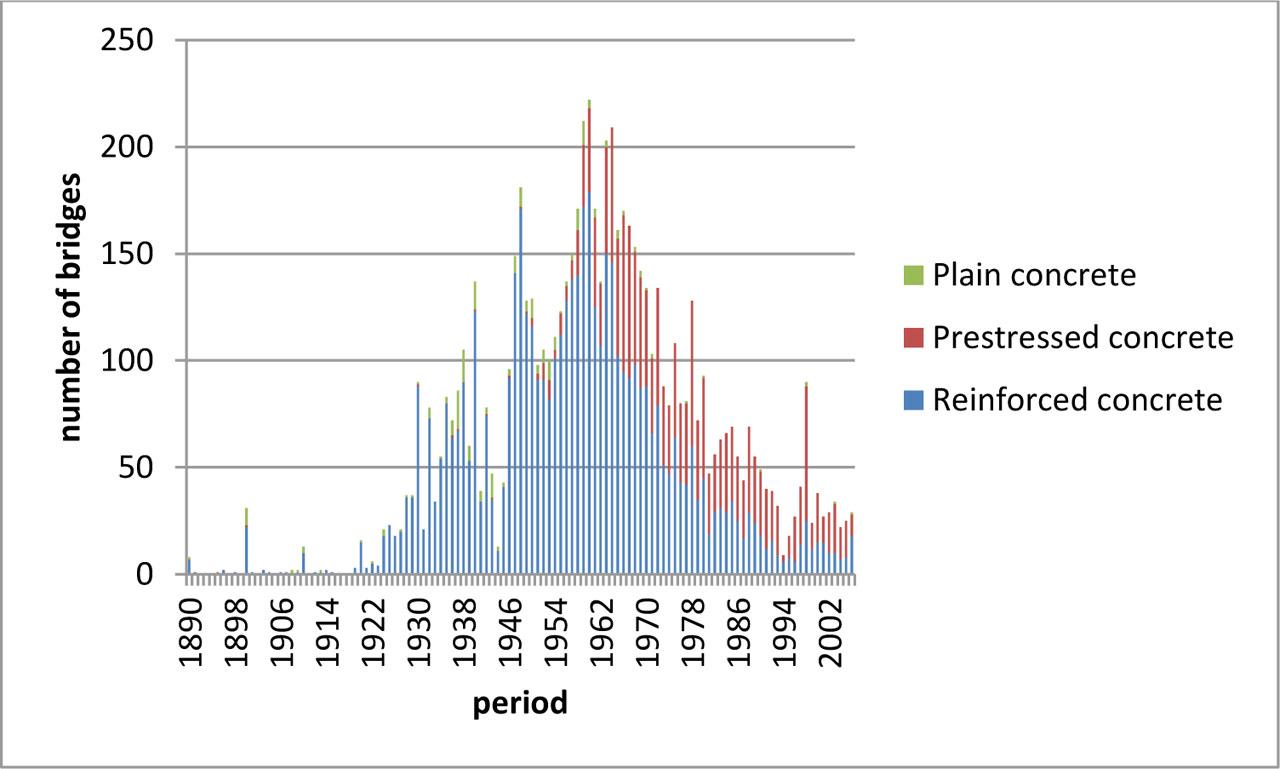
Number of road bridges depending on the year of construction, comparison of reinforced concrete and prestressed concrete bridges
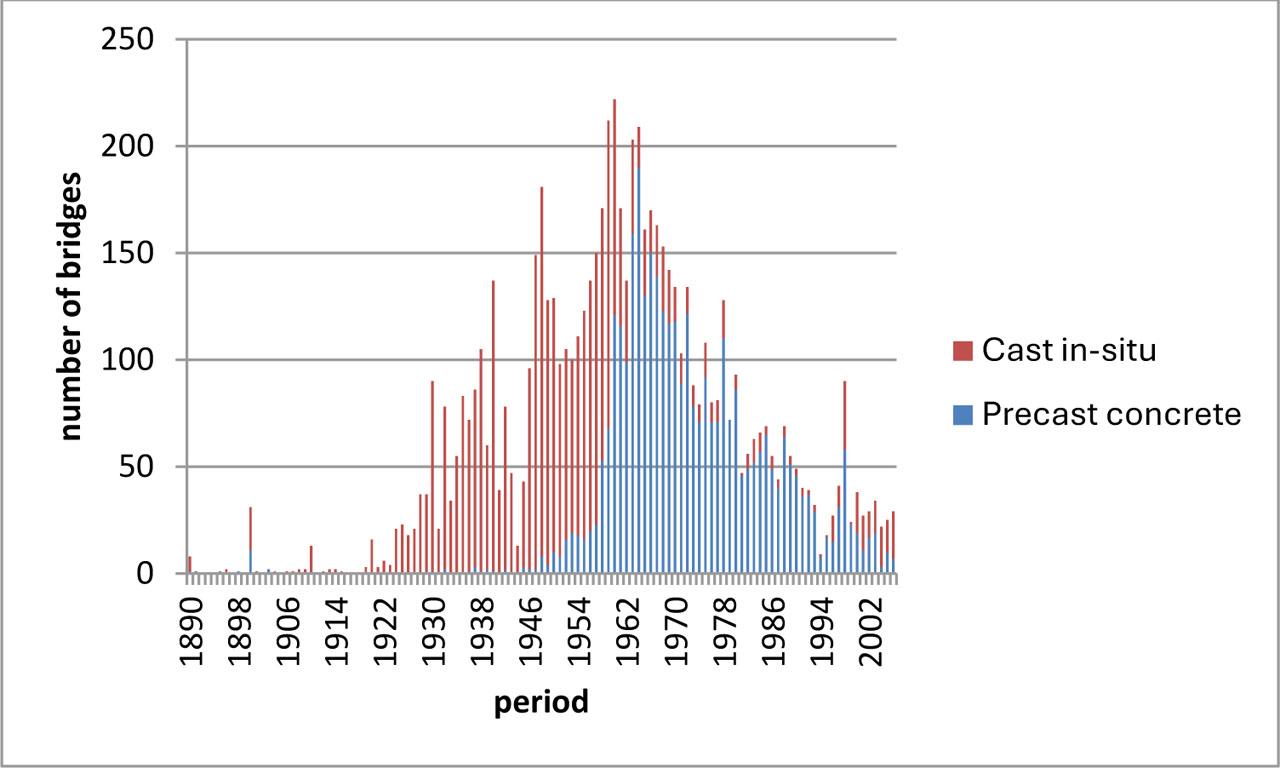
Number of road bridges depending on the year of construction, comparison of cast-in-situ and prefabricated concrete bridges
The bridge on Bojnicka Street was designed as a temporary road overpass, which served as access to the industrial area, see Figure 3. The bridge crosses the double-track railway line and another 2 sidings, see Figure 4. It was built in 1977. The bridge has 6 spans with a total length of 106.8 m. The deck consists of 18 m long post-tensioned precast girders KA-67. There is no bending connection in the intermediate supports; therefore, the bridge behaves as a sequence of 6 simply supported spans. There are 11 beams in the cross-section. The depth of the beams is 0.85 m. The total width of the bridge deck is 11.5 m, see Figure 5. The connection between the beams in the transverse direction is made with cast-in-situ concrete joints. The beams are made of concrete class B500 (C35/45) with a mean cube strength of 50 MPa.

View of the bridge on Bojnicka Street
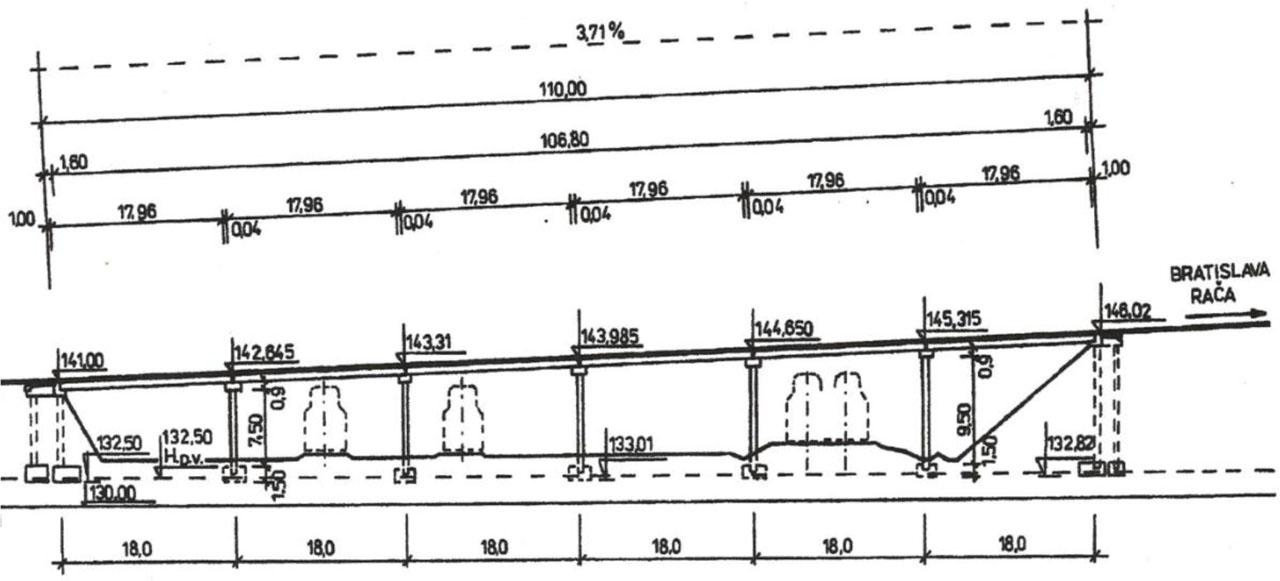
Longitudinal section of the bridge, dimensions in [m]
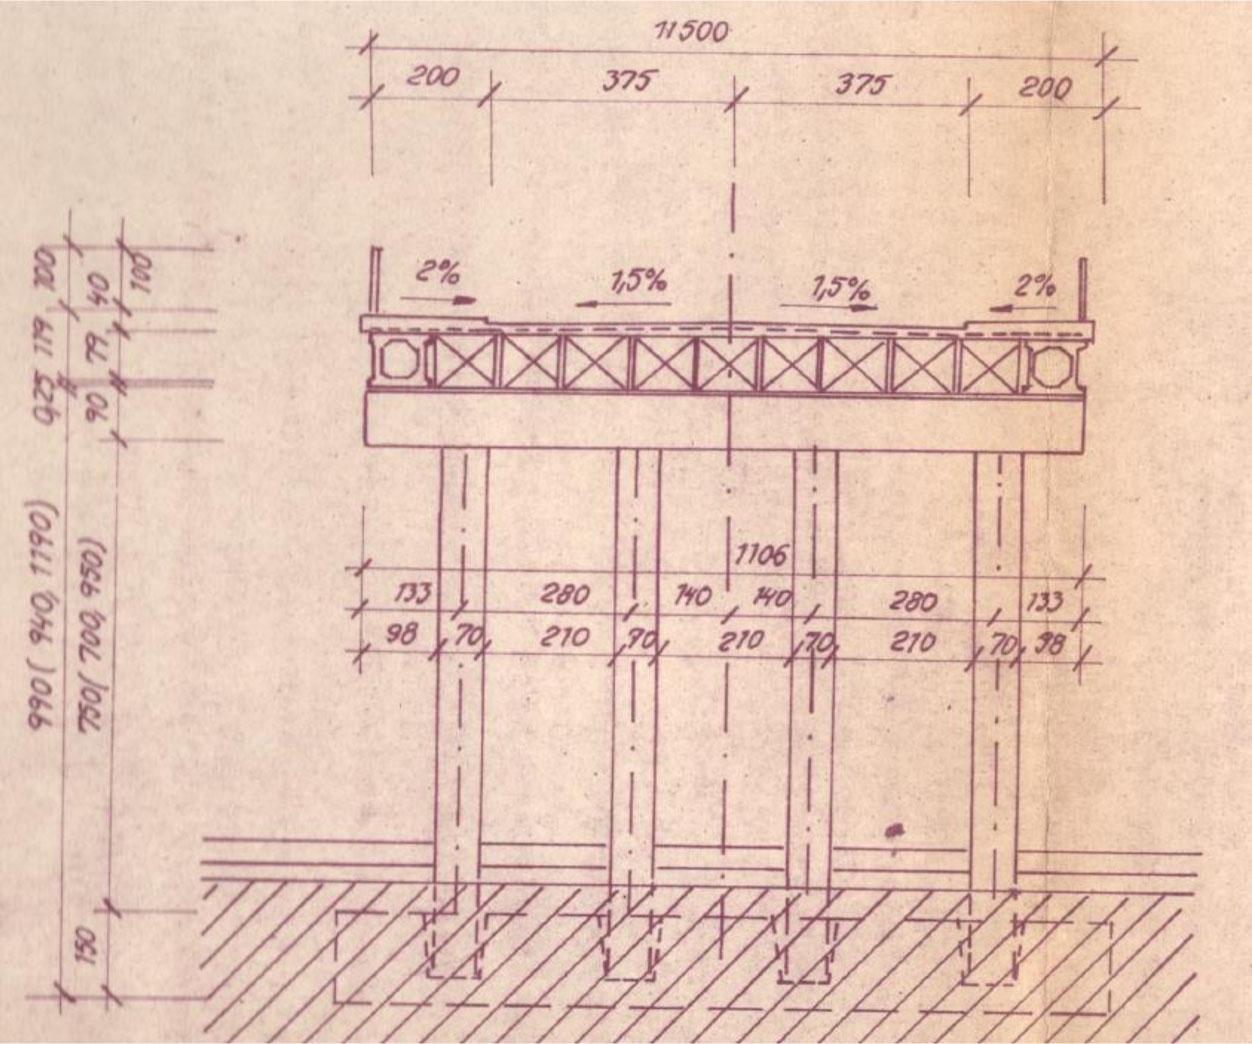
Transverse section of the bridge with intermediate support, dimensions in [cm]
The substructure of the bridge consists of end abutments and 5 intermediate supports. In the transverse direction, the intermediate supports are designed as a frame with four columns and a crossbeam that also serves to seat the prestressed girders. The cross-section dimensions of the crossbeam are 0.9×1.2 m. The columns are prefabricated and fixed into the foundation cups. The dimensions of the column cross-section are 0.7×0.7 m. The height of the internal supports measured from the upper edge of the foundation to the upper edge of the crossbeam is variable: 7.9 m, 8.4 m, 8.4 m, 9.9 m and 10.4 m.
The detailed inspection of the bridge aimed to obtain data for assessing the load-bearing capacity of the structure and the overall technical state of the bridge. According to the request, all available parts of the structure were inspected, and the type and degree of degradation of the individual structural elements of the substructure and superstructure were to be determined. During a detailed inspection, the condition of the injection of the prestressing units, as well as their possible corrosion, was checked. The knowledge of the residual state of prestressing is the crucial factor (Kralovanec et al., 2022).
There was a full-surface delamination of the concrete cover layer on the bottom part of the columns and the crossbeams (Figure 6). Thus, there was a significant reduction in the bond between the reinforcement and the concrete. The covering layer is delaminated on approximately 80 % of the area of the columns, and even if it is not visually obvious at first sight, the concrete cover falls off after tapping with a hammer. The reinforcement under the cover layer was significantly corroded. The reductions in the cross-sectional area of the reinforcement were as follows:
- ○
Column, longitudinal bars: 10 to 20%.
- ○
Column, stirrups: 50 to 80%.
- ○
Crossbeam, longitudinal bars in bottom surface: 50 to 100%.
- ○
Crossbeam, stirrups: 50 to 100%.
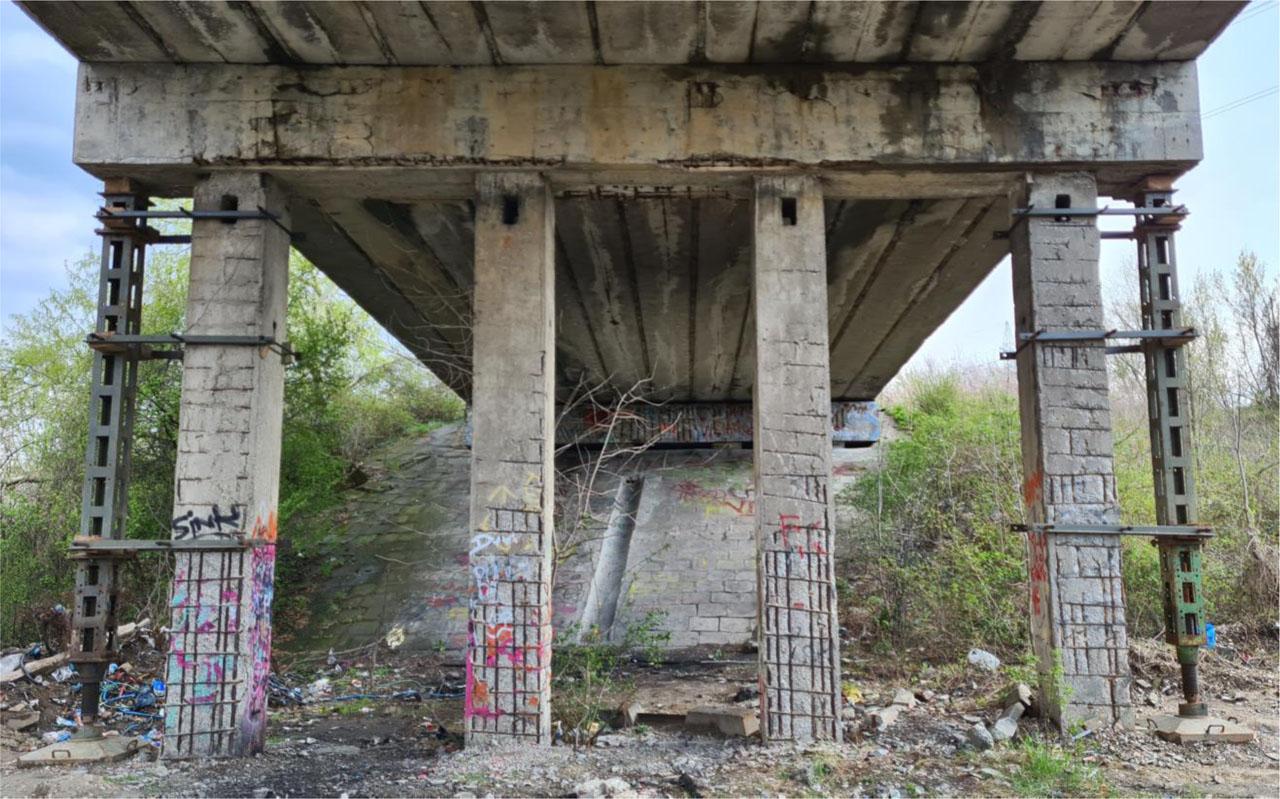
View on the substructure with temporary support of the crossbeam
High concentrations of chlorides were measured in the vicinity of the reinforcement in the range of 1 to 10 % of the estimated weight of the cement, both on the columns and on the crossbeam.
The bridge deck leaks over approximately 40 % of the area, which is already visible at first sight from below at all the spans. Moreover, steel bars were used to support transverse reinforcement, and therefore, they were placed directly on the formwork in the longitudinal direction. Their corrosion has gradually affected the integrity of the concrete cover at the bottom surface of the beams. Corrosion of the prestressing tendons occurs locally. It is estimated that the prestressing tendons corrode in at least 20 % of the beams. In some places, the concrete cover layer of the prestressing units has spalled off, and the corrosion has become visible. Some beams show longitudinal cracks at the bottom surface, which are caused by corrosion of the prestressing ducts. The worst corrosion of prestressing wires is presented in Figure 7. It has completely corroded several tendons along a length of approximately 5 m. The significant corrosion advancement is caused by the high chloride content in their vicinity, which was detected in the laboratory on samples of the cover layer and injection mortar. Chloride concentrations determined based on laboratory analysis showed values ranging from 3 to 23 % of the estimated weight of cement.
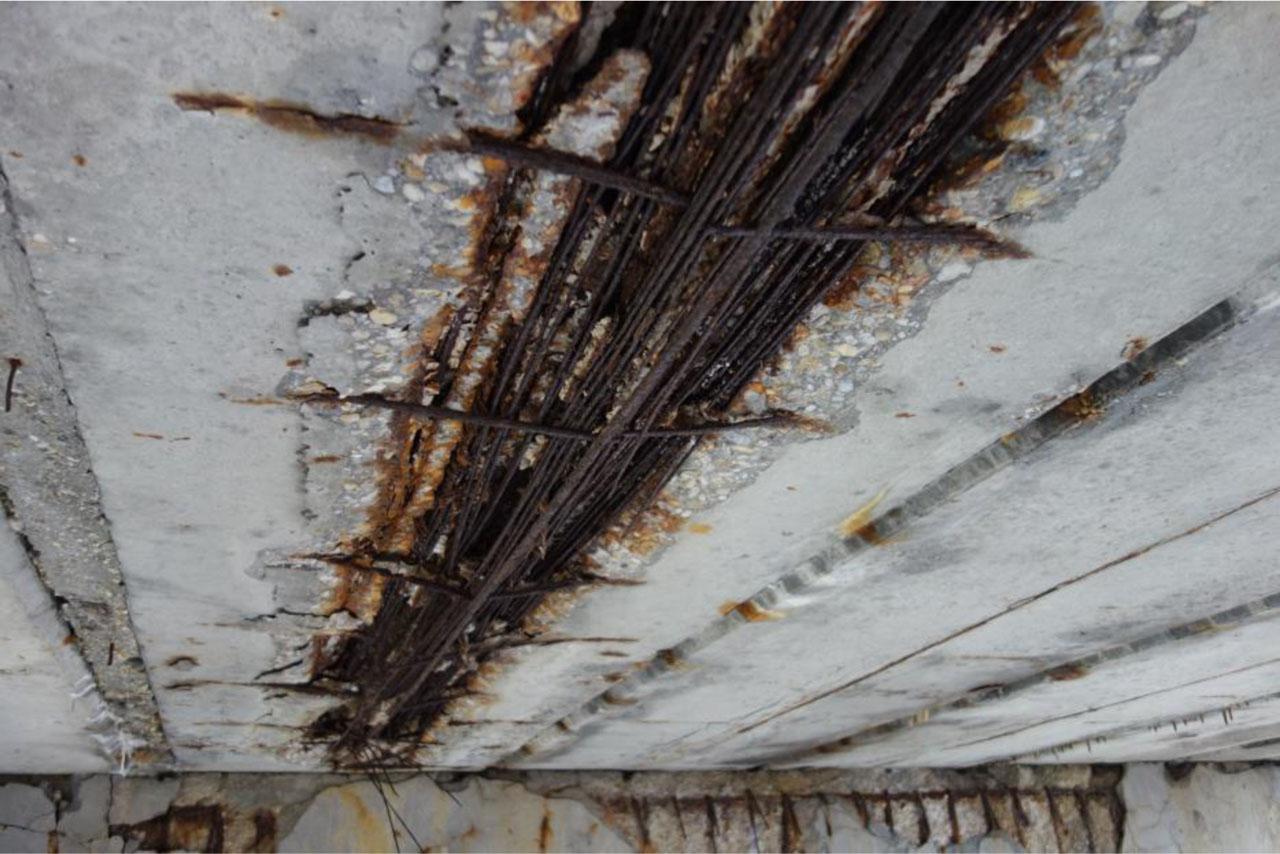
View of corroded prestressing wires
In the first moment after the extraordinary inspection, the bridge was closed to all traffic. An emergency state was declared. A load-bearing capacity assessment was required in the next step. Inputs were ensured by detailed diagnostics survey. The bridge load and load combinations were considered according to Eurocodes, i.e. EN1991-1-1 (permanent loads), EN1991-1-4 (Wind load), EN1991-1-5 (Temperature load), EN 1991-2 (Traffic load) and TP 104 Load-bearing capacity of road bridges and footbridges (Slovak technical regulation). The load-bearing capacity was determined considering existing damages.
The calculation of the prestressing losses was made in accordance with EN1992-1-1. When calculating the prestressing losses, the friction in the steel ducts with a diameter of 42 mm μ = 0.20 and the unintentional angular deviation k = 0.01 rad/m were considered. The slip in the anchors was considered to be 10 mm, and the Class 1 relaxation of the prestressing steel with normal relaxation. At the end of the service life, based on theoretical calculations that account for short-term and long-term prestress losses, the average stress in the prestressing units at the girder mid-span section was estimated to be 795 MPa. A major part of the prestress losses represented steel relaxation due to the high value of the ratio of initial stress in the prestressing steel and the strength of the prestressing steel, 1310/1650 = 0.794.
The beams are reinforced in each web with two-leg stirrups with a diameter of 8 mm, spaced at 400 mm (item 12 in Figure 7) and a stirrup, one leg of which passes through the precast web and the other reinforces the grout with a diameter of 10 mm at 200 mm spacings, item 13 in Figure 8. Based on the inspection of the bridge and traces of corrosion of the reinforcement in the grout on the lower surface of the beams, which are spaced approximately 400 mm apart, it was assumed that item 13 also has a spacing of 400 mm. The reinforcement was made of steel 10400-B, with a characteristic yield strength of fyk = 400 MPa.
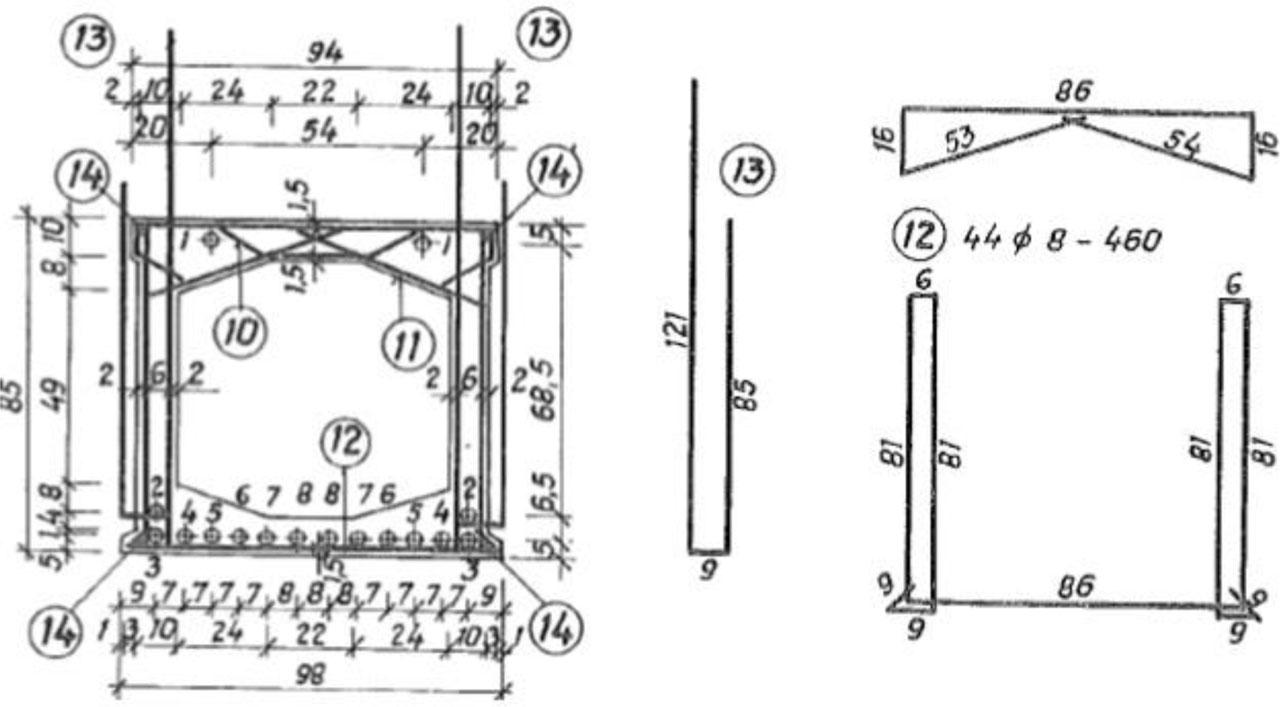
Cross-section of the girder KA-67 with reinforcement and prestressing tendons, dimensions in [cm]
In the first phase, the load capacity was determined assuming that there were no damages to the bridge. In the second phase, the load capacity was calculated considering the actual condition of the bridge (Koteš et al., 2025). In the case of the superstructure, the effect of corrosion of the prestressing reinforcement was considered by reducing the area of the prestressing reinforcement by 15 %, 30 % and 50 % for the assessment of bending resistance. In the case of shear, the load capacity was determined with the area of the reinforcing steel reduced by 15 % and 30 %.
Internal forces in the posttensioned beams were obtained from the FEM model. A grid model of the bridge was created, where the mutual connection of the beams in the transverse direction was modelled by a hinged connection that transmits only shear forces.
For the ultimate limit state, the prestressed beams were assessed for bending and shear resistance. The normal stresses in the concrete were also verified for the serviceability limit state criteria. According to the technical regulation TP 104, there are several values of bridge load capacity based on different load models. The important values for this bridge are normal and exclusive (single vehicle) load capacity.
The normal load factor kz,n determines the ability of the bridge to transfer the basic traffic load expressed by the LM1 load model according to STN EN 1991-2, which is used for overall and local verification of the structure. The normal load capacity is determined based on the value of the normal load factor. In general, the relationship for the load factor for a critical static quantity can be expressed as the ratio of the capacity (reserve) of resistance for the critical traffic load and the effect from the standard load model LM1:
Where:
kz,n - normal load factor,
Rdw,c - value of the capacity (reserve) of resistance for the critical traffic load,
Ed,WLM1 - value of the static quantity from the effect of the standard load model LM1.
The normal load capacity in [kN] is determined according to the Equation 2:
Where:
Vn,rep - weight of a representative vehicle for normal load capacity with a value of 32 t.
When determining the exclusive load capacity, the load is a single special vehicle 900/150 according to STN EN 1991-2 A.2(1). This is a 6-axle vehicle with a total weight of 90 t. The effects of this vehicle are considered magnified with a dynamic coefficient ϕ. The principles of calculating the exclusive load capacity is similar to that for the normal load capacity. The weight of the representative vehicle in this case is 90 t. Details on determining the load-bearing capacity of road and pedestrian bridges in Slovakia and reliability calibration are provided in (Vičan et al., 2021).
Table 1 summarizes the load capacity results based on the ultimate limit state (ULS) assessment of bending and shear resistance and the serviceability limit state (SLS) assessment, stress control. The table evaluate:
- ○
Vn - normal load capacity in [t].
- ○
kz,n - normal load capacity factor.
- ○
Vr - exclusive load capacity in [t].
- ○
kz,r is exclusive load capacity factor.
Load-bearing capacity of the bridge deck
| Assessment | Line | Level of prestress | Normal capacity | Exclusive capacity | ||
|---|---|---|---|---|---|---|
| kz,n [-] | Vn [t] | kz,r [-] | Vr [t] | |||
| Stress in concrete limitation SLS | 1 | 100 % | 0.95 | 30.4 | 1.02 | 91.8 |
| 2 | 85 % | 0.58 | 18.6 | 0.61 | 54.9 | |
| 3 | 70 % | 0.19 | 6.1 | 0.18 | 16.2 | |
| 4 | 50 % | 0 | 0 | 0 | 0 | |
| Bending resistance ULS | 5 | 100 % | 1.717 | 54.9 | 1.560 | 140.4 |
| 6 | 85 % | 1.437 | 46.0 | 1.305 | 117.5 | |
| 7 | 70 % | 1.071 | 34.3 | 0.973 | 87.6 | |
| 8 | 50 % | 0.528 | 16.9 | 0.479 | 43.1 | |
| Shear resistance ULS | 9 | 100 % | 1.16 | 37.1 | 1.16 | 104.4 |
| 10 | 85 % | 0.93 | 29.8 | 0.91 | 81.9 | |
| 11 | 70 % | 0.73 | 23.4 | 0.69 | 62.1 | |
| 12 | 50 % | 0.43 | 13.7 | 0.36 | 32.4 | |
From the perspective of long-term use of the bridge at 70 % prestressing efficiency (beams with longitudinal cracks), the normal load capacity is only Vn = 6.1 t and the exclusive Vr = 16.2 t, (Table 1, line 3). For beams without cracks, where we assume 85 % prestressing efficiency, the normal load capacity is Vn = 18.6 t and the exclusive Vr = 54.9 t, (Table 1, line 2). One beam shows zero load capacity (Figure 7). From the perspective of short-term use of the bridge, a maximum of 1 year (considering only ULS), a higher load capacity can be considered, normal Vn = 23.4 t and exclusive Vr = 62.1 t, see Table 1, line 11. Due to extensive damage and corrosion of the prestressing tendons, the results of the theoretical calculations of load capacity had to be verified by a load test. Besides, a modification of the traffic arrangement on the bridge was proposed. Originally, a two-lane carriageway was changed to a single lane with shuttle traffic controlled by the traffic lights on both ends of the bridge. This allowed for avoiding traffic passing over the most damaged girder.
When there are doubts about the intensity of structural damage or inaccuracies in determining the prestress level of a bridge, the procedure for determining its load-carrying capacity can be supported by a proof-load test. This test serves to validate the assumptions made during the structural analysis (Moravcik, et al. 2025). Therefore, load test aimed to verify the structural behaviour of the bridge considered by the design model that was used for the assessment of the bridge load capacity. This mainly concerns the transverse distribution of the load, i.e. the mutual interaction of the beams in the transverse direction. Furthermore, to determine the impact of significant damage to the prestressing tendons of the beam in the 3rd span (Figure 7) on the overall performance of the bridge.
Originally, the bridge was designed for the effects of a three-axle vehicle with a weight of 60 t and a single axle load of 200 kN, which simultaneously acts with a uniform load on the entire road surface with an intensity of 6.0 kN/m2. The dynamic effects of the load were considered in the design using a dynamic coefficient ϕ = 1.136.
The test load was carried out by two 4-axle Mercedes Actros vehicles, see Fig. 11b. The vehicles had a weight of 40 t. For the theoretical calculation of the bridge response to loading, the same grid finite element model was used as for the assessment of the load capacity. The calculation of deflections was performed with two flexural stiffnesses. The first flexural stiffness (EI)1 was determined only with the cross-sectional properties of the prestressed beams, and the second increased bending stiffness (EI)2 was determined with the cross-sectional properties of the beams, including the sloped plain concrete placed on the top surface of the beams. The values of bending stiffness for representative individual girders are given in Table 2 for both cases.
Comparison of the bending moments and deflections between standard and test loads
| Effect of load | Loading | Effectiveness | ||
|---|---|---|---|---|
| Design En | Test Etest | Etest/(En) [-] | ||
| Bending moments | 520 kN.m | 293 kN.m | 0.563 | |
| Deflection | (EI)1 = 1299 MN.m2 | 12.6 mm | 7.20 mm | 0.571 |
| (EI)2 = 1489 MN.m2 | 10.5 mm | 5.93 mm | 0.565 | |
The three most damaged spans were tested. The vehicles were placed in the proposed positions gradually, with a time gap and reading the deflections of the bridge deck. The bridge was also gradually unloaded, with measurements taken of residual deformations. The most unfavourable loading position is shown in Figure 9, where both vehicles are standing in the middle of the span, side by side at the edge of the carriage way. The effectiveness of this load compared to the theoretical standard load is 56.3 % (Table 2).
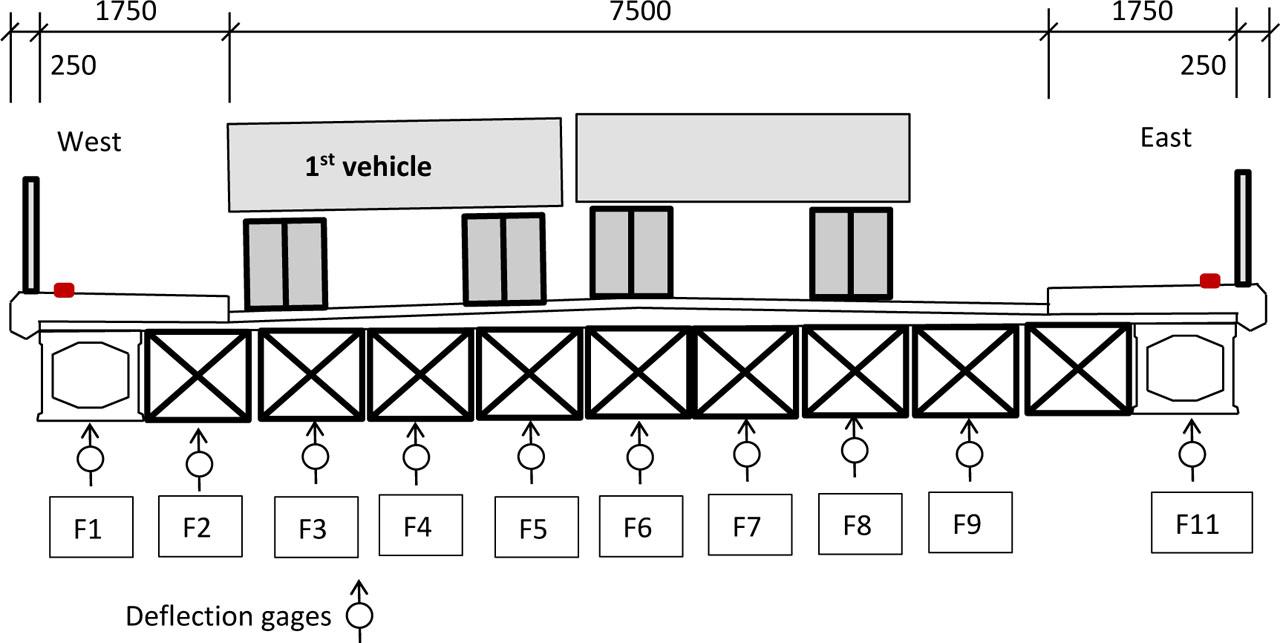
Positioning of deflection gages and testing load in the most unfavourable position
The evaluation of the load test was carried out based on the comparison of calculated and measured deformations. Figure 10 presents the results of the measured deflections, which are compared with the theoretical values when considering the two theoretical stiffnesses (EI)1 and (EI)2. The maximum measured deflection reached a value of 3.2 mm, which represents 56 % of the theoretical value of 5.7 mm, considering a higher stiffness (EI)2. At this load position, the transverse distribution of deflection was in good agreement with the theoretical one considered in the assessment of the bridge's load capacity. After unloading, the structure returned to its original deformation state. The maximum shortening of the supports during loading was 0.1 mm on one side and 0.3 mm on the second side of the span. The smaller measured deflections compared to theoretical predictions are attributed to the increased overall stiffness of the superstructure, resulting from the partial interaction of sloped plain concrete layers, asphalt surfacing, sidewalks, kerbs and railings and partial continuity ensured by reinforced concrete parapets passing over every second joint.
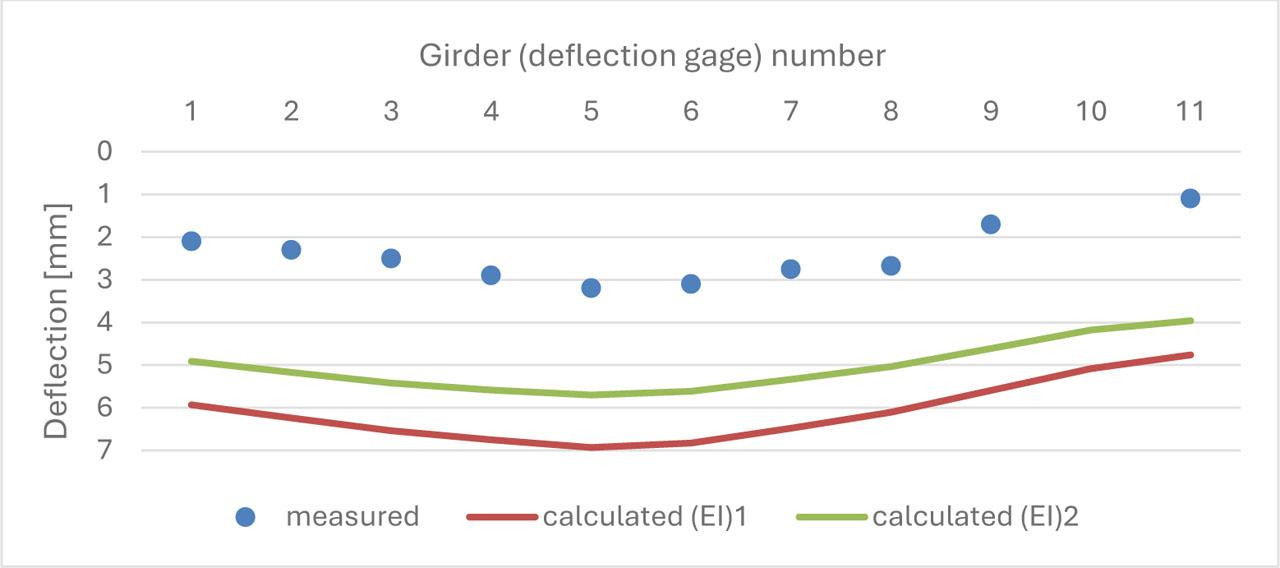
Comparison of measured deflections and theoretical predictions for the most unfavourable load position
The monitoring aims to record the long-term deformations of the bridge to detect a decrease in its load-bearing capacity in time and thus ensure safe operation of the bridge for the period necessary to develop a project for a new bridge. Monitoring allows safe operation of the bridge without the need for temporary support of the superstructure and also provides an image of the degradation process. For this purpose, deflection sensors based on the principle of hydrostatic levelling, inclinometers and temperature sensors of the structure and ambient air were installed on selected beams. Testing of the long-term monitoring sensors took place during the bridge load test by comparison with measurements of the mechanical deflection gauges.
To keep the bridge in service, detailed visual inspections of critical sections have been prescribed at least 2 times a year. The aim is to visually monitor the possible degradation of critical parts of the bridge (Figure 11a). In order to detect possible hidden damages, measurements of the dynamic properties of the bridge are also carried out. Load tests are repeated every two years, comparing the response to the same loads, including the most unfavourable vehicle position, see Figure 11b.
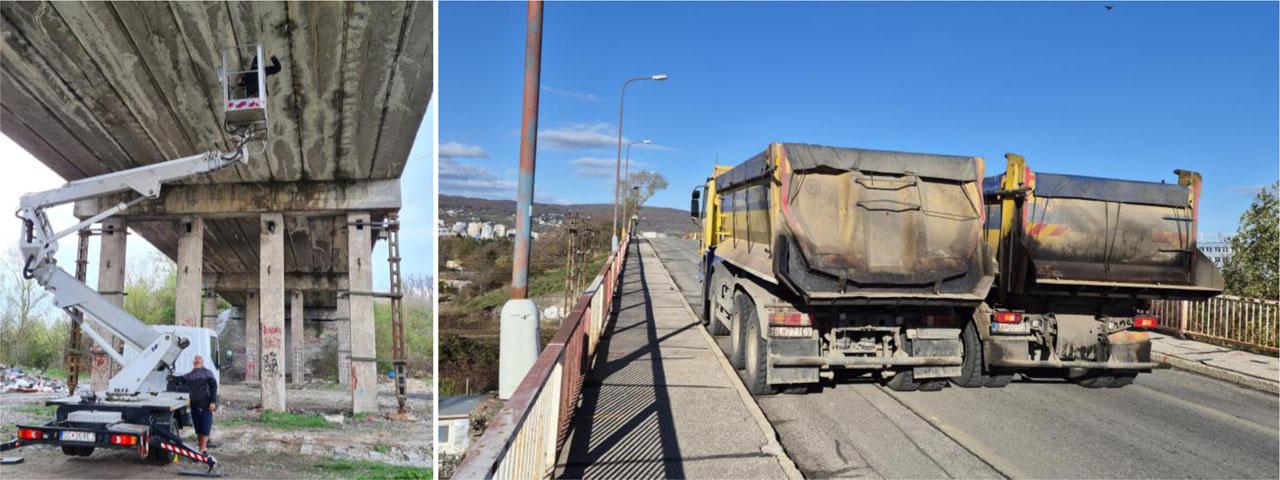
a) Detailed inspection of critical sections, b) the most unfavourable position of the load during the load test
Extending the operation of existing bridges can be the only way to maintain road traffic in some regions, which can save money and time for the inhabitants, and CO2 emissions due to long detours, or allow getting time for their reconstruction or the design of a new bridge. The tools for solving the described problems of existing concrete bridges for extending the operation ability are a technical inspection, detailed diagnostics, assessment of load-bearing capacity and monitoring of the behaviour of bridge structures during their extended operation.
The current state of the described bridge structure is stabilized, with the last control load test and dynamic measurement, carried out in November 2024, showing only a small deterioration in the condition of the bridge structure, which allows for the extension of its operation for another two years and thus creates the time needed to complete the construction procedure associated with the construction of the new bridge.