

Sagaing City, located in Myanmar, is located near the Sagaing Fault, one of the country's most active seismic zones. The region has experienced significant seismic events, including the 1839 Ava earthquake, which caused extensive damage, and more recent tremors that have heightened concerns about the vulnerability of the city's infrastructure (Hurukawa & Maung Maung, 2011). Earthquakes are natural phenomena that occur due to various factors, including tectonic plate movements in the crust, volcanic eruptions, and even human-induced activities such as mining and reservoir-induced seismicity (Tanjung et al., 2024). The majority of earthquakes, however, are explained by plate tectonics, where the Earth's crust is divided into large tectonic plates that move over time (Masrilayanti, 2024). The relative movement of these plates along faults such as the Strike-Slip fault of the Sagaing Fault that results in seismic events (Htay et al., 2024). The Sagaing Fault is classified as a Strike-Slip fault and is divided into five segments, with two scenario earthquakes considered at the maximum probable magnitude for the Sagaing segment. This fault generates significant seismic activity, with ground accelerations ranging from 0.4 to 0.6g, posing a substantial risk to the city (MYO AUNG, 2012). Earthquakes can be classified into different types based on their occurrence relative to the main seismic event: foreshocks, mainshocks, and aftershocks. In addition, near-fault ground motions: those that occur close to an active fault have unique characteristics such as long-duration velocity pulses and higher peak ground accelerations, which contribute to the vulnerability of structures in these areas (Xiong et al., 2017).
Seismic hazards pose significant threats to the structural integrity of Sagaing's buildings, particularly those of historical value. The city's location within an active seismic zone, coupled with the unique nature of near-fault ground motions, makes it crucial to assess the seismic vulnerability of its infrastructure (Somerville et al., 1999). Seismic assessments help in understanding how structures behave under such ground motions and provide vital data for enhancing the city's resilience to future earthquakes (Masrilayanti et al., 2021; Olivia & Mandal, 2005; Zuher et al., 2023). Seismic assessments are essential for identifying weaknesses in both modern and traditional construction methods, and for formulating strategies to reduce potential damage from future earthquakes, ensuring the protection of both public safety and cultural heritage (Nazri, 2018). This paper aims to compare the results of Incremental Dynamic Analysis and Pushover Analysis for assessing the structural vulnerability of buildings in Sagaing City. The study will focus specifically on the seismic performance of a bridge and its hollow pier, which serve as the primary structures for the analysis. By examining the impact of near-fault ground motions and seismic forces on both modern and historical structures, the study will provide a comprehensive comparison of the two methods, helping to determine the most effective approach for assessing and improving seismic resilience in the region. This comparison will contribute to the development of tailored risk mitigation strategies, addressing the unique seismic challenges faced by Sagaing City.
Incremental Dynamic Analysis is a dynamic, nonlinear analysis method that simulates the behavior of structures under various earthquake intensities (Vamvatsikos & Cornell, 2002). IDA accounts for the duration, frequency content, and energy of accelerograms, making it a more accurate representation of how structures perform under real earthquake conditions (Miari, 2019). Unlike traditional methods, IDA performs dynamic simulations to predict the maximum top-story displacement of structures, reflecting the nonlinear response to ground motion in greater detail (Shabani et al., 2023). The method produces IDA curves, which plot the relationship between the intensity measure (IM) and the engineering demand parameter (EDP), such as displacement or damage. A significant advantage of IDA is its ability to capture the effects of varying ground motion records, as structural behavior can significantly depend on the selected accelerogram. Multiple records are often used in IDA to generate more reliable results, producing a series of IDA curves that help in understanding the structure's performance across different scenarios (Kabir et al., 2019; Mangalathu et al., 2019). The example of incremental dynamic curves is shown in Figure 1.
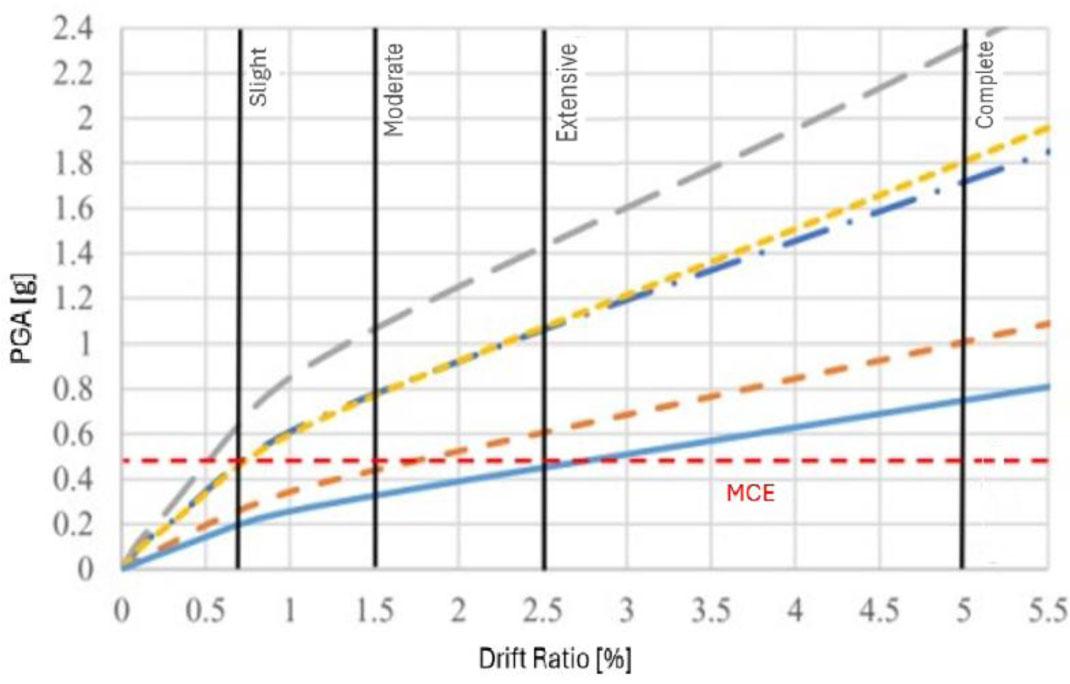
Example of IDA curve for pier under different earthquakes (Htay et al., 2025)
Pushover Analysis, on the other hand, is a static, nonlinear analysis that involves applying increasing lateral forces to a structure until it reaches a target displacement. This method is classified into two types: force-controlled and displacement-controlled (Farhan, 2020). The former applies incremental lateral forces, while the latter increments the displacement at the top story of the structure and the sample pushover analysis curve is shown in Figure 2. Pushover analysis helps in identifying the performance of structures at different displacement levels and is often used to predict seismic performance in terms of damage, such as plastic hinge formation (Chopra & Goel, 2002).
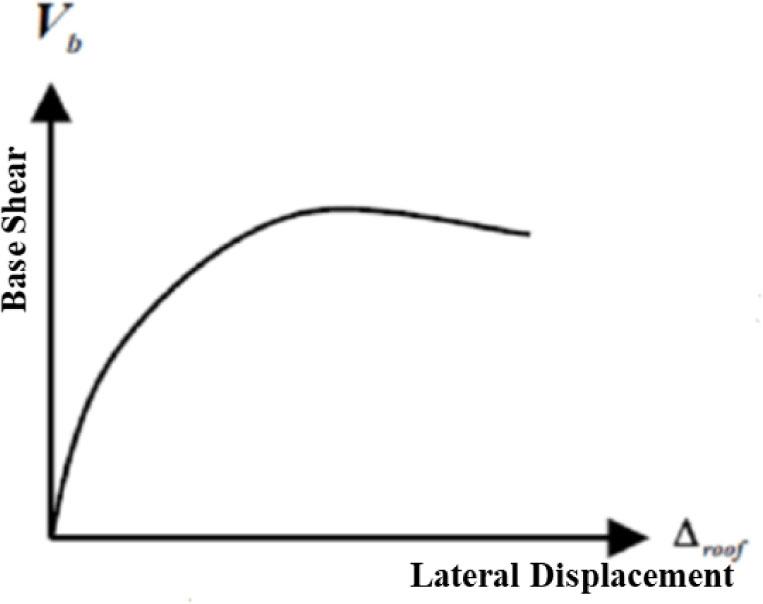
Examples of Capacity Curve (Farhan, 2020)
Several studies have compared IDA and Pushover analysis to evaluate the seismic performance of different structural models (Barbat et al., n.d.; Leslie, n.d.; Mitchell & Paultre, 1994). In the context of performance-based earthquake engineering, the role of IDA in developing fragility curves is crucial. According to a review by M. Miari and F. M. Nazri, IDA facilitates nonlinear response-history analyses that establish relationships between specific damage measures (DMs) and intensity measures (IMs), such as peak ground acceleration (PGA), providing an essential framework for assessing structural performance under seismic loading (Miari, 2019).
For instance, the design of reinforced concrete highway bridge piers following the seismic specifications of New Zealand, Japan, and Caltrans illustrates the application of IDA (Aldea et al., 2021; Chomchuen & Boonyapinyo, 2017). When designing for a Design Basis Earthquake (DBE), with a 10 percent probability of occurrence within a 50-year period and a PGA of 0.4g, the guidelines of these countries ensure that bridges will perform robustly, avoiding substantial damage (Zhong et al., 2019). IDA is therefore applied to evaluate the expected structural response and damage outcomes for highway bridges and piers under seismic loading (Liu et al., 2023). Additionally, a study on the seismic behavior of asymmetric multi-story buildings examines how structural eccentricity impacts ductility and torsional responses. Using static linear analysis, the study explores how changes in eccentricity and the L/D ratio affect story drift, inter-story drift, and resistance to seismic forces according to Indian Standard Codes. The results indicate that increased eccentricity leads to greater story drifts in buildings with larger L/D ratios, sometimes exceeding code limitations (Reyes et al., 2014). Another study examined seismic hazards, cross-border vulnerability, and risk levels for simply supported girder bridges, with results shown in fragility curves (Xhaferaj et al., 2021).
J. Leng, S. G. Buonopane, and B. W. Schafer emphasize the importance of more detailed modeling in the seismic design of cold-formed steel (CFS) framed buildings. Their research, which utilizes IDA to assess the seismic performance of a two-story CFS building designed to U.S. standards and tested on a full-scale shake table, shows that the structure exhibited greater stiffness and capacity than anticipated (Llanes-Tizoc et al., 2019). The building sustained only minor cosmetic damage even under seismic loads exceeding the Maximum Considered Earthquake (MCE) for high seismic zones. Pujari et al. (2014) explore the seismic fragility of nuclear power plants (NPPs) using IDA (Pujari et al., 2014). Their study highlights the advantages of this approach, which employs multiple nonlinear response-history analyses with incremented ground acceleration data.
Nonlinear static analysis, commonly referred to as pushover analysis, is a technique used to evaluate a structure's nonlinear deformation capacity by applying a monotonic lateral force until the structure experiences yielding or failure (Farhan, 2020; Awchat et al., 2023). Unlike dynamic analysis, it is time-independent and does not account for time-varying effects, focusing solely on the structure's response to static loads. Pushover analysis is particularly useful for identifying the location of yielding and determining the failure mechanism of the structure. Additionally, pushover analyses are often employed to model the response of reinforced concrete bridge piers, simplifying their behavior into a single-degree-of-freedom system. Karim and Yamazaki in 2003 used pushover analysis to determine the first yield point of a structure for fragility curve development. The analysis assumes that the structure's response is governed primarily by its fundamental mode (Karim & Yamazaki, 2003). However, pushover analysis does not consider the effects of time history, duration, or frequency content of the ground motion, which limits its ability to fully capture the dynamic behavior of structures. While Pushover analysis provides an estimate of the maximum displacement for a given seismic load, it tends to underestimate the peak responses when compared to dynamic analysis like IDA.
This study adopts a comparative analytical approach to evaluate the seismic vulnerability of structures in Sagaing City, Myanmar, which is situated near the active Sagaing Fault. Given the high seismic risk due to the fault's strike-slip characteristics and historical records of destructive earthquakes, the research is designed to analyze the performance of structural systems under seismic loading, with particular focus on near-fault ground motions.
The research focuses on two principal structures: a bridge and its associated hollow pier, selected due to their representative structural features and critical importance in urban connectivity and safety. These structures will undergo detailed seismic analysis using two widely recognized nonlinear analysis techniques. To simulate realistic seismic conditions, a suite of ground motion records will be selected, emphasizing near-fault characteristics typical of the Sagaing Fault zone. These include long-period velocity pulses and high peak ground accelerations, which are critical factors influencing structural response. The selection of ground motions will follow established criteria to ensure compatibility with the expected seismic hazard levels in Sagaing, particularly those reflecting the 0.4–0.6g ground acceleration range reported in the literature.
Structural modeling and analysis will be conducted using advanced finite element software capable of performing both nonlinear static and dynamic analyses. The models will incorporate material nonlinearities, geometric properties, and realistic boundary conditions. Comparative performance metrics such as base shear, inter-story drift, plastic hinge formation, and damage indices will be derived from both analysis methods. The findings from this comparative study will help to identify the advantages and limitations of each analysis method within the context of Sagaing's seismic risk. Furthermore, the results will contribute to evidence-based decision-making in the development of seismic design guidelines and retrofitting strategies for both modern infrastructure and culturally significant buildings. By grounding the research in the local seismic context and infrastructure needs, the study aims to provide actionable insights for enhancing structural resilience in Sagaing City.
The analyzed structure is a multi-span reinforced concrete highway bridge. consisting of five spans measuring 38.1 m, 38.7 m, 38.7 m, 38.7 m, and 42.0 m, for a total length of 196.2 meters and a width of 26.9 meters. It is supported by rectangular hollow piers of varying heights. The columns have dimensions of 1.25 meters in height and 0.40 meters in width, while the bridge deck comprises monolithic slabs with a thickness of 0.25 meters. The elevation view and modeled representation of the bridge, along with the required section details, are illustrated in the accompanying Figure 3. The specific configurations and pier data for the bridge are summarized in Table 1.

Multi-Span Reinforced Concrete Bridge (Unit in meter)
Bridge Pier Configurations
| Pier | Height [m] | Pier cross-sectional dimensions [m] | Longitudinal reinforcement | Transverse reinforcement | ||||||
|---|---|---|---|---|---|---|---|---|---|---|
| Section | b | h | t | Main | Stirrup | |||||
| Pier1 | P1a | P1b | 29.338 | Rectangular Hollow | 3.1 | 3.6 | 0.5 | 140D22 | D16-100 | D13-250 |
| Pier 2 | P2a | P2b | 42.810 | Rectangular Hollow | 3.1 | 3.6 | 0.5 | 112D22 | D16-100 | D13-250 |
| Pier 3 | P3a | P3b | 42.810 | Rectangular Hollow | 3.1 | 3.6 | 0.5 | 112D22 | D16-100 | D13-250 |
| Pier 4 | P4a | P4b | 46.451 | Rectangular Hollow | 3.1 | 3.6 | 0.5 | 100D13 | D16-100 | D16-250 |
The bridge model in this study was developed and analyzed using SeismoStruct 2022, a Finite Element analysis software capable of simulating the response of structures under significant displacements due to static or dynamic loading while accounting for geometric nonlinearity and material inelasticity (Rakshe, n.d.). The modeling process consists of three primary modules: The Pre-Processor, the Processor, and the Post-Processor.
For this study, the Mander et al. nonlinear concrete model (con_ma) was used, with concrete compressive strength of 45 MPa and steel tensile strength of 500 MPa. The piers were modeled as inelastic force-based frame elements, while other components, such as pier heads, diaphragms, girders, and decking systems, were treated as elastic frame elements (Kabir et al., 2019). The bridge deck was connected to the pier tops using rigid links, assuming a monolithic structure. Pier bases were modeled as fixed supports, while the abutments were considered simply supported. Loading definitions included the bridge's weight for nonlinear static pushover analysis and both its own weight and seismic loadings for nonlinear incremental dynamic analysis. Traffic loads were excluded. The analysis was performed using the SI unit system, with input criteria outlined in a flow chart illustrating the modeling process. In the Processor module, the structural analysis was performed after all input criteria were specified. The model was subjected to static and dynamic loading scenarios, ensuring convergence and accuracy in the results. This module verified the structural behavior under the applied loading conditions.
Finally, the Post-Processor module provided a comprehensive set of 12 outputs, including analysis logs, eigenvalue results, target displacements, step outputs, deformed shape visualization, action effects diagrams, stress-strain outputs, and global response parameters. These outputs enabled a detailed assessment of the bridge's performance, capturing both local and global response characteristics under various loading conditions. Together, these modules ensured an accurate and efficient modeling and analysis process for the bridge. The model bridge is shown in Figure 4.
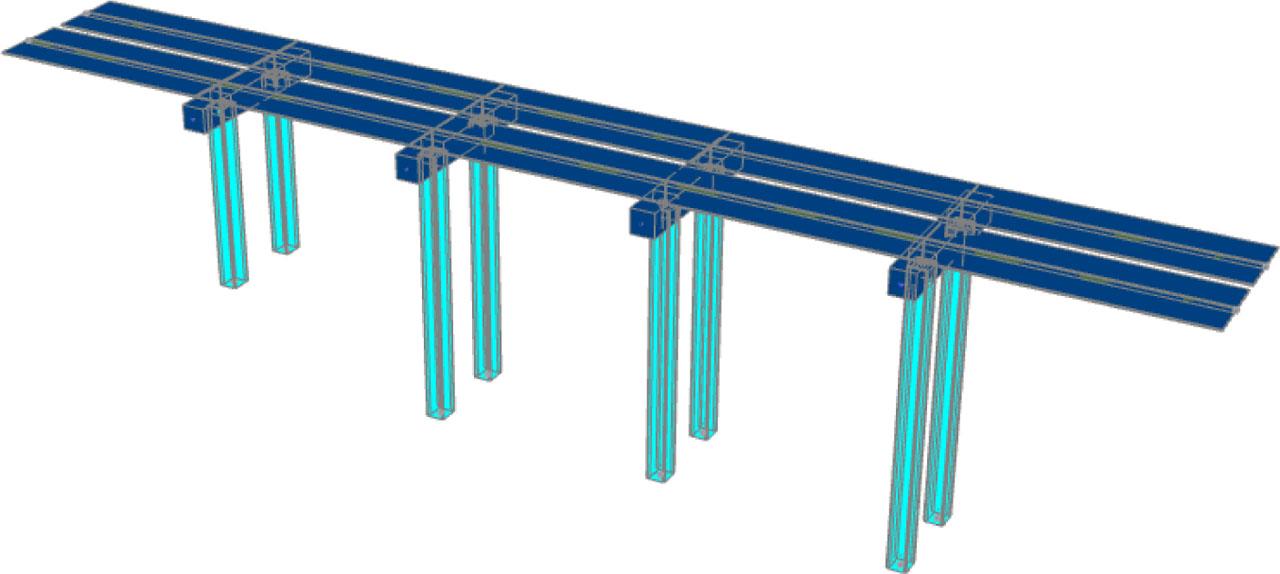
Multi-span reinforced concrete bridge modeling by SeismoStruct 2022 (Seismosoft Earthquake Engineering Software Solutions, n.d.)
Based on the Myanmar National Building Code, MNBC2020 (MNBC, 2020., n.d.), the synthetic time history curve for Sagaing City is developed and is shown in Figure 5.
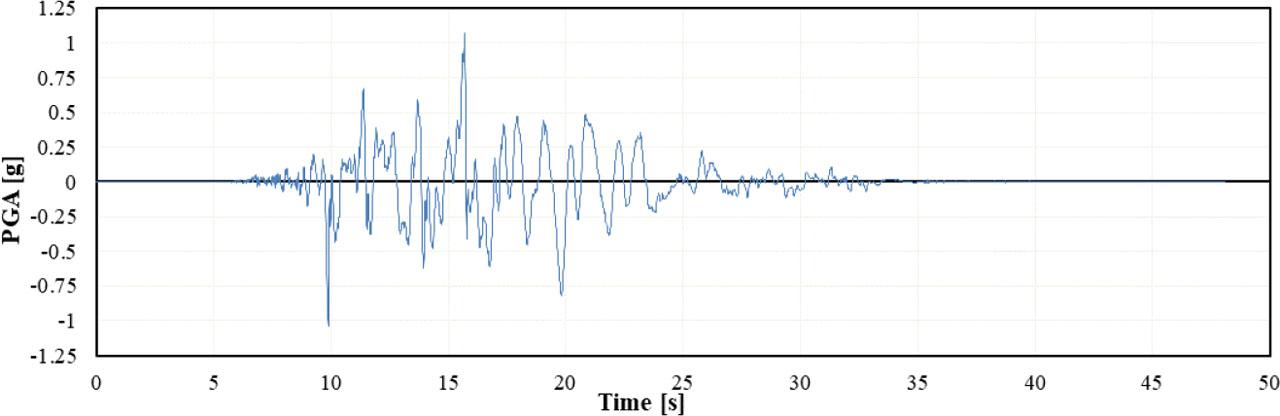
Sagaing City Time History Curve
Ground motion records from past earthquakes were obtained from the Pacific Earthquake Engineering Research (PEER) database. The selection criteria required the earthquakes to have a distance of 0 to 20 km from the site, pulse-like ground motion characteristics, forward directivity effects, strike-slip or reverse oblique fault types, and a minimum magnitude of 6.0 Mw (PEER Ground Motion Database - PEER Center, n.d.). The selected earthquakes include the Big Bear Earthquake, Kobe Earthquake, among others, tabulated in Table 2.
Earthquakes Used in Incremental Dynamic Analysis
| No. | Year | Name of Earthquake | Magnitude, [Mw] | Joyner-Boore distance, Rjb [km] | Damping [%] |
|---|---|---|---|---|---|
| 1 | 1966 | Parkfield | 6.19 | 17.64 | 5 |
| 2 | 1989 | Loma Prieta | 6.93 | 11.03 | 5 |
| 3 | 1992 | Big Bear | 6.46 | 7.31 | 5 |
| 4 | 1994 | Northridge-01 | 6.69 | 12.39 | 5 |
| 5 | 1995 | Kobe, Japan | 6.9 | 11.34 | 5 |
| 6 | 1999 | Duzce Turkey | 7.14 | 9.14 | 5 |
| 7 | 2008 | Iwate Japan | 6.9 | 11.68 | 5 |
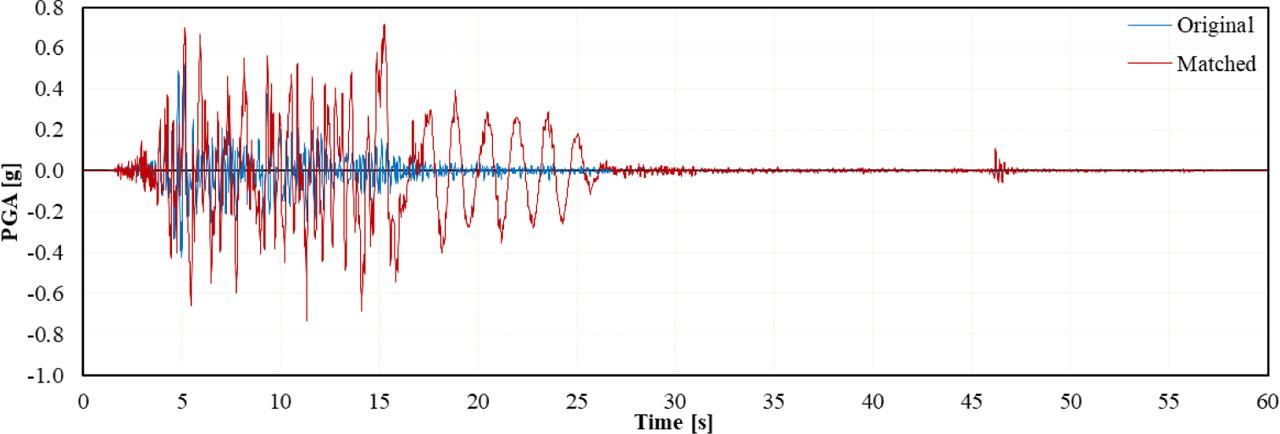
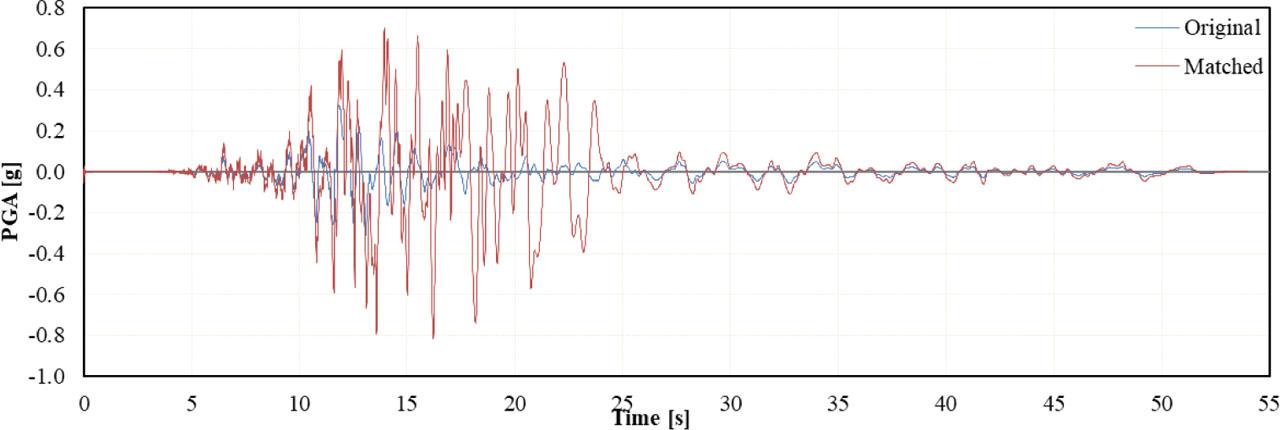
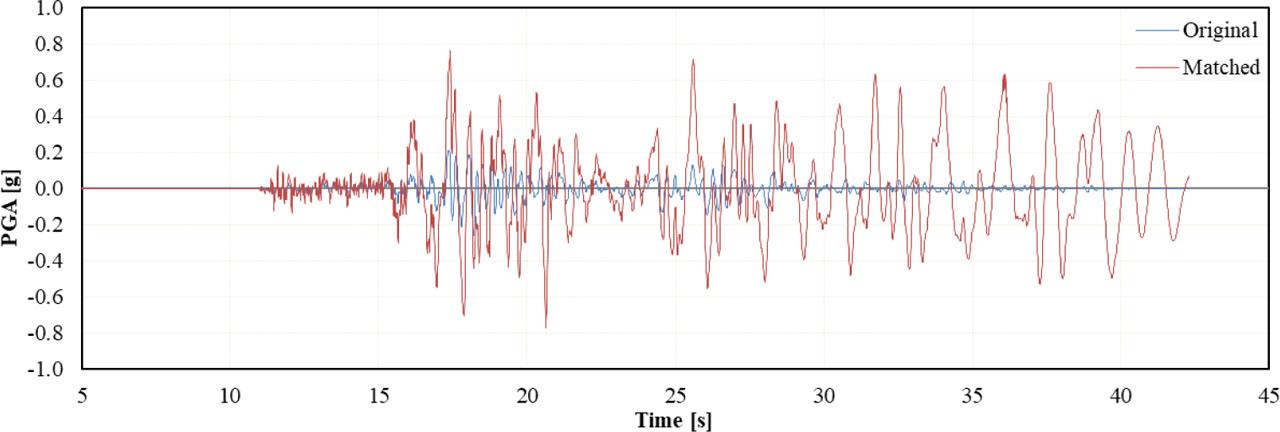
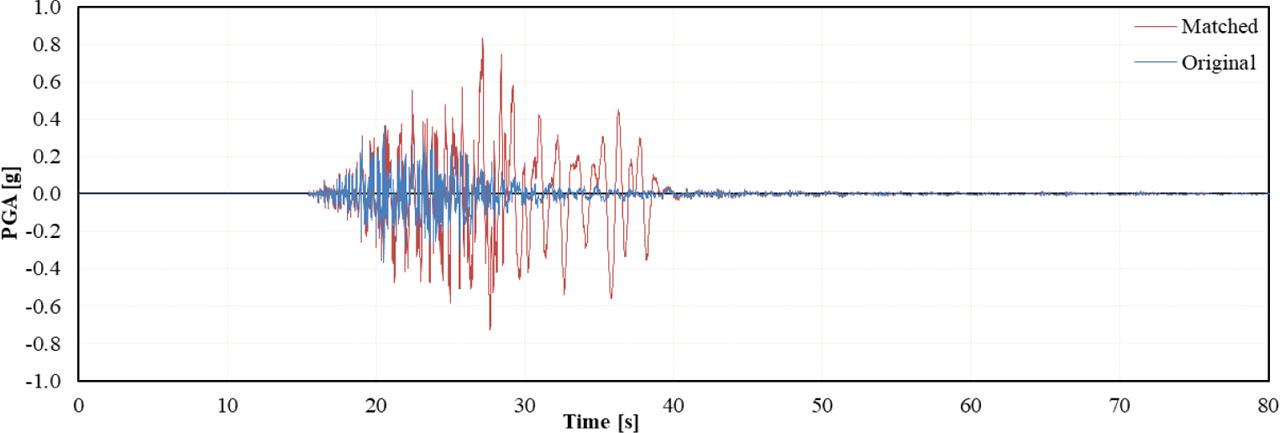
After selecting the time history curves, the ground motions are matched with the applied target spectrum to adjust the acceleration to the past earthquake shown in Table 2 with the target area, Sagaing City. For matching the time history curves, SeismoMatch 2023 is used. The scale curves are shown in Figures 6 – 13.
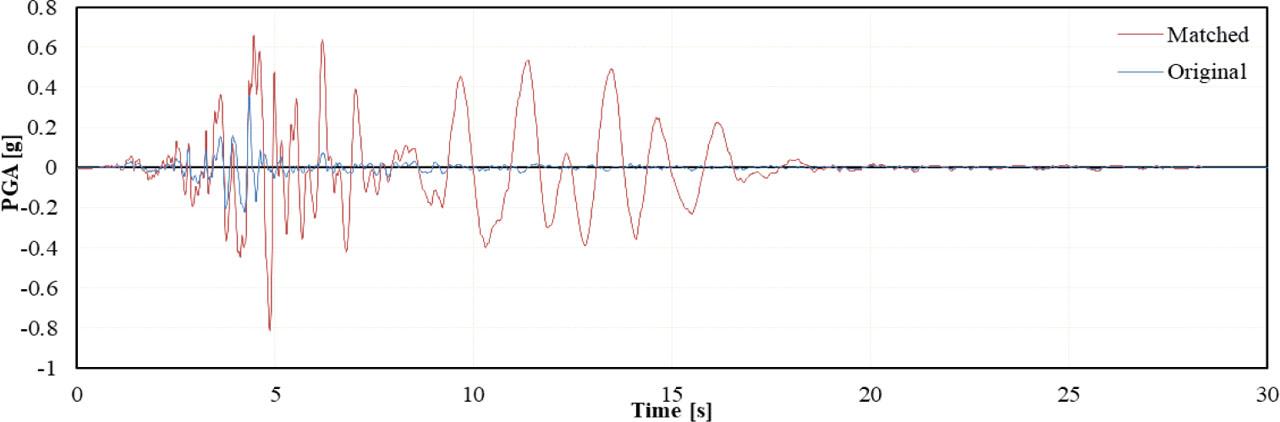
Comparison of time history curves with Sagaing City and Parkfield Earthquake
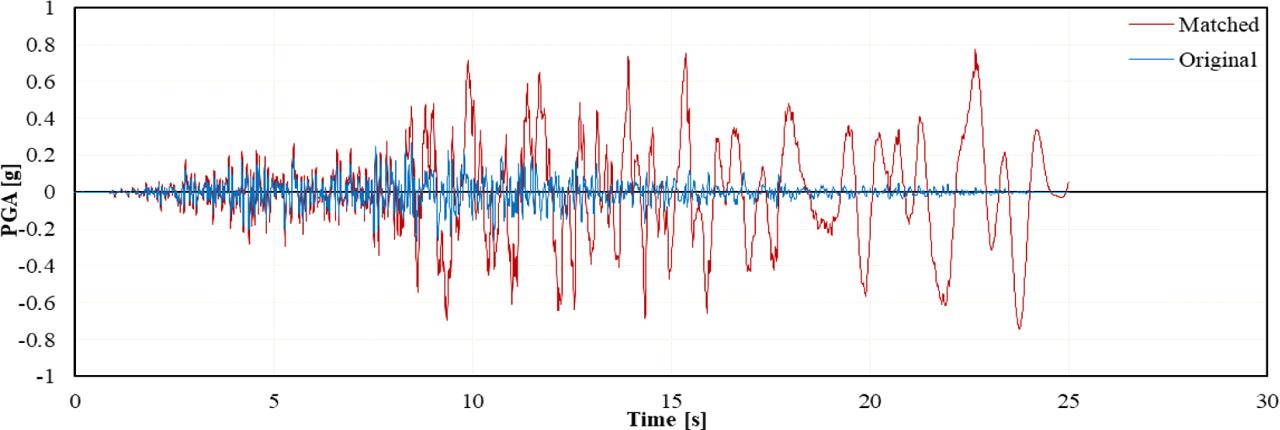
Comparison of time history curves with Sagaing City and Loma Prieta Earthquake

Comparison of time history curves with Sagaing City and Big Bear Earthquake
Comparison of time history curves with Sagaing City and Northridge-01 Earthquake
Comparison of time history curves with Sagaing City and Kobe Earthquake
Comparison of time history curves with Sagaing City and Duzce Turkey Earthquake
Comparison of time history curves with Sagaing City and Iwate Japan Earthquake
For each scaled ground motion record, a nonlinear time history analysis to simulate the dynamic response of the structure under increasing seismic intensities is conducted. The analysis involves applying the scaled ground motion as input to the structural model and solving the equations of motion to capture the time-dependent behavior. Key engineering demand parameters (EDPs), such as maximum displacement, inter-story drift ratio, or base shear, are extracted for each intensity level. Advanced numerical solvers in finite element software handle the integration of these equations, ensuring the accurate capture of nonlinear phenomena such as material yielding, stiffness degradation, and energy dissipation. The analysis is repeated for every scaling increment until the structure reaches a predefined performance limit or experiences instability, such as dynamic collapse or excessive deformations.
The main findings highlight the complementary roles of Incremental Dynamic Analysis and Pushover Analysis in assessing seismic performance. IDA captures dynamic, time-dependent structural responses to increasing seismic intensities, effectively illustrating elastic behavior, nonlinear transitions, and collapse thresholds. In contrast, POA offers a simplified, static approach, identifying key capacity points such as yield displacements and peak base shear values with lower computational demand. For instance, the IDA results from the Duzce Earthquake showed rapid collapse due to high energy input, while the Big Bear Earthquake demonstrated a more gradual drift progression, indicating better accommodation of seismic demands. POA analysis revealed specific values like a yield displacement of 0.135 meters and a peak base shear of approximately 260,000 kN at 0.255 meters, emphasizing the ultimate strength and stiffness degradation under lateral loads.
Using the results from IDA, plot the IDA curves for each ground motion record. The x-axis represents the intensity measure (IM) of the seismic input, Peak Ground Acceleration (PGA) while the y-axis displays the corresponding EDP, drift ratio. For every scaled intensity, the response of the structure is plotted, creating a curve that illustrates the relationship between seismic intensity and structural demand. Repeat this process for all selected ground motion records to generate a family of IDA curves, capturing the variability in structural behavior due to different seismic inputs. The incremental dynamic analysis curves of the bridge structure for Pier 1 under Sagaing City based on eight seismic excitations are figured in Figure 14.

Incremental dynamic analysis curves of Pier 1
In pushover analysis, lateral loads are incrementally increased from zero until the desired displacement or force is reached, employing force- or displacement-based methods or other appropriate numerical techniques for nonlinear static analysis at each load step. The results, such as force-displacement curves, are then analyzed to determine the bridge's ultimate capacity and failure mode. The yield points in the seismic performance are identified based on these results, which are further utilized to assess the probability of seismic damage levels in bridge piers over 50 years using fragility curves. Specific considerations in pushover analysis include developing an accurate model of the structure, applying target displacements only to the top nodes of piers, and recognizing that target displacements vary based on pier height and direction. According to the American Society of Civil Engineers, ASCE guidelines, these displacements range from 1% to 2% of pier heights (American Society of Civil Engineers, 2017). For instance, displacements are incrementally increased by 0.001 meters at the pier's top nodes in the transverse direction to reach a target displacement of 0.7 meters in the longitudinal direction, typically achieved in 100 steps. Yield displacement is identified during this process. Finally, the nonlinear static pushover analysis is executed, and capacity curves are used to determine the structure's seismic yield points and overall performance.
As the lateral displacement targets are incrementally adjusted, the structural responses are systematically analyzed in terms of maximum and yield displacements along both the x-axis and y-axis. A detailed evaluation of each pier reveals that, despite differences in their respective heights, the maximum and yield displacement values remain consistent across all piers. These findings indicate that the nodes' maximum and yield displacements along both axes demonstrate uniformity, even when varying target displacement values are applied to different piers. However, it is noteworthy that the tallest pier, Pier 4, requires a higher target displacement to achieve maximum and yield displacements compared to the shortest pier, Pier 1. The analysis of maximum drifts across different piers revealed that Pier 1 exhibited the highest drift among all. The maximum drift for each pier was determined by calculating the ratio of the top displacement to the pier's signed target displacements and corresponding results are summarized in Table 3.
Displacement results from pushover analysis
| Pier | Base Shear [kN] at | Target displacement [m] at | Maximum displacement [m] at | Yield displacement [m] at | Maximum Drift [%] | |||||
|---|---|---|---|---|---|---|---|---|---|---|
| x-direction | y-direction | x-direction | y-direction | x-axis | y-axis | x-axis | y-axis | x-axis | y-axis | |
| Pier1 | 350280.41 | 0.5 | 0.2553 | 0.525 | 0.135 | 0.199 | 0.87 | 1.79 | ||
| 301893.19 | 0.35 | 0.2526 | 0.352 | 0.135 | 0.188 | 0.86 | 0.46 | |||
| Pier2 | 350287.22 | 0.55 | 0.2553 | 0.525 | 0.135 | 0.199 | 0.60 | 1.23 | ||
| 301889.28 | 0.38 | 0.2526 | 0.352 | 0.135 | 0.188 | 0.57 | 0.82 | |||
| Pier3 | 350287.22 | 0.55 | 0.2553 | 0.525 | 0.135 | 0.199 | 0.60 | 1.23 | ||
| 301889.28 | 0.38 | 0.2526 | 0.352 | 0.135 | 0.188 | 0.57 | 0.82 | |||
| Pier4 | 354232.46 | 0.6 | 0.2553 | 0.525 | 0.135 | 0.199 | 0.55 | 1.13 | ||
| 301888.15 | 0.45 | 0.2526 | 0.352 | 0.135 | 0.188 | 0.54 | 0.70 | |||
Building on findings from previous scholarly research, longer piers are generally associated with higher damage rates. As a result, it is inferred that the shortest pier is more likely to collapse before the tallest pier reaches its designated target displacement. Therefore, Pier 1 has been chosen for seismic evaluation using fragility curves. The capacity curves of the bridge structure corresponding to longitudinal target displacements and transverse target displacements are illustrated below.
The Incremental Dynamic Analysis results for various earthquakes offer critical insights into how different seismic characteristics influence structural response and performance. Each ground motion scenario, shaped by its intensity, frequency content, and duration, reveals unique vulnerabilities and strengths in structural systems: particularly in reinforced concrete bridges. For instance, high-energy near-fault earthquakes such as Duzce and Northridge challenge ductility and lateral stiffness, leading to rapid nonlinear drift escalation and potential collapse. In contrast, events like the Big Bear Earthquake exhibit more gradual drift behavior, indicating a greater ability of the structure to accommodate incremental demands when properly detailed. These variations underscore the importance of site-specific seismic assessments and tailored design strategies. The differences in drift thresholds, energy dissipation patterns, and directional dependencies observed across earthquakes highlight how seismic demands are not uniform and must be met with performance-based approaches in structural engineering. This comprehensive understanding sets a foundation for interpreting the complementary findings from Pushover Analysis, which, while static in nature, further refines capacity evaluations through direction-specific displacement thresholds and stiffness degradation. the implications of the results, their significance, and possible interpretations.
According to the IDA curves for the analyzed earthquakes provide critical insights into structural performance under varying seismic intensities, reflecting both elastic and nonlinear responses, as well as potential collapse thresholds. Each curve demonstrates a unique progression, shaped by the earthquake's energy, duration, and frequency content. For example, the Duzce Earthquake, with its higher PGA threshold for nonlinear behavior (0.5g to 1.5g) and a steep drift escalation post-collapse, indicates a significant energy input, which can challenge the structural ductility and reserve capacity of reinforced concrete bridges (Olivia & Mandal, 2005). This suggests that structures in regions exposed to similar seismic profiles must prioritize robust detailing and ductile design to sustain such demands. The Parkfield Earthquake, characterized by a relatively moderate PGA range for nonlinear behavior (0.5g to 1.2g), showcases an abrupt transition into higher drifts, indicative of less gradual energy dissipation. This points to potential vulnerabilities in structures with limited redundancy or insufficient lateral stiffness. On the other hand, the Big Bear Earthquake demonstrates a gradual drift progression, suggesting that structures might withstand incremental seismic demands more effectively, provided they are designed with adequate deformation capacity.
The Kobe Earthquake highlights the challenges posed by high-intensity ground motions near the collapse threshold (1.75g), with drifts climbing to 0.2%. This curve reflects the earthquake's destructive power, emphasizing the need for stringent seismic detailing and resilience strategies in high-seismic regions. Similarly, the Northridge Earthquake, with its robust elastic range and steep nonlinear drift increments, underscores the damaging potential of near-fault ground motions, which demand enhanced energy dissipation mechanisms in structural systems. For earthquakes such as the Loma Prieta and Imperial Valley Earthquakes, the IDA curves illustrate relatively lower drift demands at similar PGA levels compared to near-fault events. This suggests that while the immediate structural demands may be lower, the cumulative effect of prolonged ground motion could still challenge fatigue resistance and long-term performance. The smoother drift progression observed in these cases highlights the importance of maintaining adequate strength and stiffness to handle extended durations of shaking.
The Iwate and Sagaing Earthquakes further underscore the influence of frequency content and ground motion characteristics on structural response. The steep drift escalations in nonlinear regions highlight scenarios where resonance or low damping capacity could amplify structural displacements. These patterns reinforce the need for tailored seismic mitigation measures, such as energy-dissipating devices or tuned mass dampers, to address specific seismic threats.
In summary, the distinct behaviors of these IDA curves not only emphasize the need for site-specific seismic assessments but also highlight key areas for improvement in design codes. Structures in near-fault regions require enhanced ductility and energy dissipation, while those in far-field regions must focus on fatigue resistance and durability. This detailed analysis provides a foundation for informed decision-making in seismic design and retrofitting, ultimately enhancing the resilience of critical infrastructure in earthquake-prone areas.
In the longitudinal capacity curve illustrated as can be seen in Figure 15, the structural response of the bridge to lateral displacement is analyzed along both the longitudinal (x-axis) and transverse (y-axis) directions. The curve representing the longitudinal axis shows that the structure reaches its yield displacement at approximately 0.135 meters, after which the load-bearing capacity continues to increase until it peaks at a base shear of about 260000 kN at a maximum displacement of 0.2553 meters. Beyond this peak, the curve displays a slight descending trend, indicating a reduction in stiffness as the structure undergoes inelastic deformation, suggesting a potential softening or degradation of material properties under increasing lateral load. Conversely, the transverse axis demonstrates a different behavior. The yield displacement for the transverse direction is recorded at 0.199 meters, and the structure's capacity in this direction continues to increase steadily without a pronounced peak, reaching a maximum displacement of approximately 0.525 meters. This linear increase in the base shear along the transverse axis suggests a greater capacity for sustaining lateral loads in the transverse direction, likely due to inherent structural characteristics such as reinforcement configuration or pier orientation.
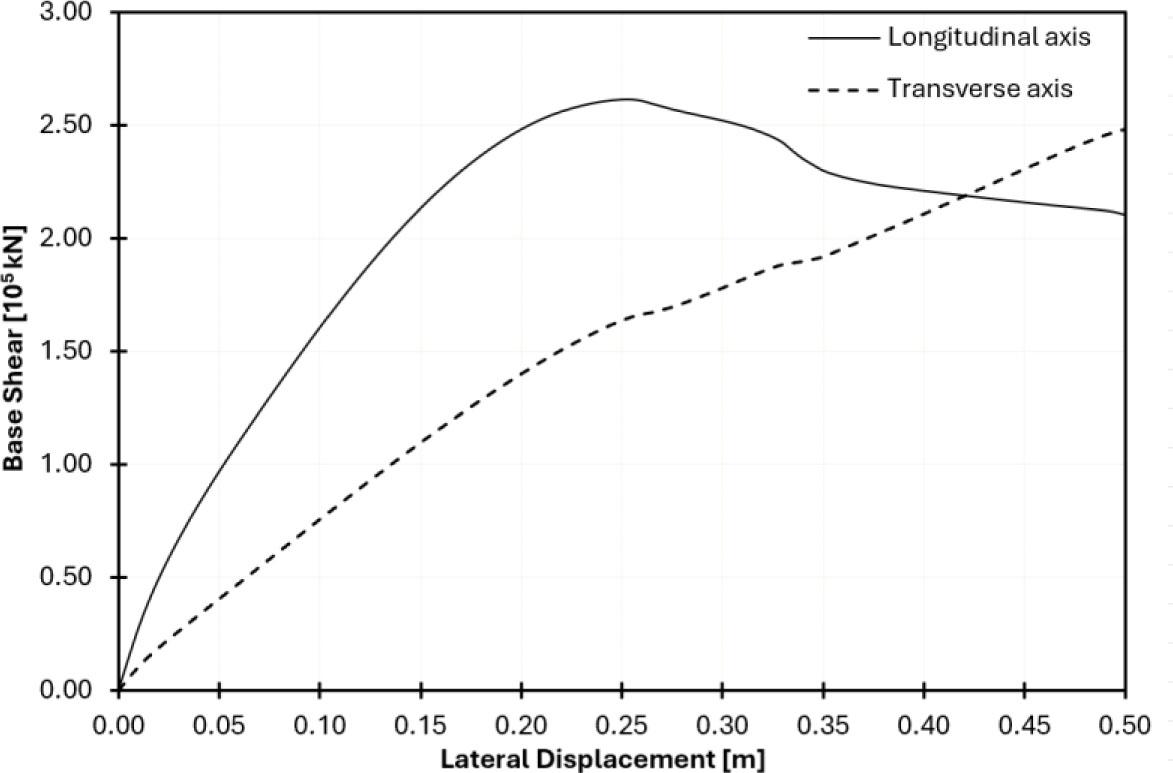
Longitudinal direction capacity curve
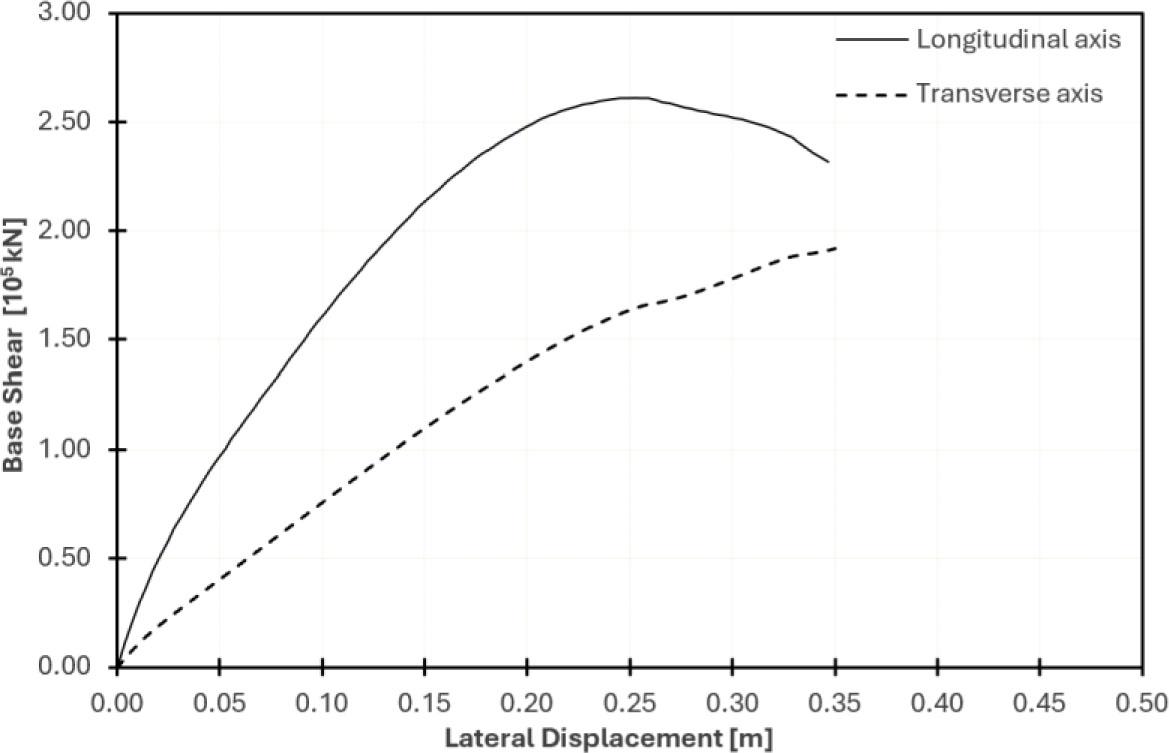
Transverse direction capacity curve
The contrasting behaviors observed in the longitudinal and transverse responses indicate a directional dependence on the bridge's capacity to resist lateral loads. The initial peak and subsequent decline along the longitudinal axis suggest a threshold beyond which further loading may lead to a reduction in structural integrity. In contrast, the gradual increase in the transverse response implies sustained load-bearing capacity under lateral loads, which may provide enhanced resilience in this direction during seismic events. These observations are critical for understanding the bridge's performance and inform the design and retrofit strategies for optimal seismic resilience.
In the transverse target direction capacity curve, the structure initiates yielding at a displacement of 0.135 meters along the longitudinal axis. The maximum displacement along this axis is achieved at approximately 0.2526 meters, marking the point at which the structure's load-bearing capacity in the longitudinal direction begins to plateau or diminish. For the transverse (y-axis) response, yielding begins at 0.188 meters, with the structure reaching its maximum lateral displacement at 0.352 meters. This indicates that the structure sustains a higher displacement threshold in the transverse direction before reaching its ultimate capacity, potentially reflecting the influence of structural configuration or reinforcement that favors deformation capacity in this direction. These distinctions in displacement behavior along the longitudinal and transverse axes underscore the directional variability in the bridge's structural response to lateral loading. The longitudinal axis exhibits an initial yield and subsequent peak displacement, which is lower than the maximum displacement in the transverse direction, suggesting a more limited deformation capacity in the longitudinal direction. This information is critical for understanding the bridge's response characteristics and can inform targeted reinforcement strategies to enhance resilience in specific loading directions.
The seismic performance of structures is often evaluated using Incremental Dynamic Analysis and Pushover Analysis, each offering unique insights into structural behavior (. IDA curves represent the response of a structure under dynamic seismic excitations, reflecting progressive damage as the intensity of ground motion increases. POA curves are derived from nonlinear static analyses, characterizing structural response to monotonically increasing lateral loads. While IDA incorporates time-dependent dynamic effects, offering a probabilistic understanding of performance, POA is simpler and less computationally demanding, focusing on static assumptions. In terms of structural capacity representation, IDA curves offer a dynamic perspective, detailing the elastic range, nonlinear behavior, and collapse thresholds under varying seismic demands. For example, the IDA results for the Duzce Earthquake show steep drift escalations and rapid collapse, highlighting significant energy input, while the Big Bear Earthquake demonstrates a gradual drift progression, suggesting better accommodation of incremental seismic demands. POA curves, on the other hand, provide explicit capacity points, such as the yield displacement of 0.135 meters along the longitudinal axis and a peak base shear of approximately 260,000 kN at 0.255 meters. These results emphasize the ultimate capacity and stiffness degradation under increasing lateral loads, complementing the dynamic insights provided by IDA curves.
Directional dependency is another key aspect captured by both methods. IDA curves reveal differences in structural behavior under longitudinal and transverse seismic demands. Near-fault events like the Northridge Earthquake exhibit steep nonlinear drifts, underscoring vulnerabilities in structural redundancy or lateral stiffness, while far-field events like the Loma Prieta Earthquake show smoother drift progressions, indicating lower peak demands but potential cumulative fatigue effects. POA curves reinforce these findings by demonstrating lower yield and ultimate displacements in the longitudinal direction compared to the transverse direction. This suggests limited deformation capacity along the longitudinal axis and sustained load-bearing capacity in the transverse direction, likely due to reinforcement configurations or structural orientation.
The analysis of energy dissipation and collapse mechanisms further differentiates the two methods. IDA curves directly capture dynamic energy dissipation and resonance effects, as observed in steep nonlinear drift escalations during the Iwate Earthquake. Collapse thresholds and fragility assessments provide detailed insights into failure mechanisms under real earthquake scenarios. In comparison, POA curves indirectly assess energy absorption through post-yield stiffness degradation and ultimate capacity points. The descending branches of POA curves indicate material softening and potential failure, offering a static perspective on collapse mechanisms that complements the dynamic insights from IDA.
In conclusion, the combined use of IDA and POA analyses provides a robust framework for assessing structural performance under seismic loads, particularly in regions like Sagaing City, which is prone to seismic activity due to its proximity to active fault lines. IDA highlights the dynamic demands of earthquakes, such as those with steep drift escalations caused by resonance or low damping, which are particularly relevant to Sagaing given its exposure to high-frequency ground motions. POA complements this by identifying static capacity limits and deformation thresholds, guiding targeted retrofitting strategies to enhance resilience. For Sagaing, these analyses underscore the critical need for tailored seismic designs that prioritize ductility, energy dissipation, and robust detailing to accommodate both near-fault and cumulative seismic demands. By leveraging the strengths of both approaches, structural systems in Sagaing can be optimized to withstand its unique seismic challenges, ensuring safety and durability in this high-risk region.