

Figure 1:
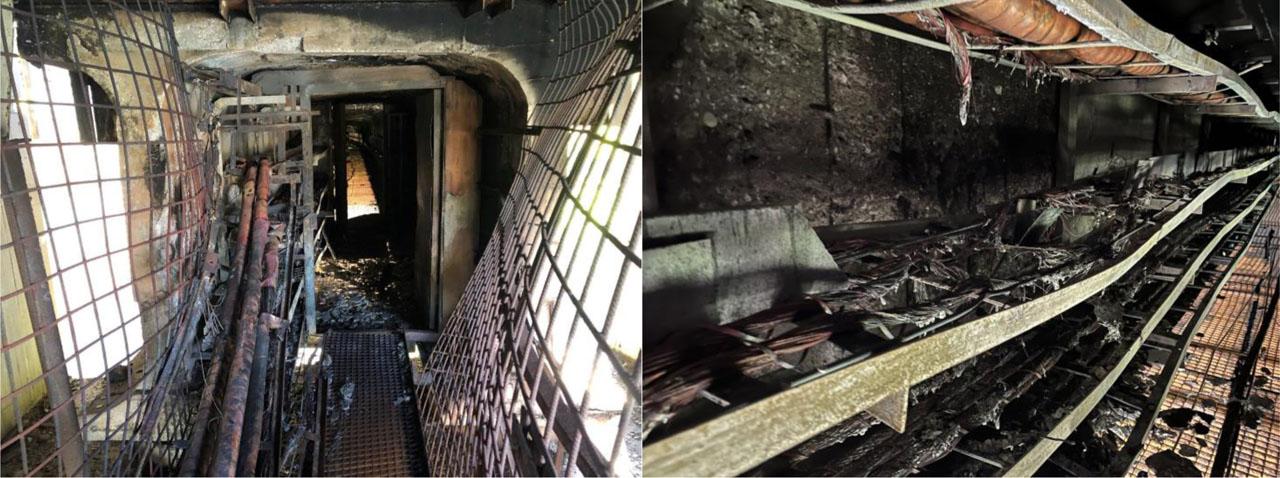
Figure 2:

Figure 3:
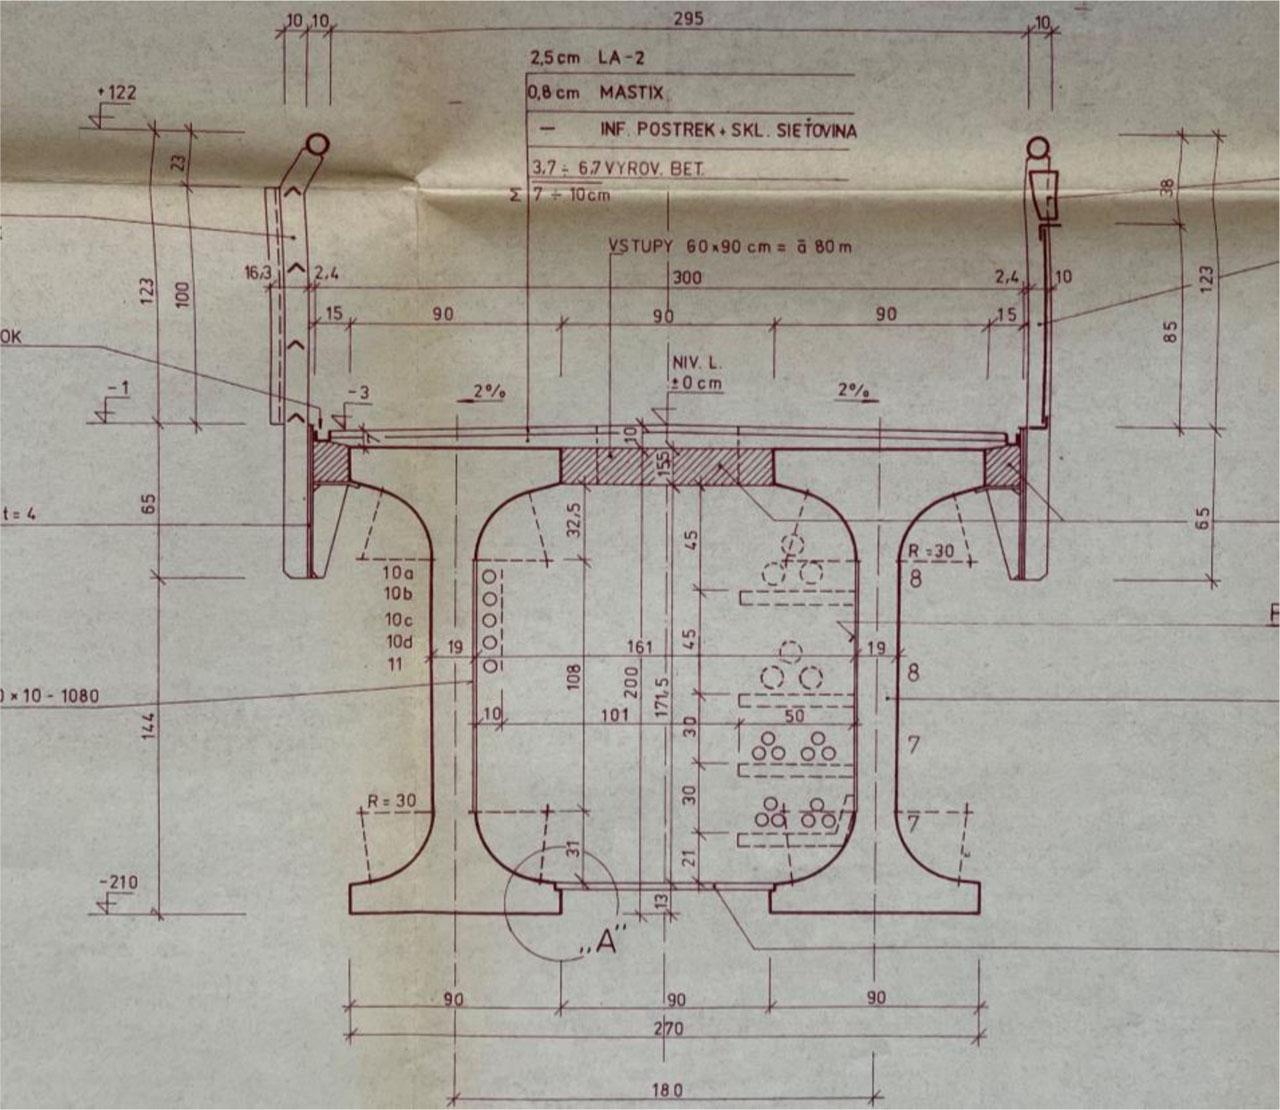
Figure 4:
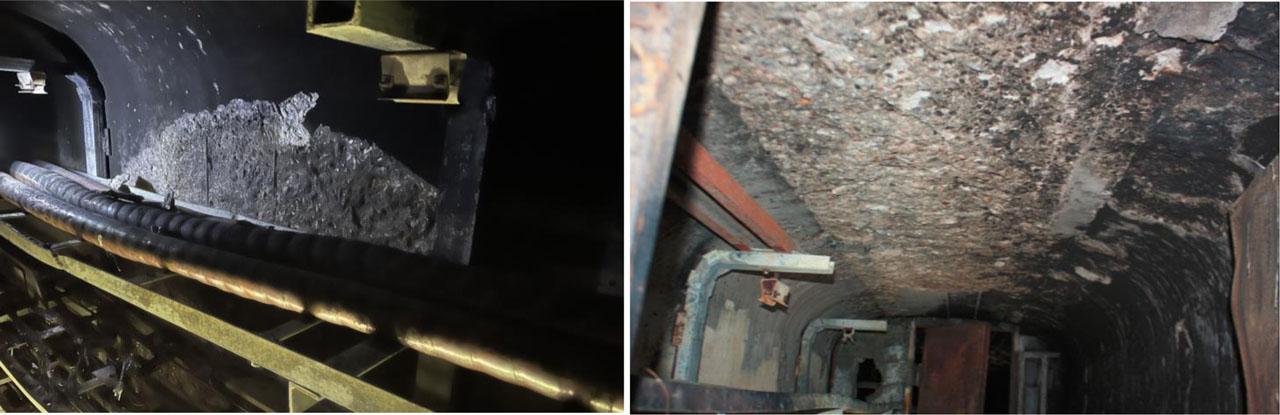
Figure 5:
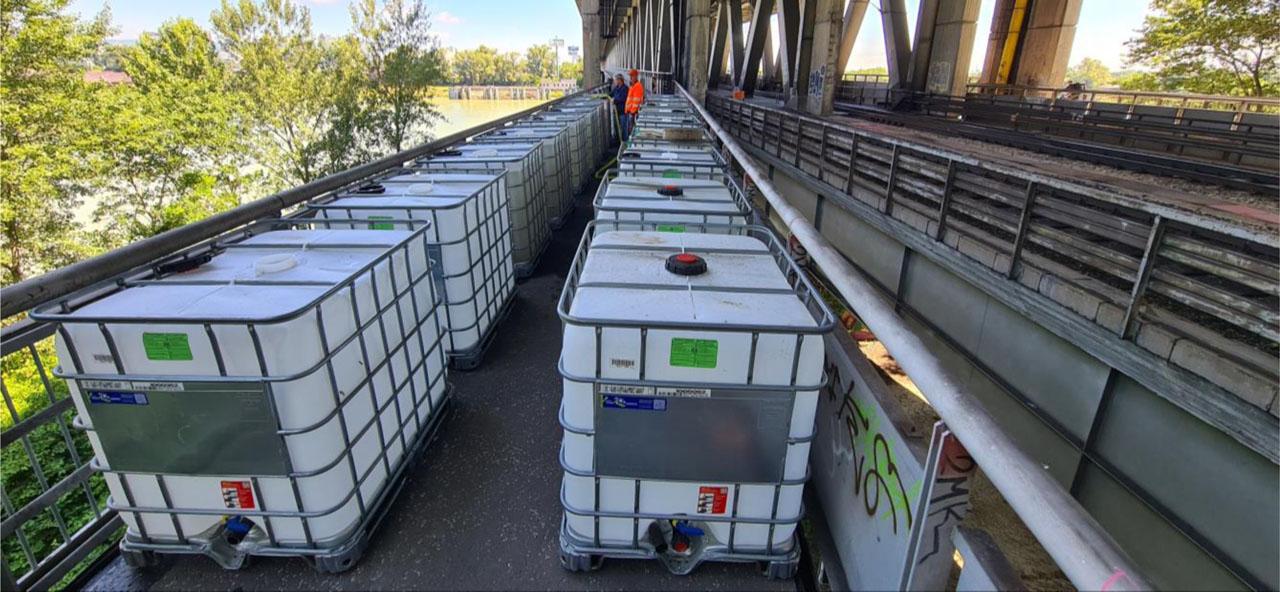
Figure 6:
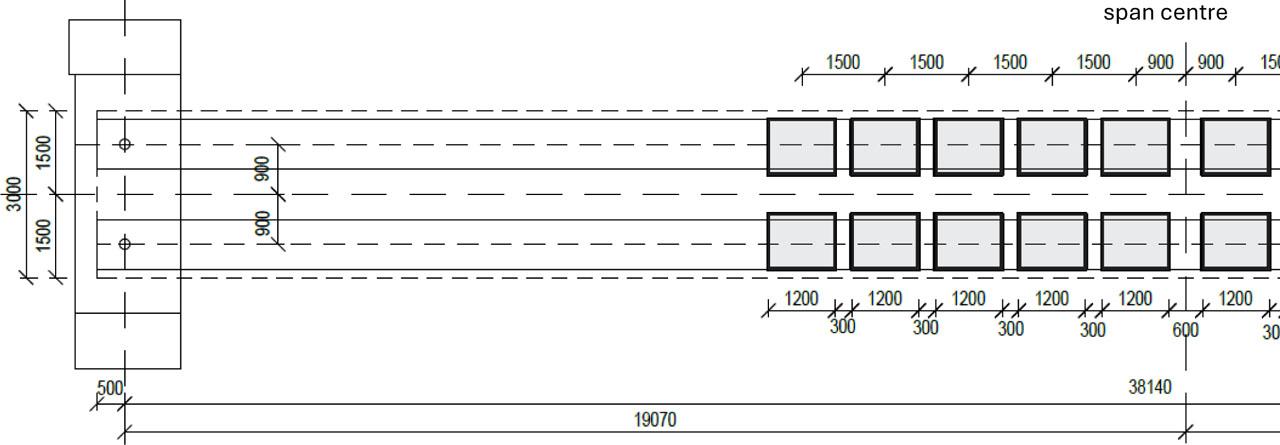
Figure 7:

Figure 8:

Relationship between fire temperature and thickness of concrete sparse layer
| Burning thickness [mm] | Field temperature [°C] |
|---|---|
| 1 – 2 | < 700 |
| 2 – 3 | 700 – 800 |
| 3 – 4 | 800 – 850 |
| 4 – 5 | 850 – 900 |
| 5 – 6 | 900 – 1000 |
| > 6 | > 1000 |
Measured concrete strength by the Schmidt hammer
| Placement | Beam | Surface | Cube strength [MPa] | Cylinder strength [MPa] | Ratio [%] |
|---|---|---|---|---|---|
| Web at centre of the fire | A | Inside | 43.6 | 37.03 | 85.4 |
| Web at centre of the fire | B | inside | 38.7 | 32.9 | 76.2 |
| Web at centre of the heat | A | outside | 47.34 | 40.24 | 92.8 |
| Web at centre of the heat | B | outside | 47.25 | 40.16 | 93.1 |
| Bottom flange at centre of the fire | B | outside | 50.49 | 42.92 | 99.4 |
| Un-affected web | A | Inside | 51.03 | 43.38 | 100 |
| Un-affected web | B | inside | 50.76 | 43.15 | 100 |
Prestressed strand strength after heating and cooling
| Gustaferro & Martin 1988 | EN 1992-1-2 (2023) | ||
|---|---|---|---|
| Temperature | [%] of initial strength | Temperature | [%] of initial strength |
| < 400 °C | 100 | 100 °C | 98 |
| ≈ 482 °C | 70 | 200 °C | 87 |
| ≈ 600 °C | 50 | 300 °C | 70 |
| 400 °C | 50 | ||
| 500 °C | 30 | ||
| 600 °C | 14 | ||
Comparison of measured and assessed deformations
| span | section | deflections [mm] | Ratio | Ratio | |
|---|---|---|---|---|---|
| predicted fpred | measured fmes | fmes/ fpred | N1/N2 | ||
| N1 | centre | 5.80 | 5.20 | 0.890 | 1.175 |
| centre −9.7 m | 4.00 | 3.38 | 0.845 | 1.153 | |
| N2 | centre | 6.40 | 4.80 | 0.754 | 1.0 |
| centre −9.7 m | 4.50 | 3.30 | 0.733 | 1.0 | |