

On April 21st 2022 at 10:30, set to fire high voltage electrical lines attached to the girders of the approach footbridge to the Harbour bridge in Bratislava. The electrical cable lines of 110 kV and 3×22 kV were placed inside the box cell of the footbridge structure, see Figure 1. The high temperature caused some structural damage to the structure, e.g. concrete spalling, changes in material properties of the concrete and probably in several inclined tendons passing through the girder’s web.
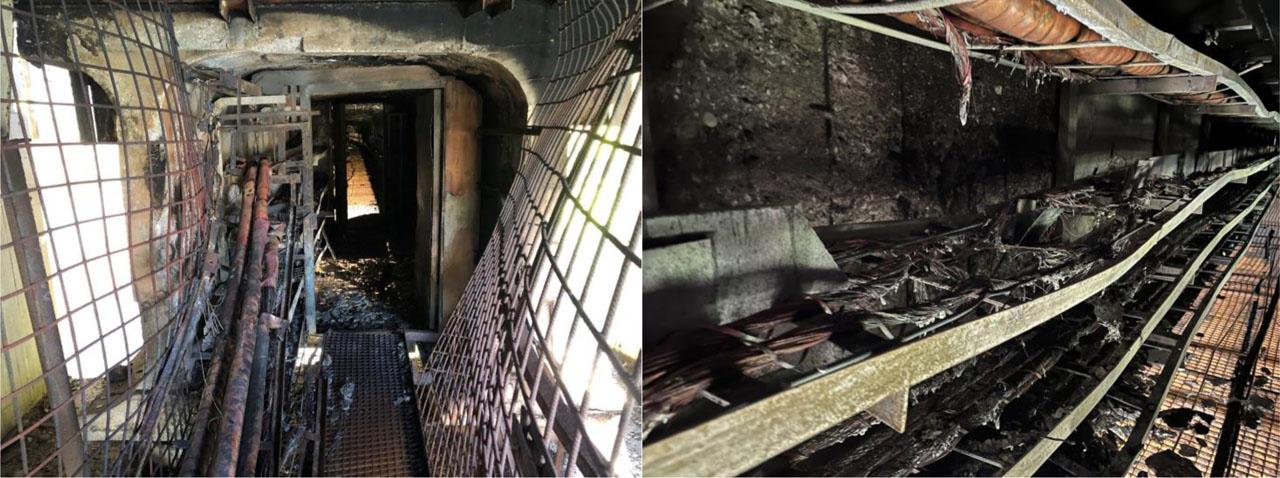
View at the entrance to the chamber of the footbridge and inside the chamber after the fire of the electrical cables
The damage or even collapse of the bridge due to fire is not very frequent and is mostly caused by a car or truck fire on or under the bridge. According to a study (Lee et al. 2013), only 2.8% bridge failures in the United States were caused by fire between 1980 and 2012. Nevertheless, some examples: MacArthur Maze – Oakland, California, USA (2007), where a tanker truck carrying gasoline crashed and exploded beneath the overpass, and extreme heat caused the steel to weaken and the bridge section to collapse (Bajwa et al. 2012). The accident caused the closure of a major highway connection for one month. Bridge over I-75 near Hazel Park, MI, USA (2009), a gasoline tanker struck an overpass on I-75 and caused the complete collapse of the bridge, which fell on the freeway below, (Garlock et al. 2012). The I-95 Overpass Collapse – Philadelphia, USA (2023) occurred when a tanker truck carrying gasoline crashed and caught fire under the bridge (NTBS 2025). The heat caused a northbound section of the bridge to collapse, and the major traffic corridor was shut down and reopened with a temporary fix in 12 days. The exemption from this fire scenario is I-85 Bridge Collapse – Atlanta, Georgia, USA (2017), where a fire under the bridge was started in a storage area with plastic conduit pipes, and the intense heat caused a portion of the bridge to collapse with massive traffic disruption when repairs took approx. 6 weeks and cost over $15 million (FHA 2020). The fire can also be ignited by, e.g. homeless people living under the bridge. On October 30th, 2019, multiple items within a homeless encampment were set on fire beneath the I-29 northbound bridge over the Perry Creek conduit in Sioux City, Iowa. The fire was exacerbated when a propane tank became engulfed by the flames. The bridge girders and deck were particularly vulnerable to the ground fire because of the minimal ground clearance (about 1.8 m) in comparison to that of most other bridges, (Dahlberg et al. 2022). On November 8th 2018, a man caused a fire under a motorway bridge in Žilina, Slovakia, when he set fire to the stored tires and bags with wood chips. The fire damaged the bottom part of the bridge.
The damage or collapse of the bridge due to the fire of the electrical cables is very rare and is more typical for tunnels. Nevertheless, some examples, e.g. Yuen Long / Tuen Mun (Hong Kong) — cable-bridge caught fire on 21st June 2022, (Poon et al. 2022). The fire caused the collapse of the cable bridge, affecting power supply to around 175,000 customers. On October 24th, 2017, a local bridge in New Westminster, B.C., Canada, was closed when an overnight fire destroyed high-voltage electrical cables under it. The bridge was reopened the next day when engineers determined the bridge hadn’t sustained any structural damage.
The footbridge is an approach structure to the footway on the Harbour Bridge in Bratislava. The Harbour Bridge is one of the most important bridges in Bratislava, connecting the city centre to the southern part of the city. It is a popular spot for pedestrians and cyclists to cross the river and offers beautiful views of the city skyline and the Danube. The damaged part of the footbridge is located on the Petržalka side of the Harbour Bridge, see Figure 2. The footbridge consists of 9 spans designed as a sequence of simply supported girders. The length of spans is 27.20 m + 36.48 m + 39.59 m +36.,56 m+ 38.53 m+ 40.38 m+ 40.35 m + 40.40 m +38.64 m. The damaged beams are in the last span. Each span is composed of two post-tensioned precast beams with a depth of 2 m, mutually connected with a reinforced concrete slab, thickness of 155 mm, with a composite behaviour, see Figure 3. The distance between the beams in the transverse direction is 1.8 m. Precast beams were post-tensioned from 5 segments with 40 mm thick joints from cement mortar. For prestressing, 12 and 24-wire tendons were used. The prestressing wires with a diameter of 4.5 mm were embedded in the ducts 42 mm in diameter. Concrete cover of the ducts in the web was 68 mm, and concrete cover of the reinforcing steel was only 15 mm. The segments were cast from concrete C35/45, and the RC slab from concrete C25/30. The footway has a width of 3.0 m. Footway surfacing consists of slope plane concrete with a variable thickness ranging from 37 mm to 67 mm, and an asphaltic layer with a thickness of 25 mm.
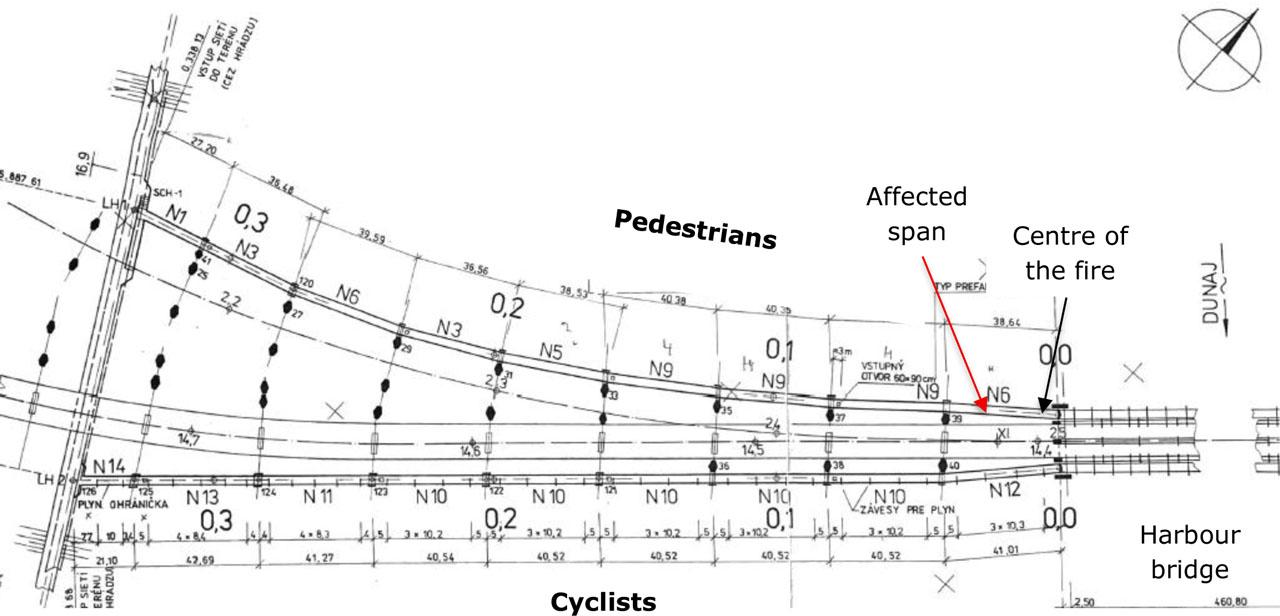
Situation plan of the approach footbridge

Cross-section of the footbridge
The highest heat of the fire was situated inside the box cell of the last span of the footbridge, approximately 5 m from the joint between the Harbour bridge and the footbridge, affecting steel elements of the Harbour bridge footway, the expansion joint, bearings and concrete elements of the footbridge. The fire caused concrete spalling on the inside surface of the girder’s webs and top flanges, see Figure 4 and black discolouration from soot along the whole last span and half of the neighbouring spans. The greatest damages were recorded on the top RC slab with falling chunks of concrete and a spalling concrete cover layer, which let uncovered some reinforcing bars.
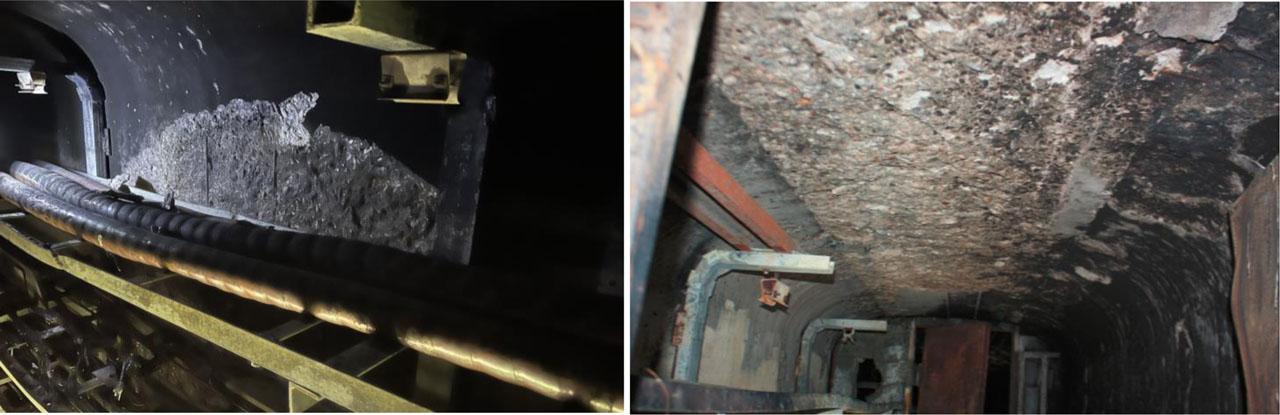
Spalling of the concrete inside footbridge box cell web on the left, RC slab right
To determine the effect of the fire on the mechanical properties of the concrete, a non-destructive testing method was selected by using the Schmidt hammer. The most affected and, as referenced, untouched parts of the footbridge were tested. The tests were carried out inside a box cell on precast beams on the directly exposed webs to the fire and then on the outside surface of the webs at the estimated centre of the fire. The obtained concrete strengths were then compared with the strengths tested on untouched webs of the span. The results are shown in Table 1. Measurements confirmed an adverse effect of the heat on the concrete strength of the structural parts that were subjected to the fire. The effect is stronger in concrete directly exposed to the fire in comparison to the concrete at the outside surface. The maximum decrease in the concrete strength was 23.8% for concrete at the inside surface and 7.2% for concrete at the outside surface. Measurements confirmed the impact of the fire on the mechanical properties of the concrete.
Measured concrete strength by the Schmidt hammer
| Placement | Beam | Surface | Cube strength [MPa] | Cylinder strength [MPa] | Ratio [%] |
|---|---|---|---|---|---|
| Web at centre of the fire | A | Inside | 43.6 | 37.03 | 85.4 |
| Web at centre of the fire | B | inside | 38.7 | 32.9 | 76.2 |
| Web at centre of the heat | A | outside | 47.34 | 40.24 | 92.8 |
| Web at centre of the heat | B | outside | 47.25 | 40.16 | 93.1 |
| Bottom flange at centre of the fire | B | outside | 50.49 | 42.92 | 99.4 |
| Un-affected web | A | Inside | 51.03 | 43.38 | 100 |
| Un-affected web | B | inside | 50.76 | 43.15 | 100 |
The effect of the fire on the mechanical properties of the prestressing tendons cannot be determined by any non-destructive method. There are some research programs dealing with the effect of high temperature on the properties of prestressing steel, e.g. (Abrams & Erlin 1967), (Holmes et al. 1982). In the first and second columns of Table 2 are shown findings from the research program (Gustaferro & Martin 1988). These values are also recommended by the PCI.
Prestressed strand strength after heating and cooling
| Gustaferro & Martin 1988 | EN 1992-1-2 (2023) | ||
|---|---|---|---|
| Temperature | [%] of initial strength | Temperature | [%] of initial strength |
| < 400 °C | 100 | 100 °C | 98 |
| ≈ 482 °C | 70 | 200 °C | 87 |
| ≈ 600 °C | 50 | 300 °C | 70 |
| 400 °C | 50 | ||
| 500 °C | 30 | ||
| 600 °C | 14 | ||
In the third and fourth columns of Table 2, reduced values of prestressing steel strength given by the EC2 for Structural fire design are shown. The values are much more conservative in comparison with the values recommended by PCI. However, if the bottom part of the prestressed beam is exposed to fire from three sides and the width of the bottom flange is at least 300 mm and the distance of the axis of prestressing units from the fire-exposed surface is ≥ 40 mm, the standard fire resistance can be assumed to be 60 minutes. This fire resistance is determined based on the assumption that the critical temperature in the prestressing tendons θcr will not exceed 350°C within 60 minutes, and the actual load will not be higher than 70% of the design load Ed determined for a permanent design situation.
Another problem is to determine the temperature of the concrete surrounding the prestressing tendons. There are some indicators like colour changes in the concrete, excessive cracking, spalling of concrete, and the loss of larger chunks of concrete (Garlock et. al 2012). The field temperature can be estimated, e.g. based on a concrete sparse layer which is discontinuous or a low-density layer of concrete that doesn’t form a fully solid mass (Chaowei et al. 2019), see Table 3.
Relationship between fire temperature and thickness of concrete sparse layer
| Burning thickness [mm] | Field temperature [°C] |
|---|---|
| 1 – 2 | < 700 |
| 2 – 3 | 700 – 800 |
| 3 – 4 | 800 – 850 |
| 4 – 5 | 850 – 900 |
| 5 – 6 | 900 – 1000 |
| > 6 | > 1000 |
A study conducted at Purdue University on the post-fire assessment of prestressed concrete bridges discusses temperature profiles through concrete depth on four different test specimens (Varma et al. 2021). The findings can be concluded that the prestressed concrete girders exposed to about 50 minutes of hydrocarbon fire undergo superficial concrete material damage with loss of calcium hydroxide and extensive cracking and spalling extending to the depth of 20–25 mm from the exposed surface. These girders do not undergo a significant reduction in flexural strength or shear strength. However, the reduction in initial stiffness may be notable due to concrete cracking and spalling.
The extent of the damage to the most severely attacked concrete surface of the web reached a depth of up to 30 mm. Despite this, the inclined ducts were not uncovered and remain in a 35 mm-thick dense concrete layer. We expect that several inclined tendons could be affected by the fire. However, no signs of shear cracks were found. In the case of the bottom flange, where most of the tendons are concentrated, the thickness of the concrete sparse layer was up to 2 mm. Therefore, we did not expect serious problems with the safety and durability of the structure, only a decrease in stiffness. To confirm our assumption, a load test was proposed to the municipal transportation authority.
A load test of the structure represents a non-destructive method for assessing the structural behaviour of the new, old or damaged structure. Load tests are also frequently used for verification of the design models and design assumptions that were used for designing and projecting the structure.
The load test proposed for the footbridge had one major obstacle. The footbridge is not accessible for the other traffic except for pedestrians and cyclists. Therefore, loaded tracks could not be used as testing load. Fortunately, the damaged span is close to the river Danube and water from the river can be pumped to the plastic tanks and used as a testing load, see Figure 5.
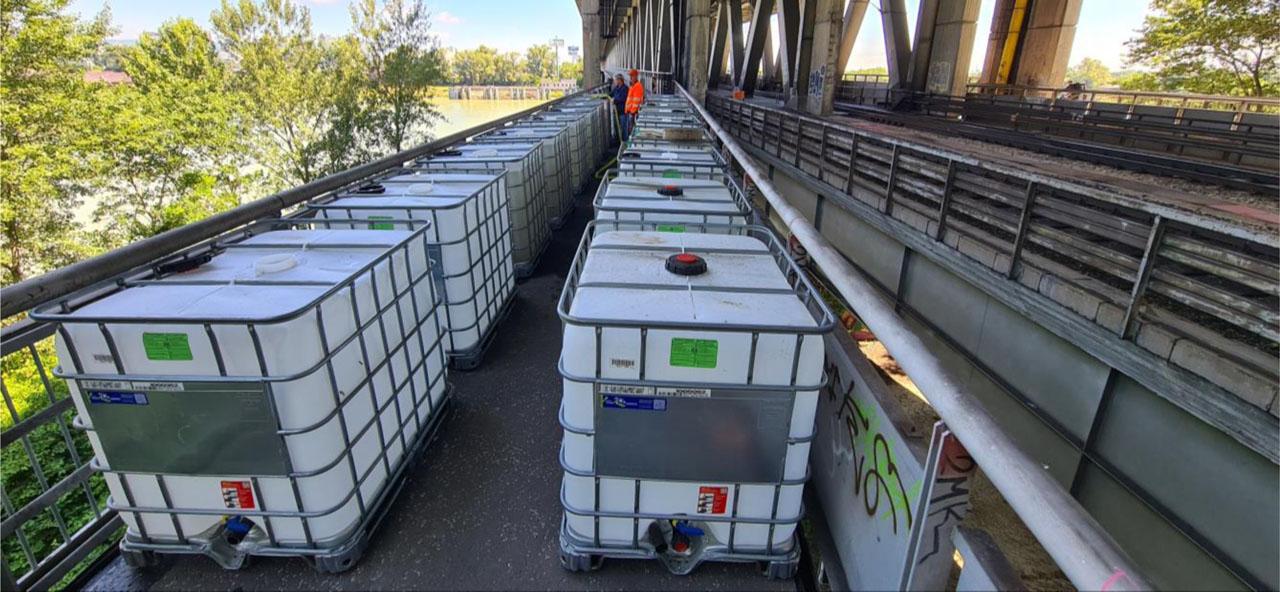
Plastic tanks used as testing load
The municipal transportation authority rented twenty 1000 L plastic tanks that allowed to subject footbridge to the relevant testing load. The number of tanks was determined from the requirement to reach at least 75% effectiveness of the variable load. This means that the maximum bending moments due to testing load should be greater than 75% of the bending moments due to pedestrian load. Each tank represented load (1000 kg + 35 kg). 9.83 m.s−2 = 10174 N = 10,17 kN, when 35 kg was a weight of the empty tank. The water for tanks was pumped from the river by municipal firemen.
The variable load due to pedestrians was determined according to EC1 with Eq. 1. The area load 3.76 kN/m2 was recalculated on the linear load qk,N1 = 3.0×3.76 = 11,3 kN/m and bending moment in span center was calculated as Mq,N1 = 11.3×38.12/8 = 2046.8 kN.m.
Ltn - is the loaded length in [m].
Arrangement of the water tanks in the damaged span N1 is shown in Figure 6. The same arrangement was used in the neighbouring reference span N2. For the calculation of the bending moments and deflections due to the testing load, a FEM model in the program SCIA Engineer was created, see Figure 7. The bending moment in the centre of the span due to testing load was 1570 kN.m and the expected deflection was −5.8 mm. A ratio of the load effectiveness of 1.57/2.046 = 0.767 (76.7%) was achieved. The testing load was equivalent to the pedestrian load of 0.767.3.76 = 2.88 kN/m2 > 2.50 kN/m2. Both tested girders were mostly in the shadow during the load test; therefore, changes in deflection due to thermal load were minimal. After unloading, the deflection changed to a camber of +0.5 mm in beam N1 and +0.4 mm in beam N2 due to temperature changes during the load test.
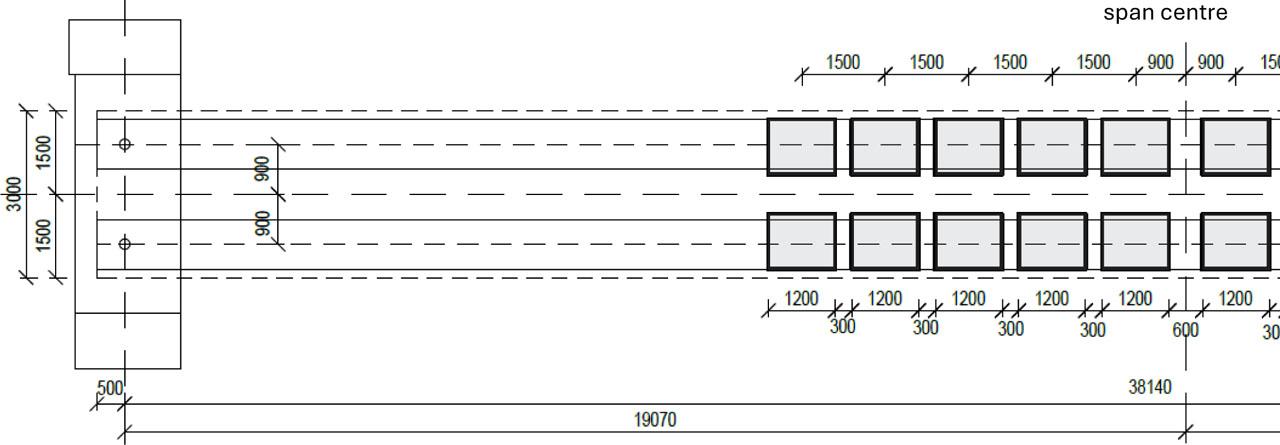
Arrangement of the tanks on the damaged span – girder N1
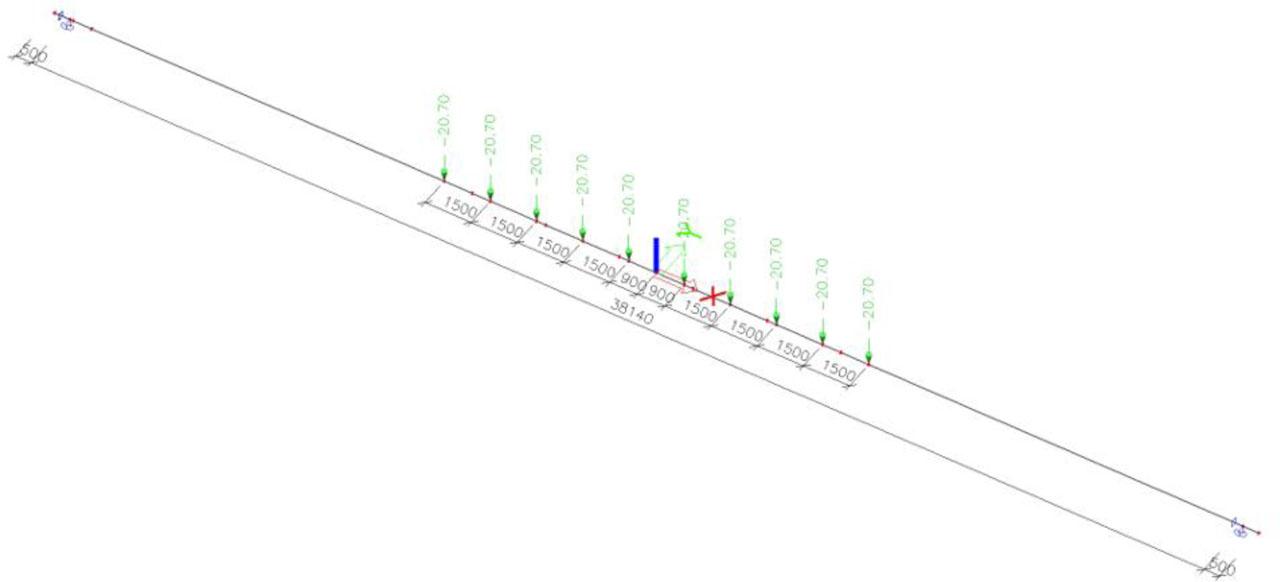
FEM model of the footbridge structure - girder N1
Two spans were loaded by the tanks. Damaged span N1 of the footbridge and neighbouring reference spans N2. The measured deflections could not be directly compared due to different effective span length of the loaded girders. The effective span length of the damaged span was 38.14 m and span length of the reference span was 39.15 m. Therefore, the comparison was based on the comparing of the deviation of measured deflections from theoretical ones. Deformations were measured by high precision levelling on five points. Measuring marks were placed on the girder’s supports, in the centre of the span and 9.7 m from the span centre. Measured and predicted deformations are introduced in Table 4 for both spans.
Comparison of measured and assessed deformations
| span | section | deflections [mm] | Ratio | Ratio | |
|---|---|---|---|---|---|
| predicted fpred | measured fmes | fmes/ fpred | N1/N2 | ||
| N1 | centre | 5.80 | 5.20 | 0.890 | 1.175 |
| centre −9.7 m | 4.00 | 3.38 | 0.845 | 1.153 | |
| N2 | centre | 6.40 | 4.80 | 0.754 | 1.0 |
| centre −9.7 m | 4.50 | 3.30 | 0.733 | 1.0 | |
The measured deflections fmes were always lower compared to the predicted values fpred. However, the ratio fmes/fpred was quite different for the damaged and reference span. The reference span was stiffer than the girder’s FEM model by 24.6 % and 26.7% respectively while the damaged span was also stiffer, but only by 11% and 15.5%. It means that the deflections due to testing load in the damaged span were higher by 17.5% and 15.3% in comparison with the reference span. This indicates adverse effect of the fire on the structural behaviour of the damaged beams. Together with span loading, a detailed inspection of the girder’s bottom flanges and webs was carried out at maximum testing load, see Figure 8. Both joints that are located only one meter from the centre of the span, and the web surfaces were visually checked for possible joint opening or cracking. No sign of the joint opening or cracking was recorded.
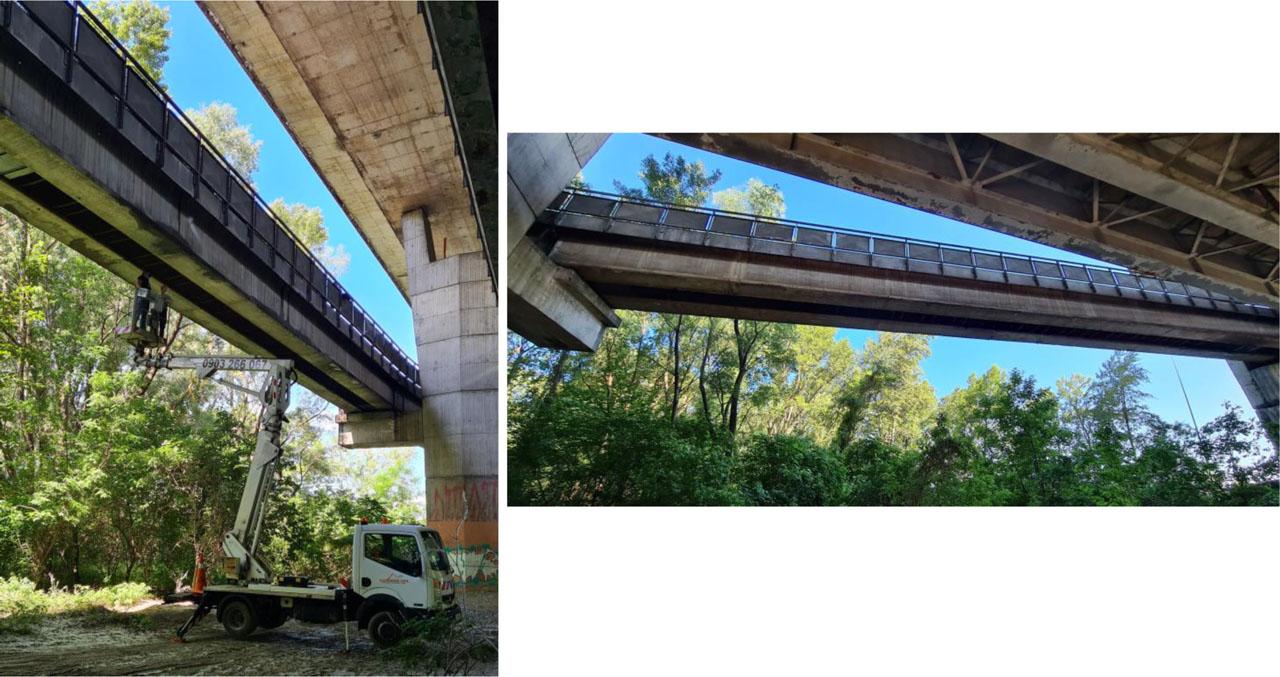
Photo of the damaged span during and after inspection
Non-destructive measurement of concrete strengths confirmed an adverse effect of the fire on the concrete properties. Particularly, in the parts that were directly exposed to the fire. Also, load test confirmed some impact of the fire on the structural behaviour of damaged girders when the ratio of measured and predicted deflections was higher by 17.5% at mid span section compared to the reference girders. However, the ratio fmes/fpred obtained for the damaged span was still lower than one when even the footway surfacing was counted to the flexural stiffness of the structure. Detailed visual inspection under maximum testing load has not revealed any joint opening or cracking in the area of maximum bending and in the areas with the greatest impact of the fire on the structure (webs). Based on these results, it was recommended to reopen the footbridge to the public in June 2022.
On 21st April 2022, a high voltage cable attached to the webs of precast beams inside the box cell of the footbridge set to fire and damaged the concrete surfaces of the beams and composite RC slab. Spalling of the concrete occurred in the webs and top flanges of the beams, as well as in the top RC composite slab.
The extent of the damage hit several inclined prestressing tendons in the webs when sparse concrete layers and concrete spalling reached a maximum thickness of 30 mm. The major part of the tendons remained untouched.
Non-destructive testing of the concrete strength in the centre of the fire caused a decrease in the concrete strength up to 23.8% for the surface directly exposed to fire and 7.2 % for the surface on the opposite side of the web.
The load test confirmed a reduction in the stiffness of the span exposed to the fire compared to the reference span. The decrease in the stiffness and increase in deflection were approximately 17.5%.
Neither bending and shear cracks nor joint opening were recorded during the load test.