

1. Introduction
The area of desert in Xinjiang occupies 64% of the total desert area in China. With the development of the economy, the mileage of roads constructed in desert areas has been increasing year by year. However, due to the specific geological conditions, there is a severe shortage of quality materials, such as gravel, for road construction. The long transportation distances significantly raise construction costs. Therefore, the efficient and reasonable development and utilization of aeolian sand in the road transportation sector has become an important focus of current research (Gao et al., 2023; Yin et al., 2022). Aeolian sand is a layer of sand formed by wind action and is classified as very fine sand. Its low natural moisture content, loose particles, and poor gradation necessitate modification before it can be effectively utilized (Elipe & López-Querol, 2014). Many scholars have conducted research on modifying the mechanical properties of aeolian sand through various factors for engineering applications (Cui et al., 2023; Ghrieb et al., 2014; Lopez-Querol et al., 2017; Shao et al., 2021; Sun & Wang, 2023; Zhang et al., 2023). However, in road engineering, the incorporation of aeolian sand remains limited. The primary method employed to increase the dosage of aeolian sand is the addition of cement (Elipe & López-Querol, 2014; Liu et al., 2023). However, excessive use of cement contributes to increased carbon emissions and exacerbates the greenhouse effect (Barcelo et al., 2014; Wu et al., 2018). Moreover, excessive cement can lead to cracking in semi-rigid bases, severely affecting the normal operation of roads (Tang et al., 2020; Zhu et al., 2024). Therefore, to alleviate the shortage of construction materials in desert regions and to overcome the environmental and damage issues associated with cement, there is an urgent need to develop a new material that stabilizes aeolian sand gravel for use in semi-rigid bases of asphalt pavements.
Geopolymers are inorganic polymers composed of tetrahedral structural units of AlO4 and SiO4. These tetrahedral units interconnect through shared oxygen vertices to form three-dimensional amorphous to semi-crystalline network structures (Hilal et al., 2024). Due to their exceptional mechanical properties, corrosion resistance, low permeability, high-temperature resistance, and chemical resistance, geopolymers are gradually being used as substitutes for ordinary Portland cement (Wijaya et al., 2024). Deb et al. (2014) prepared geopolymers by incorporating slag into low-calcium fly ash, finding that the compressive strength increased with the addition of slag. Shaikh and Haque (2018) found that materials prepared using K-based activator exhibited higher strength and thermal stability compared to those prepared with Na-based activator. Pelisser et al. (2013) revealed that for fly ash-based geopolymers, when the molar ratio of SiO2 to Na2O ranged from 0.9 to 1.4, its mechanical properties initially increased and then decreased as the molar ratio increased. Guo et al. (2022) analyzed the fluidity, setting time, and impermeability of geopolymer grouting materials. The optimal mix was a ratio of coal gangue powder, slag, and fly ash of 5:4:1. Zhao et al. (2017) used water glass to activate non-ferrous metal slag to produce geopolymers, and found that when the modulus was 1.1 and the water binder ratio was 0.28, the specimen reached a strength of 90 MPa after curing for 90 days. Zhang et al. (2024) characterized the material structure of geopolymers using microscopic tests. The results indicated that when the powder content ranged from 10% to 30%, the geopolymers exhibited high compressive strength and a dense microstructure.
Despite the many excellent properties of geopolymers, their internal ionic and covalent bonds do not deform upon fracture under external forces. This inherent brittleness significantly limits their applications. To address this issue, many researchers have investigated modification methods such as fibre reinforcement (Abbas et al., 2022). Basalt fiber, a modified natural material derived from the melting of basalt rock, is gaining increasing attention among researchers due to its nontoxic, harmless nature, environmental friendliness, and lower cost compared to carbon fibres (Katkhuda & Shatarat, 2017). Studies have demonstrated that the incorporation of basalt fibre improves the mechanical and fire resistance properties of materials while reducing the shrinkage of concrete (Chakkor, 2025; Punurai et al., 2018).
Scholars at home and abroad have conducted extensive research on the road performance of aeolian sand, the factors affecting the strength of geopolymers, and fibre-reinforced geopolymers. However, two issues remain. One issue is that previous studies on aeolian sand have primarily focused on its application in concrete engineering, with relatively few studies investigating its feasibility for use in road engineering. The second is that the studies often concentrate on the mechanical performance of cement-modified gravel bases made from aeolian sand, while systematic theoretical research on geopolymer-stabilized aeolian sand gravel bases is lacking. To address these issues and to promote a green, low-carbon, and environmentally friendly approach, this study employs steel slag micro powder and fly ash to prepare geopolymers as a substitute for cement. Additionally, aeolian sand is completely used as fine aggregates (particle size below 4.75 mm) for the mix design of geopolymer-stabilized aeolian sand gravel (GSG). Furthermore, basalt fibre is incorporated to enhance the mechanical properties and frost resistance of GSG. Based on microscopic experiments, this research investigates the strength formation mechanisms of the mixture and the mechanisms of freeze-thaw damage. The findings provide valuable insights for the design and construction of road subgrades using aeolian sand in arid desert regions, demonstrating significant economic and environmental benefits.
2. Materials and Methods
2.1. Material Properties and Chemical Compositions
The chemical composition of steel slag micro powder and fly ash (FA) are shown in Table 1. The steel slag micro powder was sourced from a material company in Gongyi, Henan, originating from oxygen top-blown converter steelmaking. It had a fineness of 200 mesh, a density of 3.2 g/cm3, and an alkalinity of 1.42. The fly ash was produced by a company in Changji, Xinjiang, meeting the criteria for Class II F fly ash, and its physical properties are shown in Table 2. Figure 1 shows the scanning electron microscope (SEM) images of the steel slag micro powder and FA. The SEM images reveal that the particles of steel slag micro powder have an irregular plate-like shape, while the fly ash consists of spherical particles of varying sizes and flocculent materials.
Table 1:
Chemical composition of the steel slag micro powder and FA
| Chemical composition | SiO2 | Al2O3 | CaO | Fe2O3 | K2O | MgO | P2O5 | Na2O | |
|---|---|---|---|---|---|---|---|---|---|
| Content (%) | Steel slag micro powder | 21.04 | 4.61 | 30.82 | 24.39 | 0.11 | 2.47 | 0.63 | 1.85 |
| FA | 53.24 | 31.37 | 4.26 | 3.95 | - | 1.49 | - | - | |
Table 2:
Physical properties of FA
| Fineness (45μm) [%] | Water demand [%] | Loss on ignition [%] | Moisture content [%] | Specific surface area [cm2.g−1] |
|---|---|---|---|---|
| 18.9 | 87 | 2.5 | 0.03 | 3025 |
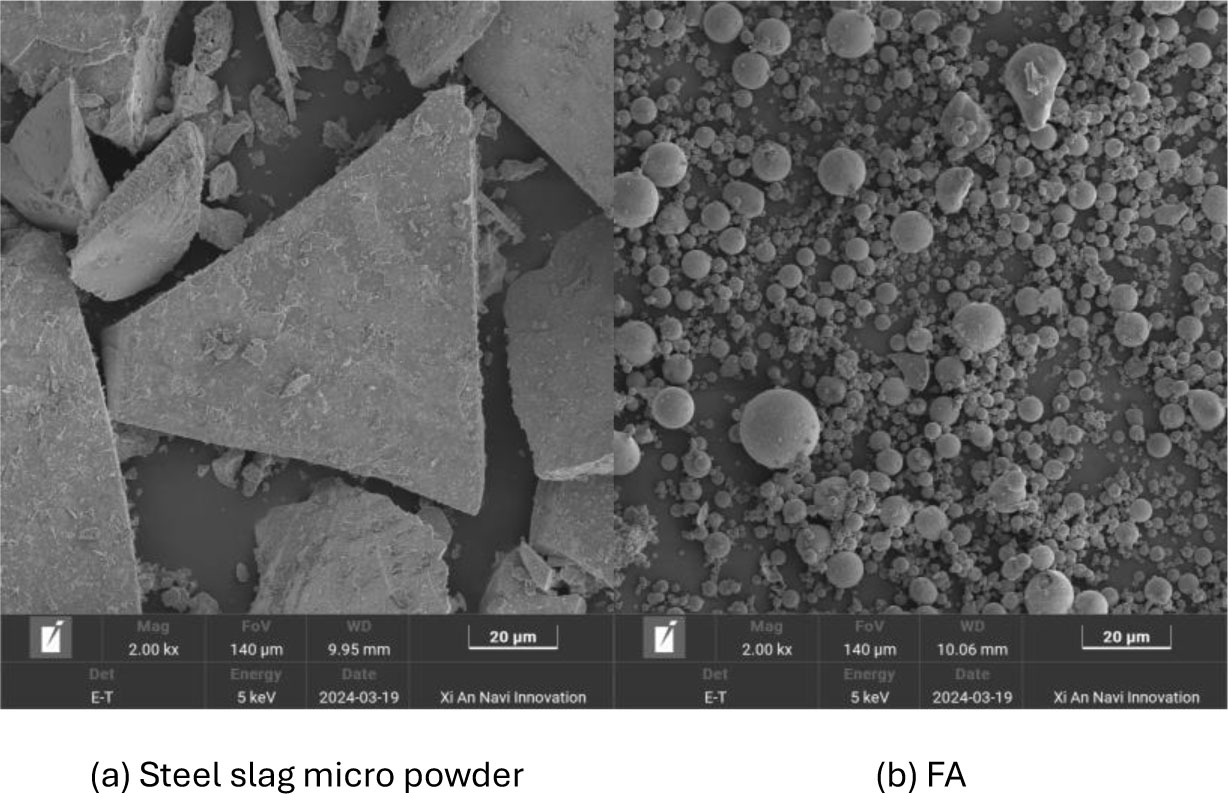
Figure 1:
SEM images of steel slag micro powder and FA
The aeolian sand was obtained from the Taklamakan Desert, with a yellow-brown appearance. Its physical properties are shown in Table 3Table 3: Technical indicators of aeolian sand. The particle size distribution and appearance characteristics of aeolian sand are shown in Figure 2. The particles with a diameter between 0.075 mm and 0.6 mm account for 91% of the total mass. In the figure, di represents the sieve opening size corresponding to an i% passing rate. The calculated curvature coefficient (Cc) is 0.737, while the uniformity coefficient (Cu) is 2.818, indicating poor gradation qualities. As observed in the SEM image, the aeolian sand particles exhibited a rough surface, relatively loose structure, and distinct angularity.
Table 3:
Technical indicators of aeolian sand
| Bulk density [g·cm−3] | Apparent density [g·cm−3] | Natural moisture content [%] | Mud content [%] | Weight density [KN·m−3] |
|---|---|---|---|---|
| 1.629 | 2.842 | 1.58 | 1.52 | 16.6 |
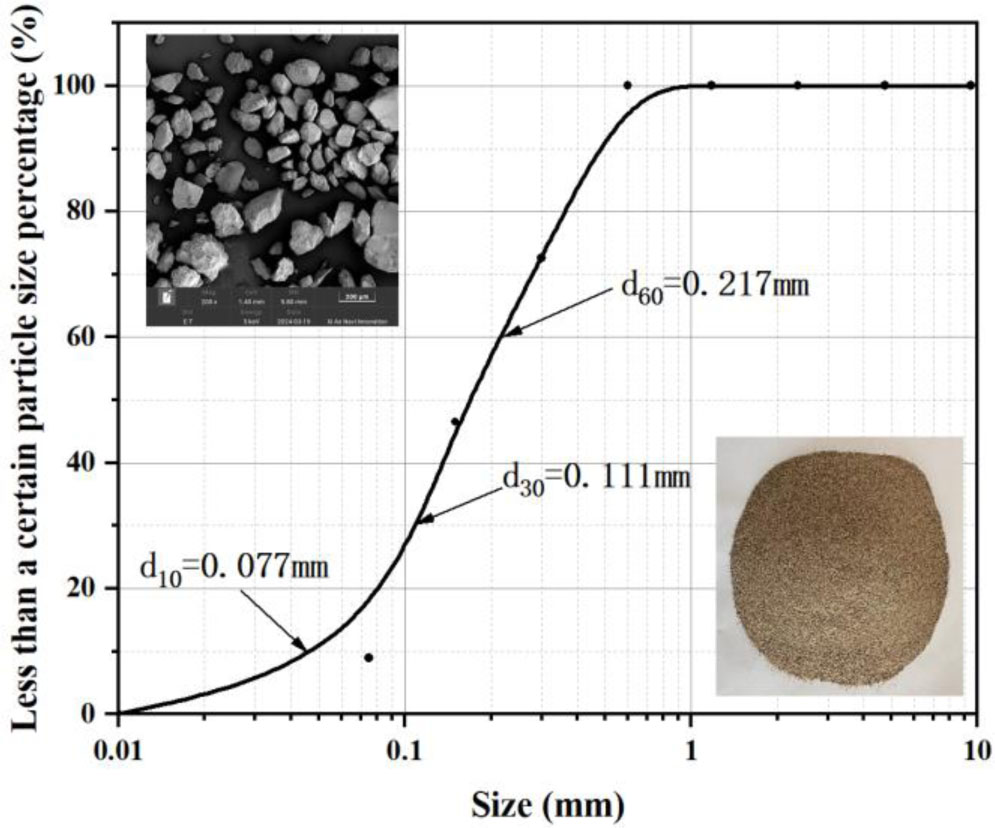
Figure 2:
Particle size distribution and appearance characteristics of aeolian sand
The alkali activator was prepared by modifying water glass with NaOH. NaOH was produced by Inner Mongolia Junzheng Energy with a purity ≥99%. The water glass was produced by Henan Borun, with a 100-mesh sieve passing rate of 98.5%, and an initial modulus of 2.3 (SiO2/Na2O).
Basalt fibres were provided from a company in Henan, and their lengths were 9 mm, 12 mm, 15 mm, and 18 mm. The density was 2.65 g/cm3, the elastic modulus ranged from 91 to 110 GPa, and tensile strength ranged from 3000 to 4800 MPa.
2.2. Methodology
We employed a stepwise progressive research approach. First, the optimal mix ratio of the geopolymer was determined through orthogonal tests. Next, the dosage of the geopolymer was varied to identify its applicability across different road classifications. Finally, based on the established optimal mix ratio and dosage, basalt fibres were added to investigate the effects of fibre length and dosage on the overall performance.
2.2.1. Geopolymer Ratios
Research by Guo and Yang (2020) indicated that in the preparation of geopolymers with 0–28% steel slag replacing FA, the compressive strength increased with an increase in the steel slag content. Based on the preliminary experimental results, steel slag micro powder contents of 20%, 30%, and 40% were selected, corresponding to mass ratios of steel slag micro powder to fly ash (hereinafter referred to as slag-powder ratio) of 2:8, 3:7, and 4:6, respectively. Based on the findings reported by He (2020) regarding the influence of SiO2/Na2O ratios in water glass solutions on geopolymer activation, alkali content and water glass modulus were selected as critical evaluation factors. Alkali content (Na2O percentage relative to solid waste materials) was set at 6%, 8%, and 10%. Research indicated that when the water glass modulus was too low (less than 1), the alkali activation effect was unsatisfactory. When it was too high (greater than 2), it might lead to a decline in the mechanical properties of the geopolymer. Therefore, this study selected water glass modulus of 1.2, 1.4, and 1.6. An orthogonal design was conducted for the above three factors at three levels, with a constant water-to-binder ratio of 0.25. The design results are shown in Table 4.
The mass of water glass and NaOH during solution preparation can be calculated using formulas (1) and (2).
Table 4:
Orthogonal experiment table of geopolymer
| Number | Slag-to-powder ratio | Alkali content [%] | Water glass modulus |
|---|---|---|---|
| A1 | 2:8 | 6 | 1.2 |
| A2 | 2:8 | 8 | 1.6 |
| A3 | 2:8 | 10 | 1.4 |
| A4 | 3:7 | 6 | 1.6 |
| A5 | 3:7 | 8 | 1.4 |
| A6 | 3:7 | 10 | 1.2 |
| A7 | 4:6 | 6 | 1.4 |
| A8 | 4:6 | 8 | 1.2 |
| A9 | 4:6 | 10 | 1.6 |
Where:
MNa2SiO3 - the mass of water glass [g],
W1 - the content of Na2O after preparation,
M2 - the mass of FA [g],
M0 - the modulus of water glass before preparation,
W0 - the content of Na2O before preparation,
M1 - the modulus of water glass after preparation,
MNaOH - the mass of NaOH [g].
2.2.2. Fiber-reinforced Geopolymer Stabilized Aeolian Sand Gravel Mixture Ratios
Aeolian sand was used to completely substitute aggregates smaller than 4.75 mm for the preparation of basalt fibre-reinforced steel slag micro powder-fly ash geopolymer stabilized aeolian sand gravel (FGSG) samples. Based on preliminary experimental results, a gravel content of 34% was selected (10 ~ 20 mm: 20 ~ 30 mm = 1:1). In this context, the design of external fibre incorporation was carried out with volume fractions set at B0=0 v%, B1=0.05 v%, B2=0.1 v%, B3=0.15 v%, and B4=0.2 v%. Additionally, the fibre lengths were set to L0=0 mm, L1=9 mm, L2=12 mm, L3=15 mm, and L4=18 mm. The mix design experimental results are presented in Table 5.
2.3. Test Methods
2.3.1. Compaction Test
The compaction tests of the mixture were conducted according to the Chinese testing code JTG E51 (2009). A total of eight mix proportions were selected, wherein the content of geopolymer constituted 6%, 8%, 10%, 12%, 14%, 16%, 18%, and 20% of the total mass of the GSG mixture. Five water contents of 5%, 6%, 7%, 8%, and 9% were designed for each ratio, with a total of 40 compaction tests. The optimum moisture content and maximum dry density were obtained through fitting calculations.
2.3.2. Preparation of Sample and Mechanical Properties Test
According to the standards of GB/T 17671 (2021), geopolymer paste was prepared. First, steel slag micro powder and FA were proportionally weighed (total mass 500g) and placed in a mixer, where they were mixed for 10 min to ensure uniformity. Subsequently, the water glass solution prepared with NaOH was added, having cooled to room temperature, and mixing continued for 5 minutes. The resulting slurry was then slowly poured into a cubic mold with a side length of 70.7mm and compacted on a vibrating table. The mold was wrapped with a film and kept at room temperature for 24 hours for curing. After molding, the specimens were subjected to standard curing for 7 days and 28 days. Finally, unconfined compressive strength was measured to verify compliance with highway construction technical specifications.
In accordance with JTG E51 (2009), the preparation, curing, and strength test of GSG and FGSG mixture specimens were conducted. The specimens were prepared based on the optimum moisture content and maximum dry density, resulting in cylindrical specimens of Φ150mm×150mm. The GSG specimens underwent standard curing for 7 days and 28 days, while the FGSG specimens were cured for 7 days, 28 days, and 60 days. One day prior to the end of curing, the specimens were immersed in water for 24 hours, ensuring the water surface was 2.5 cm above the top of the specimen. After soaking, the specimens were removed, surface was wiped off, and unconfined compressive strength and splitting tests were conducted using an electric-hydraulic universal testing machine, applying a loading rate of 1mm·min−1.
The specimen preparation is shown in Figure 3.
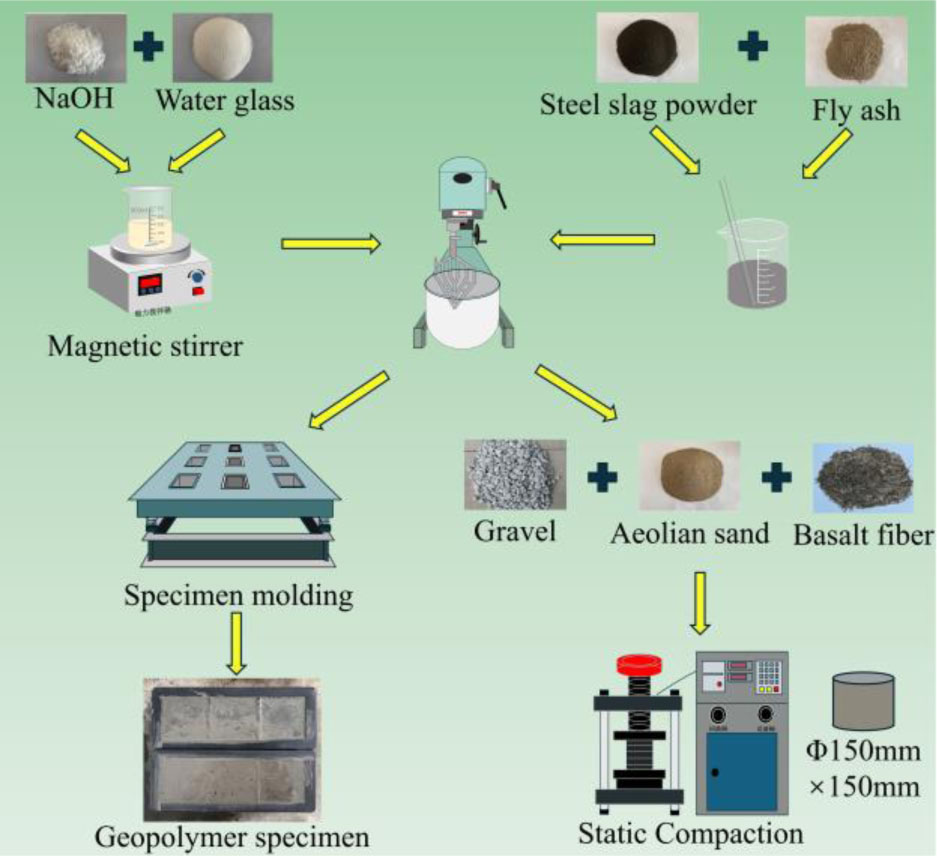
Figure 3:
Flow chart of specimen preparation procedure
2.3.3. Freeze-thaw Cycle Test
The freeze-thaw cycle test was conducted according to JTG E51 (2009). The preparation and curing of the specimens were consistent with Section 2.3.2, with a standard curing duration of 28 days. After curing, the specimens were removed, surface moisture was wiped off, and their weights were recorded. Subsequently, the specimens were transferred to a testing chamber for the freeze-thaw cycle test. The freezing temperature was set to −18 °C and the thawing temperature was set to 20 °C. Each freeze-thaw cycle lasted 24 hours, with 16 hours of freezing and 8 hours of thawing. A total of 12 freeze-thaw cycles were performed, and unconfined compressive strength tests were conducted after the 0th, 3rd, 6th, 9th, and 12th cycles. The average of three samples was reported as the result of the strength. Notably, the test employed a gas freeze-water thaw mode, which involved using dry cold air in the environmental chamber during freezing and filling the environmental chamber with water at a temperature of 20 °C that was above the top of the specimens during thawing. Each specimen was weighed upon completion of each cycling phase.
2.3.4. Microscopic Test
The SEM-EDS tests were conducted by Hitachi Cold Field Emission Scanning Electron Microscope (Hitachi Regulus8100) to observe the micro-morphology of geopolymer and FGSG at the age of 7d and 28d, as well as the structural and elemental changes of the mixes before and after freeze-thaw cycles. Following mechanical property testing and freeze-thaw cycling, fractured specimens were dried in a 50°C oven until constant mass was achieved, ensuring minimal strength deviation across all sampled units. XRD D8 ADVANCE equipped with CuKα radiation was used to analyse the phase composition of geopolymer by XRD test.
3. Results and Analysis
3.1. Determination of Optimal Geopolymer Ratio
3.1.1. Range Analysis
Figure 4 shows the results of 7d and 28d unconfined compressive strength test of geopolymer mixture. At both ages, all mix ratios of the geopolymer demonstrated good compressive strength performance. The strength reached its maximum values at all ages when the slag-to-powder ratio was 3:7, with an alkali content of 8%, and a water glass modulus of 1.4, resulting in a compressive strength of 2.58 MPa at 7 d and 9.83 MPa at 28 d.
A range analysis was conducted on the compressive strength of the geopolymer at different factor levels, with the results shown in Table 6. The varying k values shown in the table exhibited peak changes. This peak variation indicated that, with the increase of each factor level, the compressive strength of the geopolymer experienced a process of initially increasing and then decreasing at both 7 d and 28d. The maximum k2 corresponded to each factor, suggesting that the optimal mix ratio of the geopolymer was slag-to-powder ratio = 3:7, alkali content = 8%, and water glass modulus = 1.4. The magnitude of the R value represents the degree of influence of each factor on the compressive strength, with larger R values indicating greater contributions. By comparing the R values, the influence ranking of each factor on strength was determined to be: alkali content > water glass modulus > slag-to-powder ratio.
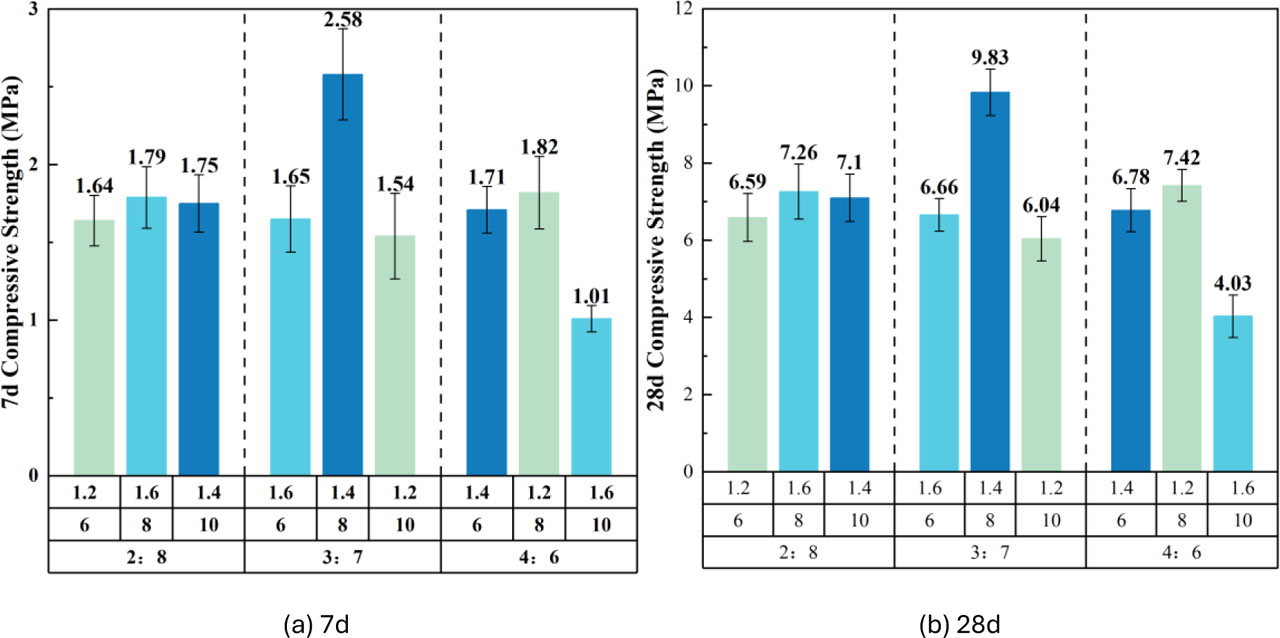
Figure 4:
Unconfined compressive strength of geopolymer at different curing age
Table 6:
Compressive strength range analysis table
| 7d compressive strength | 28d compressive strength | |||||
|---|---|---|---|---|---|---|
| Slag-to-powder ratio | Alkali content | Water glass modulus | Slag-to-powder ratio | Alkali content | Water glass modulus | |
| k1 | 1.73 | 1.67 | 1.67 | 6.98 | 6.68 | 6.68 |
| k2 | 1.92 | 2.06 | 2.01 | 7.51 | 8.17 | 7.90 |
| k3 | 1.51 | 1.43 | 1.48 | 6.08 | 5.72 | 5.98 |
| R | 0.41 | 0.63 | 0.53 | 1.43 | 2.45 | 1.92 |
3.1.2. Variance Analysis
To further investigate the significant effects of various factors on the performance indicators, variance analysis was conducted on the compressive strength at 7 d and 28 d, as shown in Table 7. The sums of squares (SS) for each factor were relatively small, indicating minimal error influence during the experiment and ensuring reliable and accurate results. To assess the significance of different factors on the unconfined compressive strength of the geopolymer, F-tests were performed with confidence levels of α = 0.01, 0.05, and 0.1. The F-distribution table indicates that, for degrees of freedom (DF) of (2, 2), Fα0.01 (2, 2) = 99, Fα0.05 (2, 2) = 19, and Fα0.1 (2, 2) = 9 (GB 4086.4, 1983). At both 7 d and 28 d, the alkali content and water glass modulus were significant at the 0.05 level. The influence of the slag-to-powder ratio on compressive strength varied across different ages. It was significant at the 0.05 level for 7d and at the 0.1 level for 28d. The P value indicates significance, results show significant differences when p < 0.05, and smaller P values indicate greater significance. Therefore, the ranking of the significant influence of each factor on the compressive strength of the geopolymer can be obtained as: alkali content > water glass modulus > slag-to-powder ratio. This is consistent with the results of the range analysis.
Both range and variance analyses indicated that the three factors influencing the strength of the geopolymer each had an optimum value. The alkali content contributed most significantly to the strength, which is consistent with previous research findings (Singh & Sengupta, 2022; Sukmak et al., 2013). In a strongly alkaline environment, the alkali activator solution can dissolve and release SiO2 and Al2O3 from the steel slag micro powder and FA, enabling both materials to participate more effectively in the condensation phase of the polymerization process (Hwang & Huynh, 2015). Based on the above research findings, subsequent experiments used a fixed slag-to-powder ratio of 3:7, alkali content of 8%, and water glass modulus of 1.4 to prepare the geopolymer.
Table 7:
Compressive strength variance analysis table
| 7d compressive strength | 28d compressive strength | |||||
|---|---|---|---|---|---|---|
| Slag-to-powder ratio | Alkali content | Water glass modulus | Slag-to-powder ratio | Alkali content | Water glass modulus | |
| SS | 0.252 | 0.609 | 0.435 | 3.154 | 9.125 | 5.665 |
| DF | 2 | 2 | 2 | 2 | 2 | 2 |
| MS | 0.126 | 0.304 | 0.217 | 1.577 | 4.563 | 2.832 |
| F | 33.099 | 79.857 | 57.029 | 15.100 | 43.688 | 27.122 |
| P | 0.029 | 0.012 | 0.017 | 0.062 | 0.022 | 0.036 |
3.2. Mechanical Properties Analysis of FGSG
3.2.1. Determination of Geopolymer Dosage
(1). Compaction test analysis
The effects of different dosages of geopolymer on the optimum moisture content and maximum dry density of the GSG mixture are shown in Figure 5. As the dosage of geopolymer increased, the optimum moisture content of the GSG mixture showed a trend of first decreasing and then increasing, while the maximum dry density exhibited the opposite trend. The mixture achieved optimum moisture content and maximum dry density when the dosage reached 14%. When the geopolymer dosage increased from 6% to 14%, the continual increase in the steel slag micro powder and FA particles filled the pores in the mixture to some extent, leading to a gradual densification of the mixture. However, when the dosage of geopolymer exceeded 14%, the increase in the geopolymer content per unit volume results in more pores between the materials. This enlargement of available space for water led to an increase in water content, thereby causing a gradual rise in the optimum moisture content and a corresponding decline in dry density.
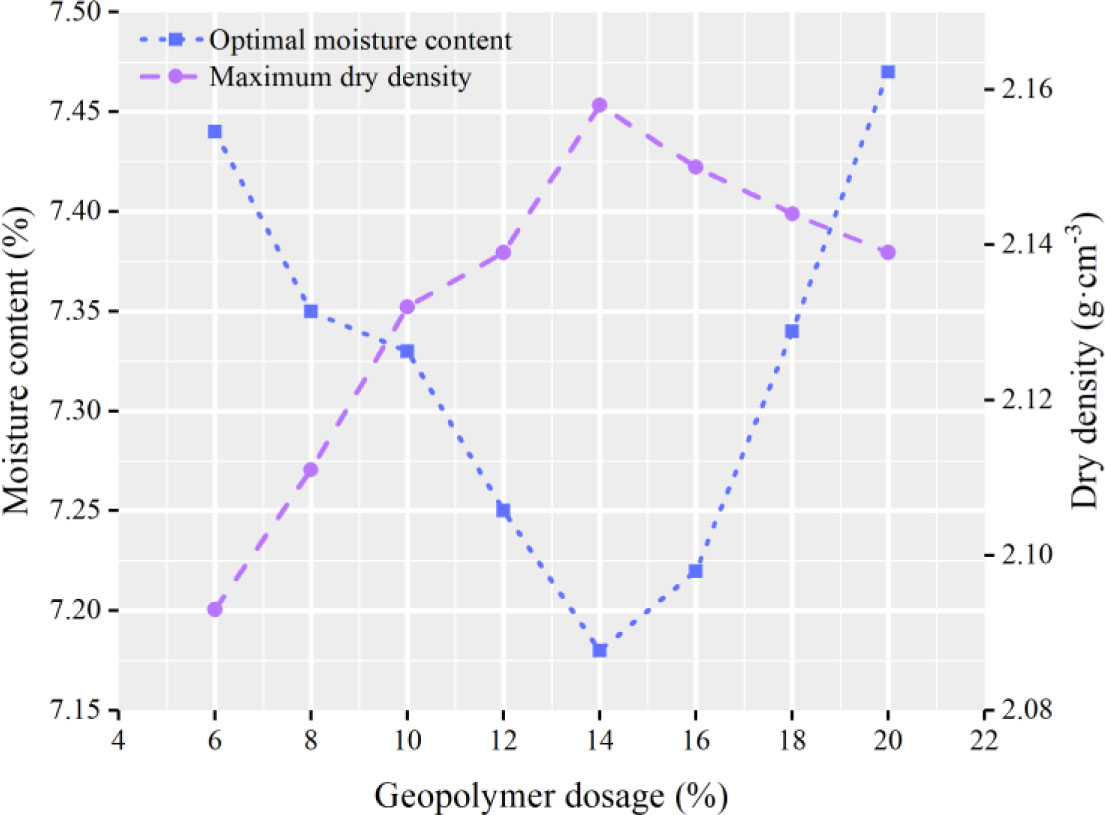
Figure 5:
Compaction test results
(2). Influence of geopolymer dosages on the strength of mixture
The effects of different dosages of geopolymer on the compressive strength and splitting strength of the GSG mixture at 7 d and 28 d are shown in Figure 6. As the dosage of geopolymer increased, both the compressive strength and splitting strength of the mixture continuously grow. The magnitude of this strength increase exhibited a trend of first rising and then decreasing, particularly after the dosage exceeded 14%, where the growth rate declined notably. This observation slightly differs from the findings of Chithambaram et al. (2018). A possible reason for this could be that when the dosage exceeded 14%, the dry density of the material decreased. However, under the same water usage conditions, the increase in the amounts of steel slag micro powder and FA led to a relative decrease in the liquid-solid ratio of the geopolymer, thereby enhancing the strength of the mixture (Vogt et al., 2019). Consequently, although the negative impact of dry density on strength was less significant than the positive impact of the liquid-solid ratio, the overall strength still showed an upward trend, albeit at a slower rate of increase. Additionally, the strength improved as the curing age extended. The extent of enhancement showed a trend of first increasing and then decreasing with rising dosages. When the geopolymer dosage reached 14%, the strength growth rate from 7 d to 28 d reached its maximum, with an increase of 105.8% in compressive strength and an increase of 107% in splitting strength.
The incorporation of geopolymer had a positive effect on the strength development of the mixture. An increased dosage of geopolymer further promoted the rapid progress of early hydration reactions, leading to the generation of more cementitious products and accelerating the increase of early strength. This is because, in an alkaline environment, Ca2+ can be released from the materials, promoting the solidification and hardening of cementitious materials such as C-A-S-H, which is beneficial for strength development (Ismail et al., 2014; Phoo-ngernkham et al., 2016). At the same time, the hydration reaction of geopolymer is a continuous process; as time increases, the reaction becomes more complete, resulting in a significant enhancement of strength.
Based on the results of compaction tests and mechanical strength tests, a geopolymer dosage of 14% of the total mass of the GSG mixture was selected for subsequent experiments.
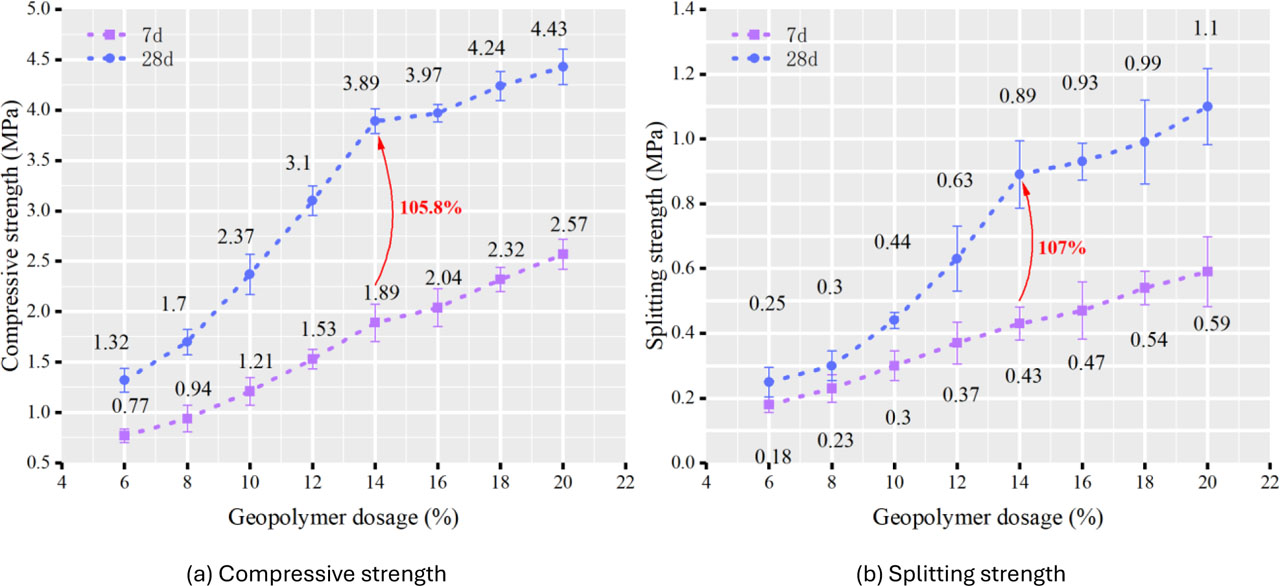
Figure 6:
Effects of geopolymer dosages on mechanical properties
3.2.2. Mechanical Strength Analysis of FGSG
(1). Compressive strength
Figure 7 shows the results of the unconfined compressive strength tests on GSG under different dosages, lengths of basalt fibre, and curing ages. The incorporation of basalt fibre had a strengthening effect on the compressive strength of the GSG mixture. When the dosage of basalt fibre was 0.15 v% and the length was 12 mm, the improvement was most pronounced. Under these conditions, the mixture exhibited the maximum compressive strength of 2.08 MPa at 7 d, 5.45 MPa at 28 d, and 8.03 MPa at 60 d. Compared to the control group without fibre, the unconfined compressive strength increased by 10.1% (7 d), 11.6% (28 d), and 9.4% (60 d) at each curing age. In terms of curing age, the strength of mixtures with different fiber lengths and dosages showed little variation over time. When compared to the compressive strength at 7 d, the strengths at 28 d and 60 d showed stable increases of approximately 160% and 290%, respectively.
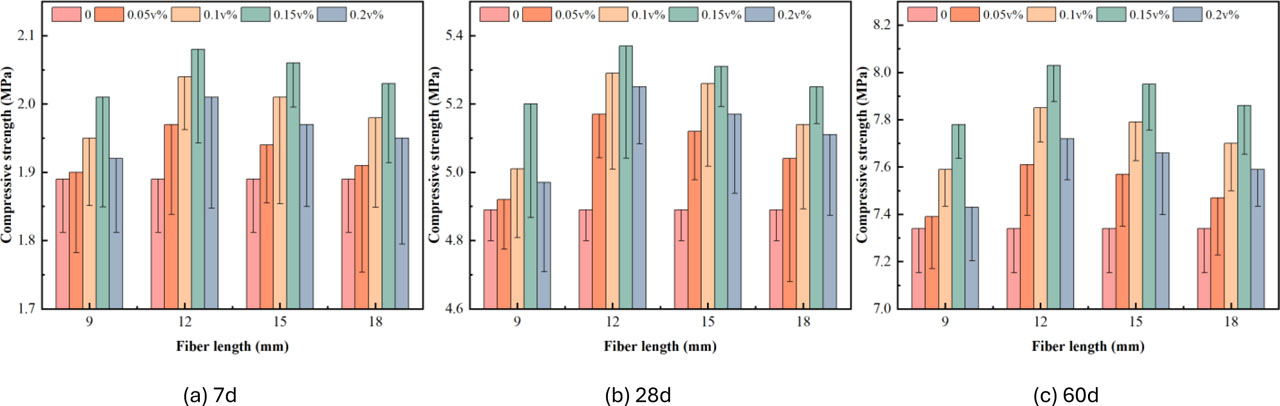
Figure 7:
Effect of fibre on compressive strength of mixture
(2). Splitting strength
Figure 8 shows the results of the splitting strength tests conducted on GSG with different fibre dosages and lengths at curing ages of 7 d, 28 d, and 60 d. The trend of fibre influence on the splitting strength of the mixture was like that of the compressive strength. When the fibre dosage was 0.15 v% with a length of 12 mm, the splitting strength also reached its maximum at each curing age. Compared to the blank control group, the splitting strength increased by 16.28% at 7 d, 21.05% at 28 d, and 15.6% at 60 d. Relative to the strength at 7 d, the splitting strengths at 28 d and 60 d exhibited increases of approximately 130% and 230%, respectively.
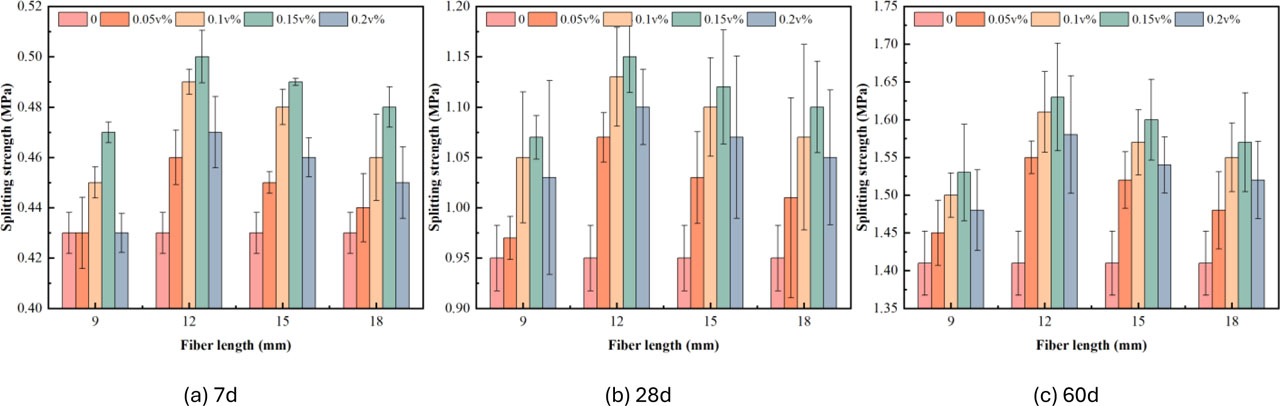
Figure 8:
Effect of fibre on splitting strength of mixture
Under varied curing ages, enhancements in unconfined compressive strength and splitting strength of GSG mixture were observed with different basalt fibre contents and lengths. The maximum strength values were achieved at the B3L2 mix proportion. An appropriate amount of basalt fibre can be evenly distributed throughout the mixture structure. Fibers of an appropriate length can combine with the matrix to form a complete network structure. When subjected to external forces, both have a good restraining effect on the expansion that occurs, effectively preventing the development of pores within the mixture, thereby giving the mixture better compressive and tensile performance (Qian et al., 2022). Therefore, the optimal content of basalt fibre in GSG mixture was determined to be 0.15 v%, and the optimal length was 12 mm.
3.3. Freeze-thaw Cycle Test of FGSG
Based on the mechanical performance results of FGSG, freeze-thaw cycle tests were conducted on the mixture with a fixed optimal dosage of 0.15 v% and five fibre lengths (0, 9, 12, 15, 18 mm), designated as B3L0, B3L1, B3L2, B3L3, and B3L4. This aims to investigate the impact of fibre length on the frost resistance of the mixture.
3.3.1. Effect of Freeze-thaw Cycles on Quality
The mass loss rate was used as an indicator to evaluate the impact of freeze-thaw cycles on the quality of FGSG, with the calculation formula shown in Equation (3). Figure 9 shows the variations in the mass of the mixture under different freeze-thaw cycle counts.
Where:
KD - the mass loss rate of specimen [%],
KD0 - the initial mass of specimen before freeze-thaw cycle [g],
KDn - the mass of specimen after n freeze-thaw cycles [g].
The figure indicated that the variation patterns of the five mixture compositions were generally the same. After three freeze-thaw cycles, the mass loss for all groups was negative, indicating that the mass of each composition was continuously increasing. The growth rates during this period were relatively similar, ranging from 0.15 v% to 0.2 v%. After three cycles, the mass of the specimens began to decrease, with the rate of mass loss only slowing down by the 12th cycle. The incorporation of fibres slightly inhibited the mass loss of the mixture, with the suppression effect of different lengths ordered as follows: L2 > L3 > L4 > L1. When the freeze-thaw cycles reached 12, the mass loss rates of the B3L1, B3L2, B3L3, and B3L4 groups decreased by 8.5%, 34.3%, 25.7%, and 14.3%, respectively, compared to the B3L0 group (with a mass loss rate of 3.5%) that contains no fibres.
The increase in mass of the specimens during the early stages of freeze-thaw cycles could be attributed to three main reasons: First, the initial presence of numerous irregular pores in the specimens allowed moisture to gradually enter these pores, which led to an increase in overall mass (Sun et al., 2021). Second, the Ca(OH)2 generated by the hydration products of the geopolymer could continue to undergo secondary hydration reactions, producing additional mass. Lastly, the mass loss due to freeze-thaw cycles primarily resulted from the spalling of the mixture, and the incorporation of fibres could effectively bond the matrix, reducing mass loss. The mass gained from water absorption and secondary hydration products far exceeded the mass loss through spalling. After six cycles, three mixture compositions (B3L2, B3L3, B3L4) still had a mass greater than their initial mass, indicating that basalt fibres longer than 12 mm had a significant effect in inhibiting the spalling of the mixture. However, once the specimens were nearly saturated with water, they experienced pressure from both internal and external moisture (Pilehvar et al., 2019). When the stress exceeded the tensile strength of the matrix, cracks formed in the specimens. The further development of these cracks would damage the internal structure, leading to particle redistribution and the formation of a new skeletal structure, resulting in material detachment (Mermerdaş et al., 2021; Pang et al., 2024). This was macroscopically observed as a decrease in mass, though the rate of decline eventually slowed.
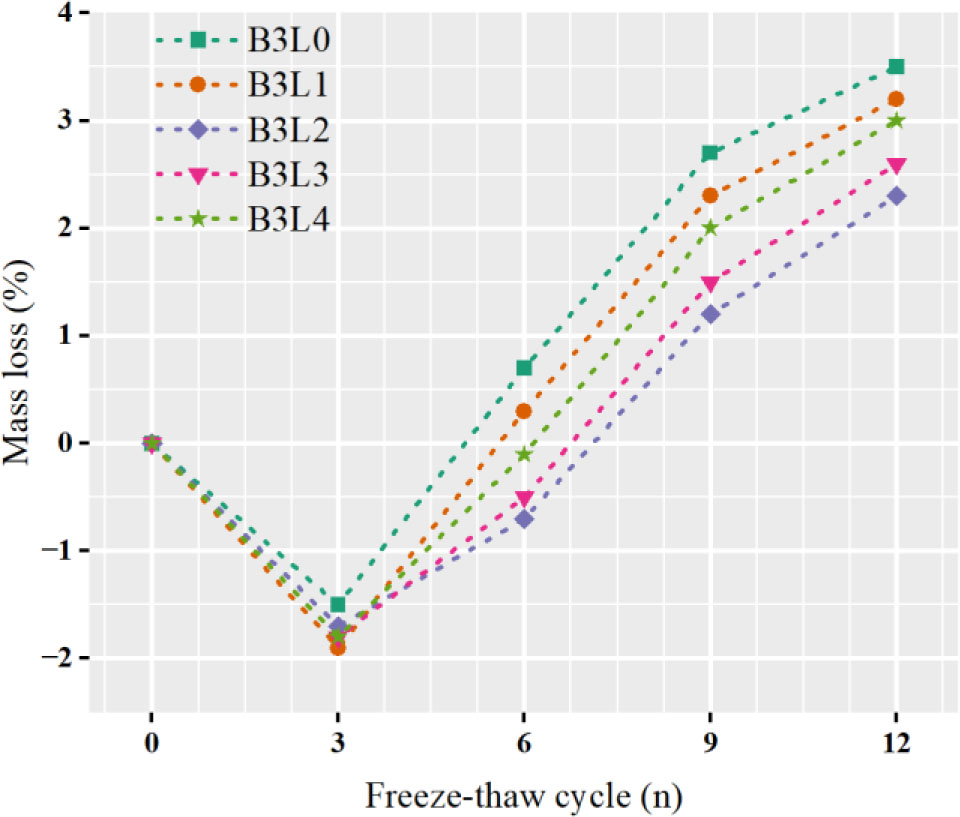
Figure 9:
Mass change rate of mixture under different freeze-thaw cycles
3.3.2. Effect of freeze-thaw cycles on unconfined compressive strength
The frost resistance performance of FGSG was further evaluated using the frost resistance coefficient (BDR), with the calculation formula presented in Equation (4) and the results shown in Table 8.
Where:
BDR - the freezing resistance coefficient,
RDC - the compressive strength of the specimen after freeze-thaw cycle [MPa],
RC - the standard compressive strength of the specimen [MPa].
As the number of freeze-thaw cycles increased, the compressive strength of the FGSG mixture showed a marked decline, and this trend became more pronounced with the increasing number of cycles. For the same number of freeze-thaw cycles, the order of BDR for the mixtures was B3L2 > B3L3 > B3L4 > B3L1 > B3L0. The test groups with fiber incorporation exhibited both higher compressive strength and strength retention rates compared to the blank control group (B3L0). When the fiber length was optimal at 12 mm, the compressive strength loss rates of the mixture after 3, 6, 9, and 12 cycles were 2.98%, 6.33%, 10.61%, and 17.13%, respectively. The strength loss rates of the fiber-free B3L0 group for different cycles are 5.24%, 9.48%, 14.11%, and 19.36%. The BDR of the B3L2 group, which showed the best frost resistance, increased by 2.26%, 3.07%, 3.5%, and 2.23% compared to the B3L0 group at different cycles. After 12 cycles, the BDR for all five fibre lengths remained above 80%. Under repeated freeze-thaw conditions, the frost resistance performance of the mixture gradually diminished. The incorporation of fibres effectively enhanced the frost resistance of the mixture at lower numbers of freeze-thaw cycles; however, this enhancement gradually lessened with increasing cycles.
Table 8:
Effect of different number of freeze-thaw cycles on BDR
| Group | RC / MPa | Cycles | RDC / MPa | BDR / [%] | Cycles | RDC / MPa | BDR / % |
|---|---|---|---|---|---|---|---|
| B3L0 | 4.96 | 3 | 4.70 | 94.76 | 9 | 4.26 | 85.89 |
| B3L1 | 5.20 | 3 | 4.98 | 95.77 | 9 | 4.51 | 86.73 |
| B3L2 | 5.37 | 3 | 5.21 | 97.02 | 9 | 4.80 | 89.39 |
| B3L3 | 5.31 | 3 | 5.15 | 96.99 | 9 | 4.71 | 88.70 |
| B3L4 | 5.25 | 3 | 5.07 | 96.57 | 9 | 4.63 | 88.19 |
| B3L0 | 4.96 | 6 | 4.49 | 90.52 | 12 | 4.00 | 80.64 |
| B3L1 | 5.20 | 6 | 4.78 | 91.92 | 12 | 4.22 | 81.15 |
| B3L2 | 5.37 | 6 | 5.03 | 93.67 | 12 | 4.45 | 82.87 |
| B3L3 | 5.31 | 6 | 4.95 | 93.22 | 12 | 4.37 | 82.29 |
| B3L4 | 5.25 | 6 | 4.87 | 92.76 | 12 | 4.30 | 81.90 |
3.4. Microscopic Mechanism Analysis
3.4.1. Analysis of Geopolymer Strength Formation Mechanism
Geopolymers at a slag-to-powder ratio of 3:7, an alkali content of 8% and a water glass modulus of 1.4 were selected for microanalysis. Figure 10 shows the SEM and XRD tests results of geopolymer at 7d and 28d curing age.
In Figure 10.a, it could be observed that in the geopolymers composed of steel slag micro powder and FA at 7 d, there were many exposed spherical FA particles. The surfaces of the particles had developed a substantial amount of amorphous C-S-H and a small quantity of three-dimensional C-A-S-H gel, forming an incompletely continuous spatial network structure. Additionally, numerous cracks were present, characterized by generally large widths. As the curing age extended to 28 d, hydration reactions generated more C-A-S-H gel and acicular ettringite (AFt), which interweaved and filled some of the surface cracks, resulting in a denser network structure that made the overall structure more compact (Figure 10.b). In Figure 10.c, XRD analysis of the geopolymers at 7 d and 28 d showed multiple peaks in the range of 20°~40° (2θ), primarily consisting of C-S-H, ettringite, and a small amount of Ca(OH)2. As the curing age increased from 7 d to 28 d, the diffraction peaks of the hydration products also increased, with C-S-H being the main hydration product. The results from SEM and XRD corroborated each other, indicating that the hydration reaction of the geopolymer was a continuous process. The main hydration product, C-S-H and C-A-S-H, continuously filled the gaps, making the structure denser, while its three-dimensional network structure tightly linked the particles together, which macroscopically results in an increase in strength (Ji et al., 2023).
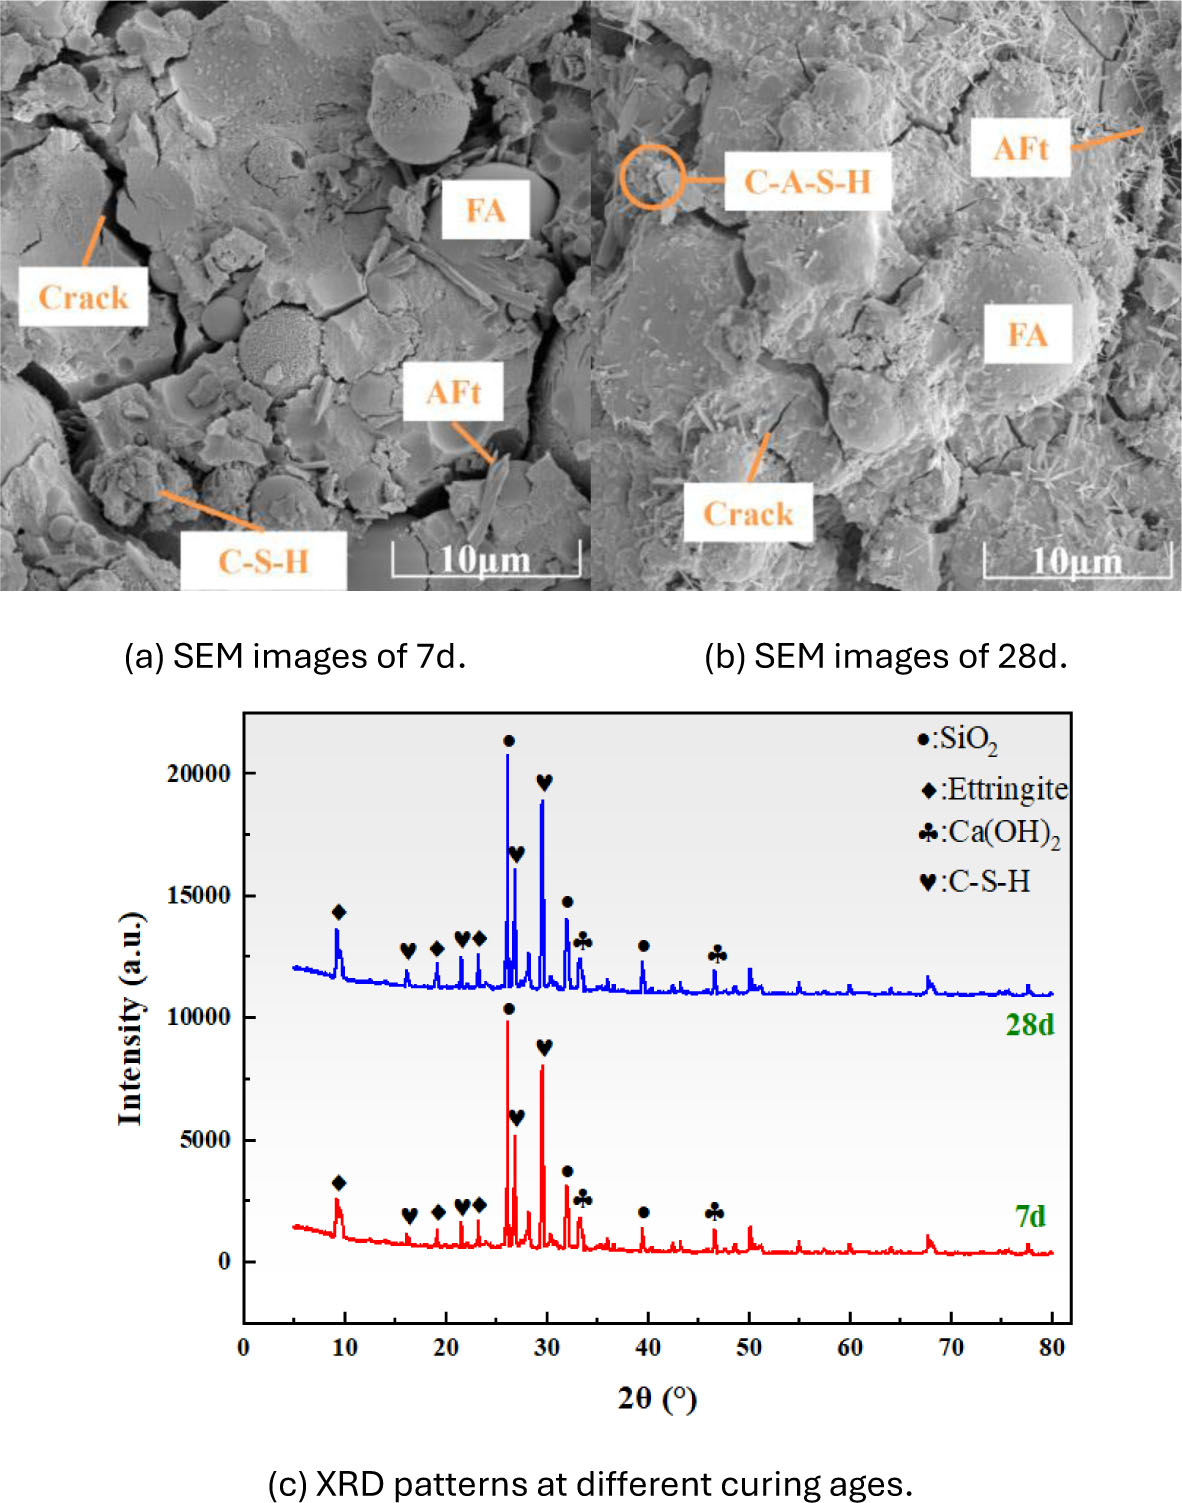
Figure 10:
SEM and XRD images of geopolymer
3.4.2. Mechanism Analysis of FGSG
SEM-EDS tests were conducted on B3L2 group FGSG specimens cured for 7 d and 28 d to observe and analyse their internal micro-morphology and hydration products. The interface between the fibres and the mixture is shown in Figure 11, while the results of the SEM-EDS tests are presented in Figure 12.
In Figure 11, it could be observed that the fibres were closely bonded to the slurry in a cylindrical shape, with the surfaces wrapped in a significant amount of gel material, indicating that the geopolymer had undergone a sufficient polymerization process around the fibres. As seen in Figure 12. a and b, the structure of the mixture at 7 d possessed a certain level of integrity; however, there were numerous micro-cracks present at the surface. The surfaces of the fly ash particles within the mixture were smooth and attached with a small amount of fluffy material, while AFt was interspersed within the pores and cracks. EDS analysis showed that the main elemental composition at this stage includes O, Ca, Si, Na, C, and Al, indicating that the predominant early hydration product was C-S-H. In Figure 12.c and d, the matrix of the mixture tightly bonded with the aggregates, and a large amount of binding material adhered to the surfaces of the steel slag micro powder and fly ash particles. A significant quantity of AFt was uniformly distributed, emerging from the pores and cracks of the mixture matrix, creating a cross-linked distribution in space. Compared to the 7 d, the structure was more compact, with a noticeable reduction in the number and size of micro-cracks. The predominant elements at this stage were O, Si, Al, C, and K, and a large amount of aluminium interacted with the C-S-H gel to form C-A-S-H (Wei et al., 2018). The early hydration products mainly consisted of AFt, C-S-H, and Ca(OH)2. As the curing age increased, the hydration of steel slag micro powder released a larger amount of Ca2+, promoting the hydration reaction rate of the fly ash in alkaline conditions and accelerating the formation rates of C-S-H and AFt. The increase in Ca2+ concentrations promoted the continuous formation of Ca(OH)2, which provided suitable alkaline conditions for the generation of AFt. With the ongoing acceleration of the reaction, Ca(OH)2 reacted with Si and Al to form C-S-H and C-A-S-H gels before it crystallized, filling the internal pores.
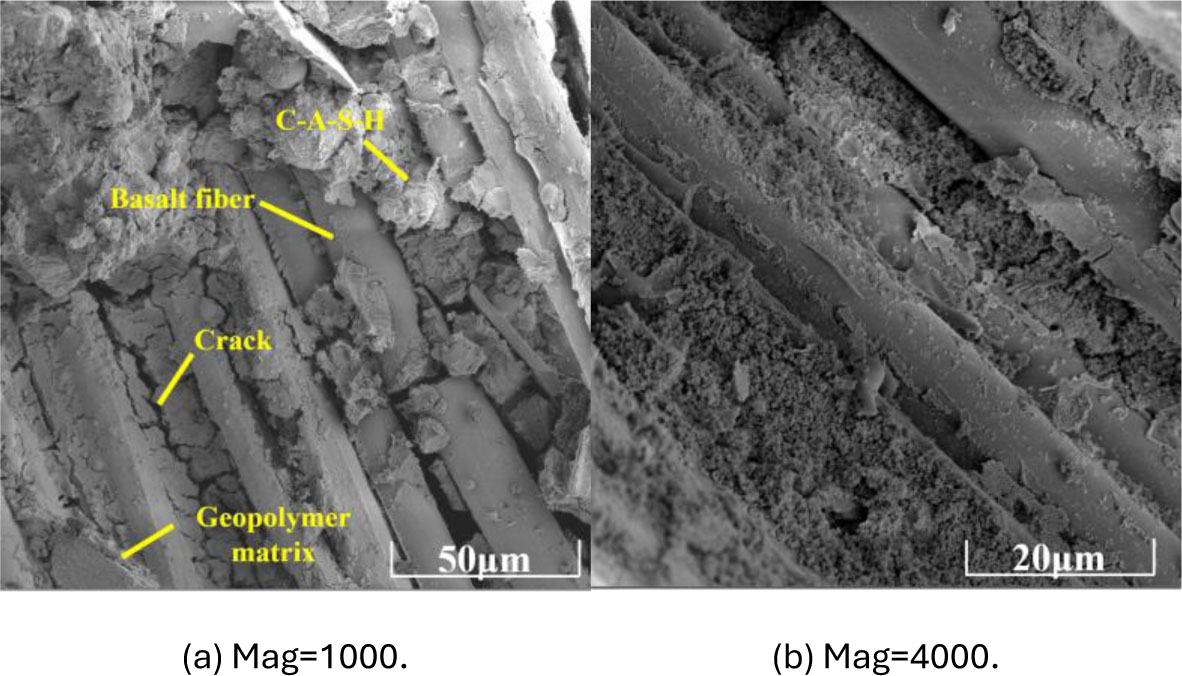
Figure 11:
Interface between the fibres and the mixture
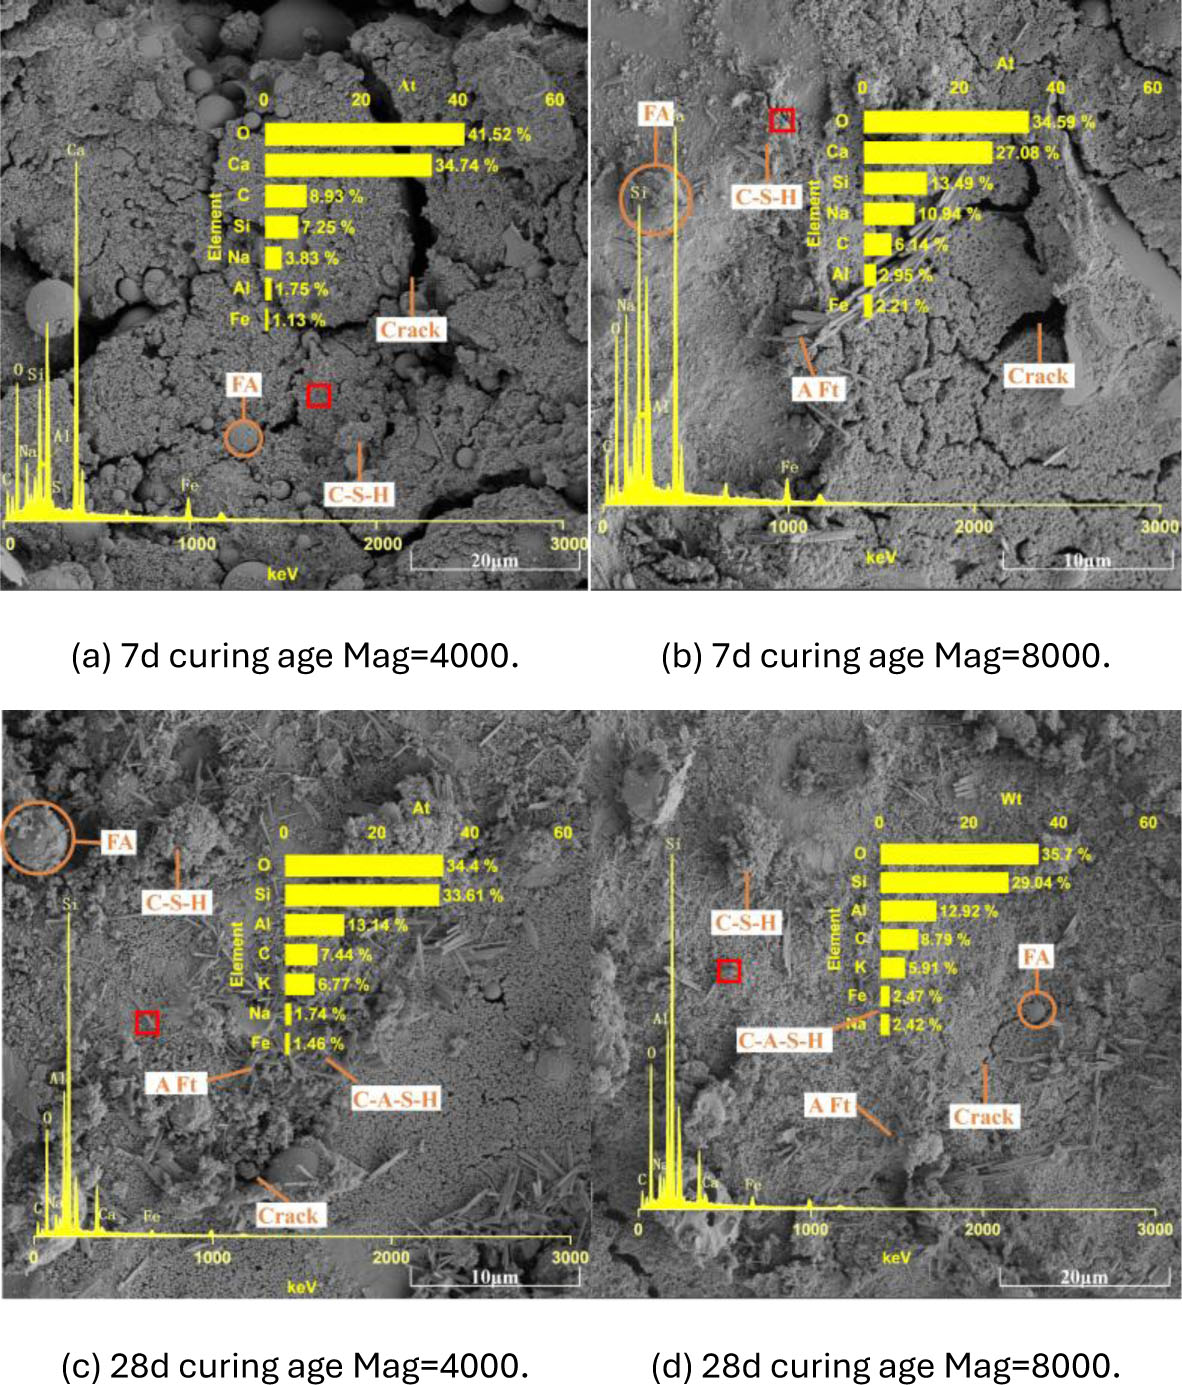
Figure 12:
SEM-EDS images of FGSG at different curing ages
3.4.3. Analysis of Microscopic Mechanism of Freeze-thaw Cycle
The internal microstructure of B3L2 specimens under different cycles was observed by SEM test, and the results are shown in Figure 13. During early stages (3 cycles), abundant ettringite formation was observed within the microstructure (Figure 13.a), which was produced by secondary hydration reactions promoted by water penetration during the melting stages. Significant internal expansion stress was generated during the crystallization of ettringite, which accelerated crack propagation (Min & Mingshu, 1994). At the same time, the structure around fly ash particles was loose, and the bond with the matrix was weak (Figure 13.b). These were direct manifestations of early deterioration.
As the number of cycles increased to six, the overall structure of the mixture became progressively loose, and the bond strength decreased (Figure 13.d), reflecting the accumulation of damage. At this time, some fly ash particles began to detach, cracks around the particles continued to propagate, and a large number of small pores began to form (Figure 13.c). In the later stages (9 and 12 cycles), the pores expanded into voids (Figure 13.e), and cracks interconnected with each other (Figure 13.g), leading to a continuous network. Internal damage transitions from local to overall degradation. A large amount of dispersed cementitious material indicated that hydration products (such as C-S-H) had fractured or been destroyed under stress. The widening and increasing of cracks (Figure 13.h) were the results of the continuous reduction in bond strength of the damaged matrix under repeated internal stresses.
In summary, the freeze-thaw damage process observed at the micro level provides a fundamental explanation for the macroscopic performance. It is worth mentioning that the significant spalling of fly ash and the overall mass loss during the freeze-thaw process may exceed that of certain conventional fly ash-based geopolymer stabilization materials. This could be attributed to the incorporation of aeolian sand, as the 50% content of aeolian sand far exceeds the number of fine aggregates typically used in conventional base layer designs. The weakened interlocking ability between the aggregates is a key factor contributing to the decline in various properties (Liu et al., 2023).
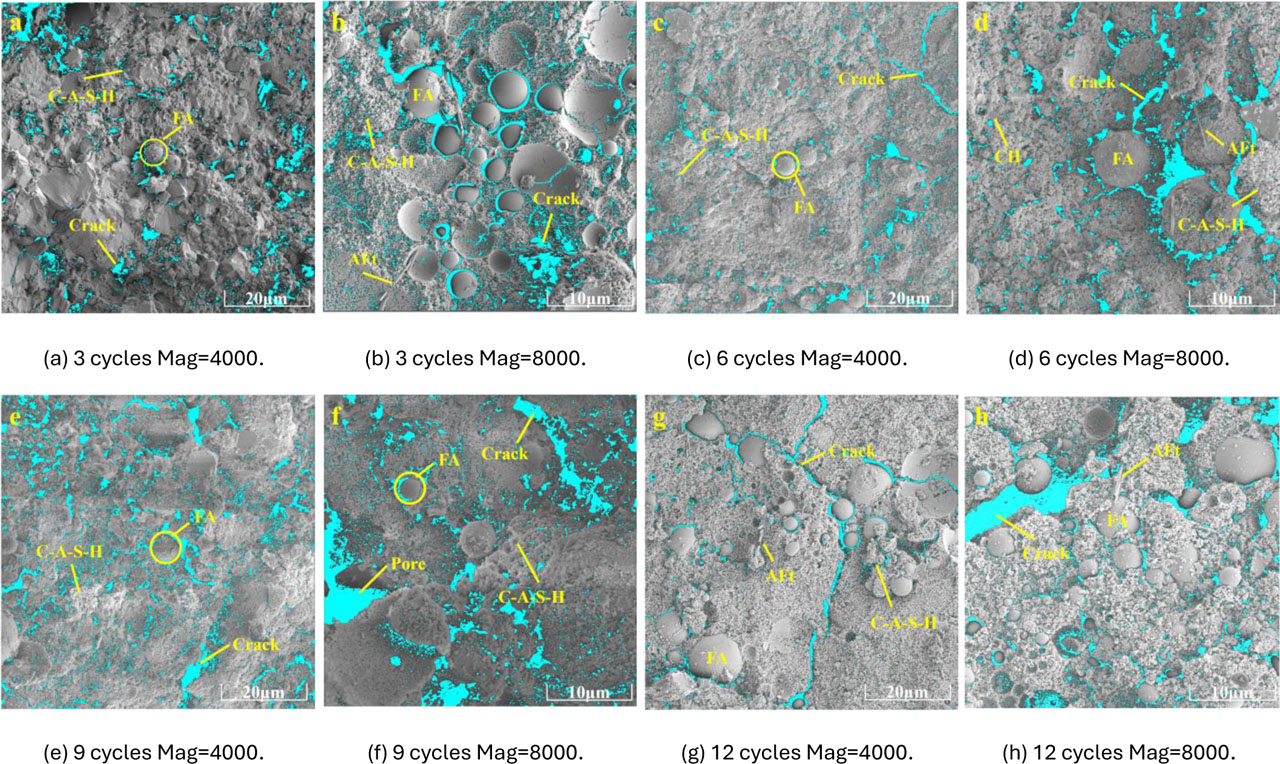
Figure 13:
Microstructure evolution of specimens with different freeze-thaw cycles
4. Conclusion
This study systematically investigates the basalt fibre-reinforced steel slag micro powder-fly ash geopolymer stabilized aeolian sand gravel in terms of mechanical properties, frost resistance, and micro-mechanisms. The main conclusions are as follows:
(1) The order of influence of various factors on the compressive strength and splitting strength of the geopolymer paste was as follows: alkali content > water glass modulus > slag-to-powder ratio. The optimal ratio was slag-to-powder ratio = 3:7, alkali content = 8%, and water glass modulus = 1.4.
(2) When the geopolymer content was 14%, the GSG mixture exhibited the highest dry density and the lowest water content. At this point, the mechanical strength growth rate in the later stages was maximal, with the compressive strength increasing by 105.8% and the splitting strength increasing by 107%.
(3) Basalt fibre had a positive effect on the mechanical strength of the GSG mixture. When the incorporation rate was 0.15 v% and the length was 12 mm, the enhancement effect was most significant.
(4) The incorporation of basalt fibre also improved the frost resistance of the GSG mixture. As the number of freeze-thaw cycles increased, the mass of FGSG first increased and then decreased, while the compressive strength continued to decline. After 12 cycles, the compressive strength remained above 80%.
(5) The early hydration products of the geopolymer paste mainly consisted of amorphous gel C-S-H, needle-like AFt, and Ca(OH)2. As the hydration reaction progressed, more aluminium elements were released, which reacted with C-S-H to form a three-dimensional network structure of C-A-S-H, becoming the main hydration product in the later stages. These hydration products were interspersed throughout the paste and in cracks, making the overall structure denser, which was the primary reason for the strength formation.
(6) The incorporation of basalt fibre connected the cracks, allowing geopolymer reactions to occur around the fibres, which enhanced the compactness of the mixture and improved the compressive and splitting strengths.
(7) With the increase in freeze-thaw cycles, fatigue damage occurred within the fibre geopolymer matrix, and mixture mass loss led to a decrease in mass and strength. However, the inclusion of fibres enhanced the connectivity of the internal matrix of the mixture, reducing the mass loss rate and minimizing strength loss.
Acknowledgements
This study was funded by the Scientific Research Fund of Xinjiang Design Institute (KY2024011501).
Notes
[2] Contributed by Author Contributions
Jie Liu: Conceptualization, Funding acquisition, Project administration, Resources, Supervision, Writing – review and editing. Bo Wu: Data curation, Formal analysis, Visualization, Writing – original draft. Chao Pu: Investigation, Project administration, Resources, Supervision. Jizhen Bao: Investigation, Project administration, Resources, Supervision. Bin Wang: Investigation, Project administration, Resources, Supervision. Chunsheng Zhu: Data curation, Supervision, Validation, Writing – review and editing.
Jie Liu and Bo Wu have contributed equally to this work.