

1. Introduction
Global infrastructure development has led to increased construction on problematic soils, particularly for projects such as highways, railways, and residential buildings (Bhattacharyay, 2012). In many regions, engineers are compelled to work with expansive soils, which are known for their volume changes in response to variations in moisture. These changes can cause severe structural issues, including settlement and cracking (Barman & Dash, 2022).
Expansive clay soils pose significant engineering challenges due to their high plasticity and low shear strength (Fattah et al., 2015; Safi & Singh, 2022). Stabilization is often necessary to improve their strength, durability, and resistance to moisture-related deformation.
Traditional stabilization methods involve the use of chemical additives, such as lime, cement, or fly ash, which promote pozzolanic reactions that strengthen the soil over time (Afrin, 2017). However, these methods have limitations, including environmental concerns, cost, and incompatibility with high-organic or high-sulfate soils (Conner & Hoeffner, 1998; Nayem, 2023).
Among traditional approaches, cement stabilization is commonly used in transportation projects. Wibawa and Maharani (2024) demonstrated its effectiveness in improving clay subgrades along the Kuta-Tanah Lot road in Bali, where seasonal damage is frequent. Their study showed that cement significantly increased compressive strength and reduced plasticity, confirming its suitability for stabilizing expansive soils.
As sustainable development becomes a global priority, attention has shifted toward eco-friendly stabilization techniques, particularly the use of natural fibers (Bordoloi et al., 2017). Plant-based fibers are biodegradable, cost-effective, and widely available, with proven benefits in reinforcing soils and enhancing mechanical performance (Guo et al., 2019; Lau et al., 2018).
Recent studies have demonstrated the effectiveness of fiber reinforcement in improving soil strength and deformation behavior (Al-Sumaiday et al., 2024). However, most of these studies focus on synthetic fibers, with limited exploration of natural, biodegradable alternatives.
Among these, luffa fiber, derived from Luffa cylindrica, has gained attention due to its high cellulose content, low density, renewability, and minimal environmental footprint (Adeyanju et al., 2020; Daniel-Mkpume et al., 2019). Unlike fibers like hemp or kenaf, luffa grows under a wider range of conditions and does not require intensive agricultural inputs (Prokofyeva, 2024; Sikder & Mumit, 2024).
This study explores the effectiveness of luffa fiber in improving the geotechnical behavior of expansive clay. Luffa fiber was added to the soil in varying contents (0.5%, 1.0%, 1.5%, and 2.0% by weight), and its influence was assessed through:
Free swell and swelling pressure tests
Atterberg limits (liquid limit, plastic limit, and plasticity index)
Standard Proctor compaction test
pH variation
Methylene Blue Value
Shear strength test
To further understand the interaction between luffa fiber and soil, X-ray diffraction (XRD) and X-ray fluorescence (XRF) were conducted to study mineralogical and chemical changes, while scanning electron microscopy (SEM) was used to analyze microstructural characteristics.
This work aims to evaluate luffa fiber as a sustainable and effective alternative for stabilizing expansive clay soils, contributing to the development of green geotechnical solutions.
This investigation is particularly relevant, as there are ongoing plans to construct buildings, roads, and other infrastructure in the region where such expansive soils are prevalent. The goal is to evaluate luffa fiber as a sustainable and effective alternative for stabilizing these soils, contributing to the development of green geotechnical solutions.
2. Methodology
2.1. Research Design
This study adopts an experimental research design to investigate the stabilization of expansive clay soil using natural luffa fibers.
A series of laboratory tests was conducted on both untreated and fiber-treated soil samples to evaluate the physical and mechanical improvements resulting from fiber inclusion.
The experimental program included Atterberg limits, Methylene Blue test, Proctor compaction, pH measurement, free swell test, shear strength test, and advanced characterization techniques such as X-ray diffraction (XRD), X-ray fluorescence (XRF), and scanning electron microscopy (SEM).
This design enabled a detailed analysis of the effects of luffa fiber addition on soil behavior and helped assess its potential as an eco-friendly stabilizing agent.
2.2. Materials and Procedures
2.2.1. Untreated soil (Expansive clay) and Luffa fiber
The soil sample used in this study is a grey expansive clay, collected from a depth of 1.2 meters below the ground surface in the Hammam N'Bail area, approximately 7 km from Guelma Province in northeastern Algeria. The test pit method was chosen for sampling due to its advantages, including direct visual inspection of soil layers, the ability to collect large and representative samples, and the opportunity to observe stratigraphy and in situ consistency. Excavation was carried out using a mechanical loader, and the extracted samples were carefully sealed in plastic bags to preserve their natural moisture content and structure during transport to the laboratory for comprehensive geotechnical characterization. The natural moisture content of the sample was found to be 19.01%.
Figure 1 shows shrinkage cracks on the surface of the clay soil in the Hammam N’Bail area, near Guelma (Algeria), a region known for its well-documented shrinkage issues.
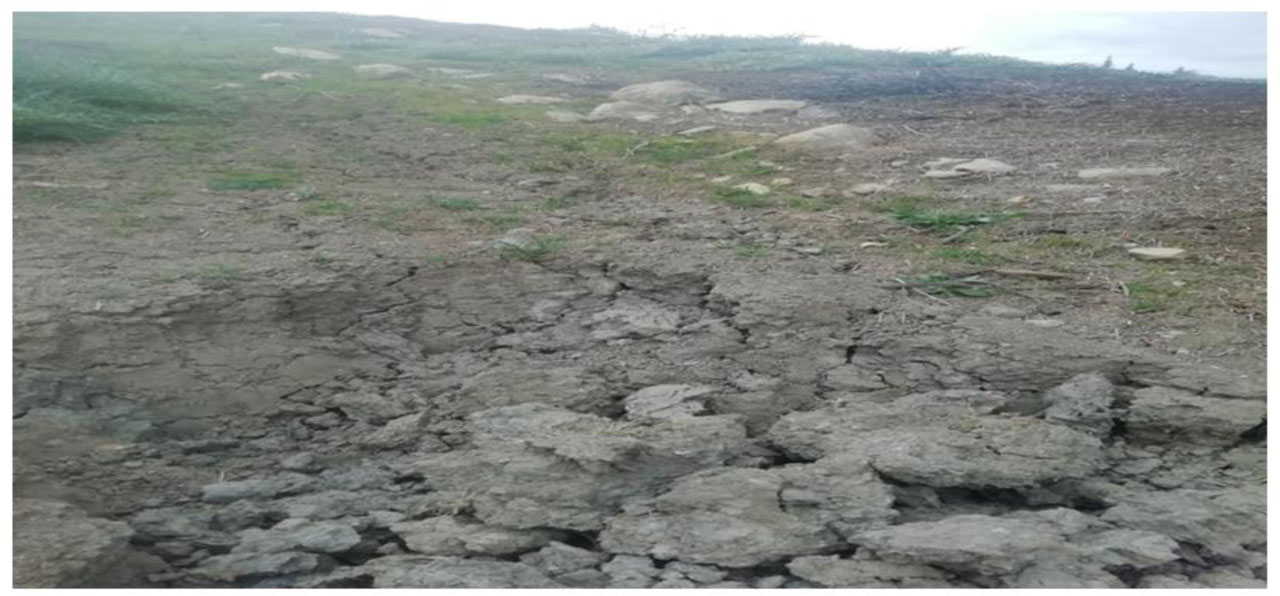
Figure 1:
Surface shrinkage cracks in clay soil
The soil used in this study was sampled approximately 7 km northwest of Hammam N’Bail, along the main road to Guelma city, in northeastern Algeria (approximate coordinates: 36.3436° N, 7.6252° E). This semi-rural area experiences a semi-arid climate with marked seasonal variations in temperature and moisture.
Geologically, the region is part of the Neogene formations of northeastern Algeria, which are predominantly composed of high-plasticity clayey soils. These are classified as CH (high-plasticity clays) under the Unified Soil Classification System (USCS) and are characterized by expansive behavior, including notable shrink-swell potential.
Field observations at the sampling site revealed surface shrinkage cracks, seasonal ground heave, confirming the problematic nature of the soil. This makes the site particularly suitable for investigating sustainable stabilization techniques using natural materials.
Recently, numerous researchers have used luffa aegyptiaca fibers as reinforcement in the development of natural fiber composites to evaluate their performance in various matrix systems. In this study, these fibers were used to reinforce an expansive clay matrix. To obtain the fibers, commercially available luffa aegyptiaca fruits, commonly used for household purposes such as dishwashing or body scrubbing, were utilized. Figure 2 presents the mature luffa fruit and its fiber structure. Luffa fibers exhibit notable toughness, strength, and stiffness, comparable to those found in certain metals of similar density (Jino et al., 2017).
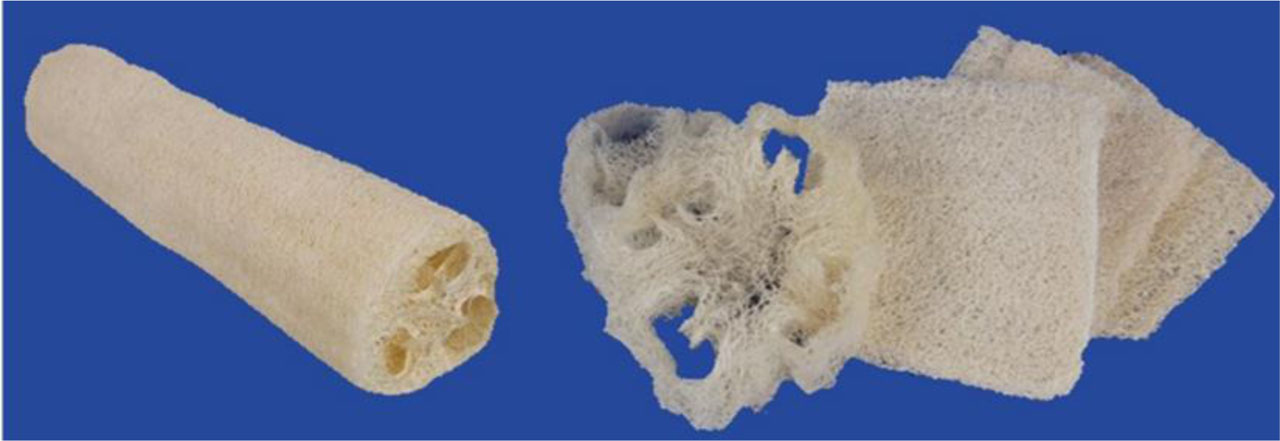
Figure 2:
Luffa and its internal structure
The fruits were procured and prepared for reinforcement applications. They were thoroughly washed and sundried to remove impurities. Once dried, the sponge-like structure was manually cut with scissors to extract fibers of varying lengths (ranging from 0.315 mm to 2 mm), with an average diameter of approximately 0.27 mm. Additionally, granules of various sizes, ranging from 0.25 mm to 0.063 mm in diameter, were also obtained.
The raw fibers were soaked in a 5% sodium hydroxide (NaOH) solution as part of an alkaline treatment to enhance their durability and reduce biodegradability. Chemical treatments with agents such as NaOH can significantly increase the surface roughness of luffa fibers, remove impurities, and reduce water absorption, thereby improving their overall performance characteristics. Following the chemical treatment, the luffa fibers were thoroughly washed and dried at 60 °C for 2 hours (Kamran et al., 2022). After testing and characterization, the treated luffa aegyptiaca fibers were used as reinforcement material in the expansive clay matrix. The resulting material, consisting of a mix of fibers is shown in Figure 3 below.
To ensure uniform distribution of luffa fibers within the soil matrix, the fibers were first cut into manageable lengths. A dry mixing process was used before moisture was added, and fiber portions were introduced incrementally to avoid clumping. To minimize the loss of luffa fibers due to their lightweight and tendency to become airborne, especially under windy conditions, the fibers were kept slightly moist rather than completely dried before cutting and mixing. This slight moisture helped reduce fiber dispersion and ensured better handling during the preparation process.
Mixing continued until a uniform blend was visually confirmed. For field applications, mechanical mixing is recommended to ensure even fiber distribution at larger scales.
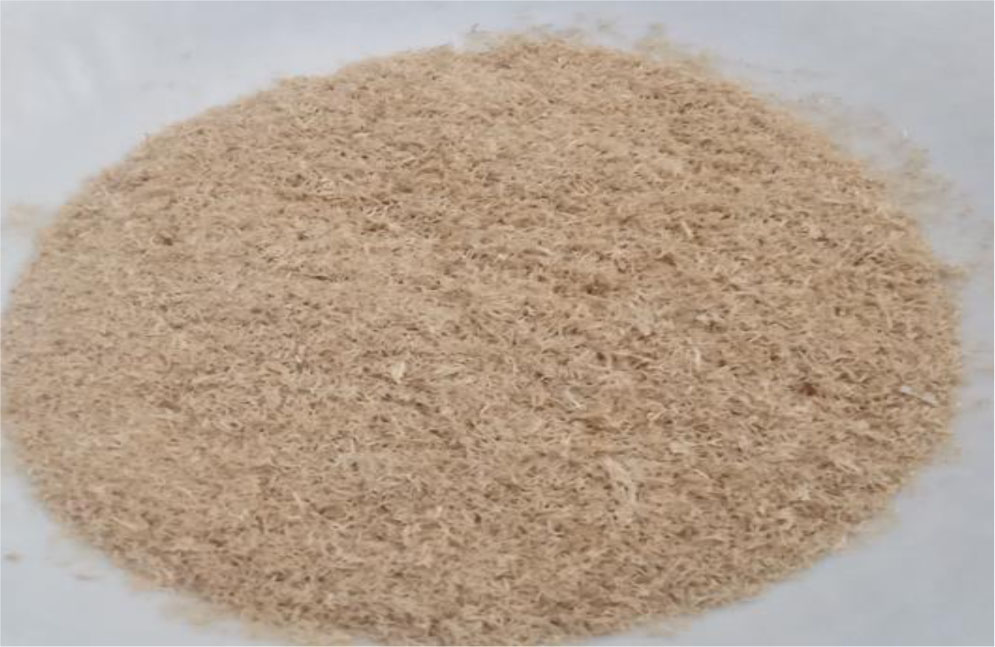
Figure 3:
Luffa fiber used in this study
2.2.2. Physical, Mechanical, and Chemical Characteristics of Untreated Soil
Tests were conducted on natural soil samples to determine their physical, chemical, and geotechnical properties. The samples were analyzed for physical and engineering characteristics, and the results are presented in Tables 1 and 2.
Table 1:
Physical properties of the used soil
| Property | Value | Property | Value |
|---|---|---|---|
| Liquid Limit, LL [%] | 63.342 | Water content at saturation, Wsat (%) | 24.02 |
| Plastic Limit, PL [%] | 27.74 | Degree of saturation, Sr (%) | 79.12 |
| Plasticity Index, IP [%] | 35.602 | unit weight of water γw [kN/m3] | 9.81 |
| Consistency Index, IC [%] | 1.245 | Moist unit weight, γh, [kN/m3] | 19. 30 |
| Liquidity Index, IL [%] | − 0.245 | Unit weight of soil solids, γs, [kN/m3] | 26.78 |
| Specific Gravity (Gs) | 2.73 | ||
| Void ratio, e | 0.656 | dry unit weight, γd [kN/m3] | 16.22 |
| Porosity, n | 0.396 | Saturated unit weight, γSat [kN/m3] | 20.105 |
| specific surface area [m2/g] | 109 | Soil classification (USCS) | CH |
| Natural water content, WN [%] | 19.01 | Soil classification (GTR) | A3m |
Table 2:
The main mechanical properties of the soil used
| Property | Value |
|---|---|
| Free swell [%] | 10.32 |
| Swelling pressure [kN/m2] | 164 |
| Pre-consolidation stress [kN/m2] | 2.58 |
| Swelling index Cg | 0.0897 |
| Compression index Cc | 28.06 |
| Over-consolidation ratio (OCR) | 12.59 |
| Maximum dry unit weight, γdmax [kN/m3] | 16.33 |
| Optimum moisture content, OMC [%] | 19.21 |
Sieve analysis and sedimentation tests were conducted to determine the particle size distribution of the soil. Figure 4 presents the grain size distribution curve of the soil sample, providing a visual representation of the results.
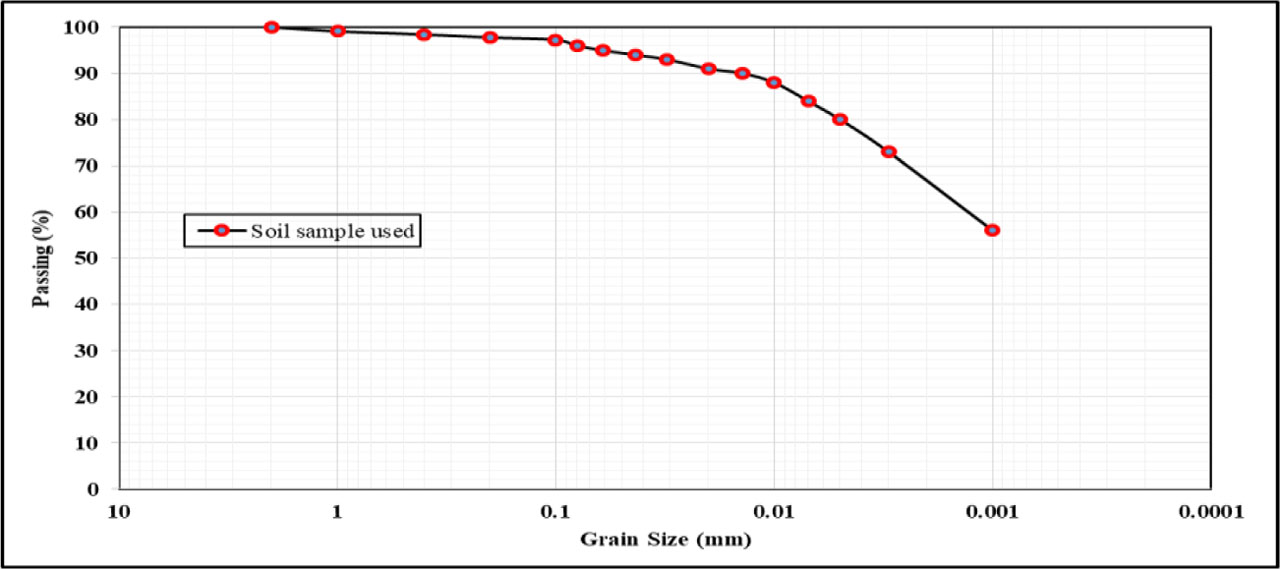
Figure 4:
Particle size distribution of the soil sample used in this study
The particle-size distribution indicates that the soil consists of 7.90% sand, 25.05% silt, and 66.47% clay. The liquid limit and plastic limit are 63.342% and 27.74%, respectively. Based on these values, the soil is classified as clay with intermediate plasticity. The one-dimensional free swell is approximately 10.32% for both natural and compacted specimens under a seating pressure of 6.9 kPa. Chemical properties were also evaluated following European standards NF EN 17542-3 and NF ISO 10390 (Association Française de Normalisation, 2022), and the results are summarized in Table 3 below.
2.2.3. X-Ray Fluorescence (XRF) Analysis of Untreated Soil
X-Ray fluorescence (XRF) is a rapid, non-destructive analytical technique used to determine the elemental composition of materials. Key advantages include minimal sample preparation, high sensitivity, and the ability to analyze solid samples directly.
In this study, the chemical composition of the untreated soil, determined by XRF analysis, is presented in Table 4. The results indicate that the major components are silicon dioxide (SiO2), calcium oxide (CaO), aluminum oxide (Al2O3), and iron oxide (Fe2O3).
It is worth noting that the predominant mineral in the soil, as determined by X-ray fluorescence (XRF) analysis, is quartz (SiO2), with a content of approximately 45%. Additionally, the particle-size distribution indicates that the soil consists of 7.90% sand, 25.05% silt, and 66.47% clay. The liquid limit and plastic limit are 63.34% and 27.74%, respectively. Based on these properties, the soil is classified as an inorganic clay of low to medium plasticity.
Table 4:
Chemical composition of the soil used (X-ray fluorescence analysis)
| Compound | Soil used [%] |
|---|---|
| SiO2 | 45.4 |
| Al2O3 | 15.8 |
| Fe2O3 | 4.74 |
| CaO | 17.198 |
| MgO | 2.3 |
| SO3 | 0.664 |
| K2O | 2.035 |
| Na2O | 0.3 |
| Cl | 0.021 |
Free swell, or volume change, is defined as the ratio of the increase in thickness to the initial thickness of a soil sample compacted at optimum moisture content, placed in a consolidation ring, and soaked under a seating surcharge of 6.9 kN/m2 following XP P94-091 (Association Française de Normalisation, 1995). In contrast, the pressure exerted by expansive soil when it is not allowed to swell, or when volume change is restricted, is referred to as the swelling pressure.
2.2.4. Scanning electron microscopy (SEM) of Untreated soil and Luffa Fiber
Scanning Electron Microscopy (SEM) is a powerful imaging technique widely used in materials science to examine surface morphology and microstructural features at high magnification. It is particularly effective for analyzing fine-grained materials such as clays and silts, offering valuable insights into their physical behavior.
A key advantage of SEM is its ability to produce detailed, quasi-three-dimensional surface images using secondary electron (SE) detection, enabling high-resolution observation of particle shape, texture, cracks, and porosity (see Figure 5).
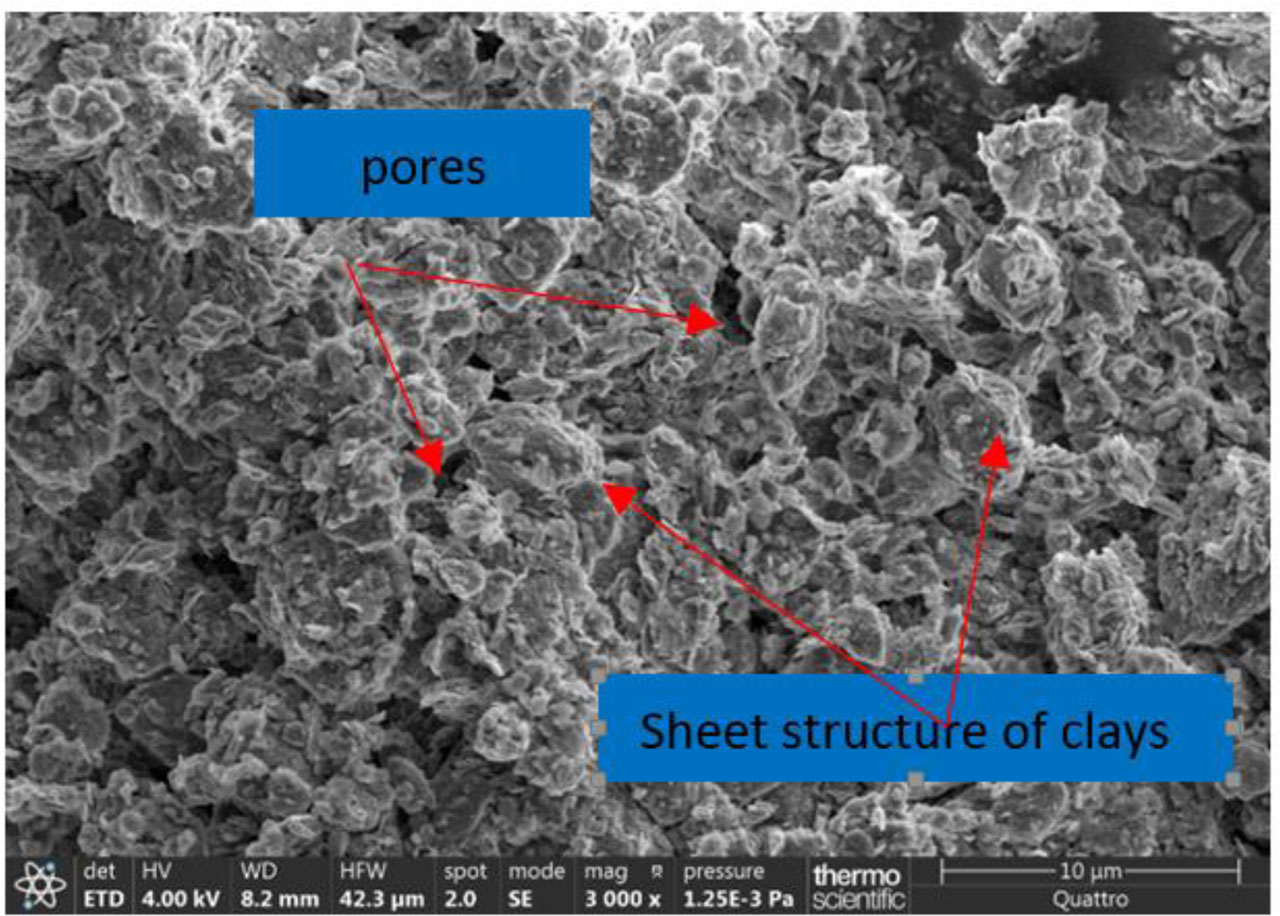
Figure 5:
A micrograph of the untreated expansive soil sample
In secondary electron (SE) mode, the SEM image reveals the surface topography of the clay sample. The microstructure is characterized by individual particles distributed across the surface. Voids or pores, visible as dark regions, are present between particles of varying sizes and exhibit no preferential orientation. This random distribution is typical of natural, unconsolidated clay materials and is further emphasized by the presence of finer grains, which highlight the material’s inherent porosity. Aggregates of various sizes are commonly observed, which is characteristic of natural clay systems. The surface texture ranges from rough to lamellar, indicative of clay minerals such as kaolinite, montmorillonite, or illite. At a magnification of 3000×, fine morphological features, including the shape and size of individual particles (typically around one micrometer or smaller), become distinguishable.
Particle edges may appear angular or rounded, depending on the clay’s origin and any mechanical or chemical treatments it has undergone. Brighter regions in the image correspond to areas with stronger secondary electron emission, such as edges or surface protrusions. Additionally, the presence of micro-cracks or fractures within particles is evident, likely resulting from dehydration processes or mechanical stress during sample preparation or environmental exposure.
As illustrated in Figure 6, the SEM micrograph of luffa after NaOH treatment reveals a rough and irregular surface with exposed fibrous structures (Ghali et al., 2009).
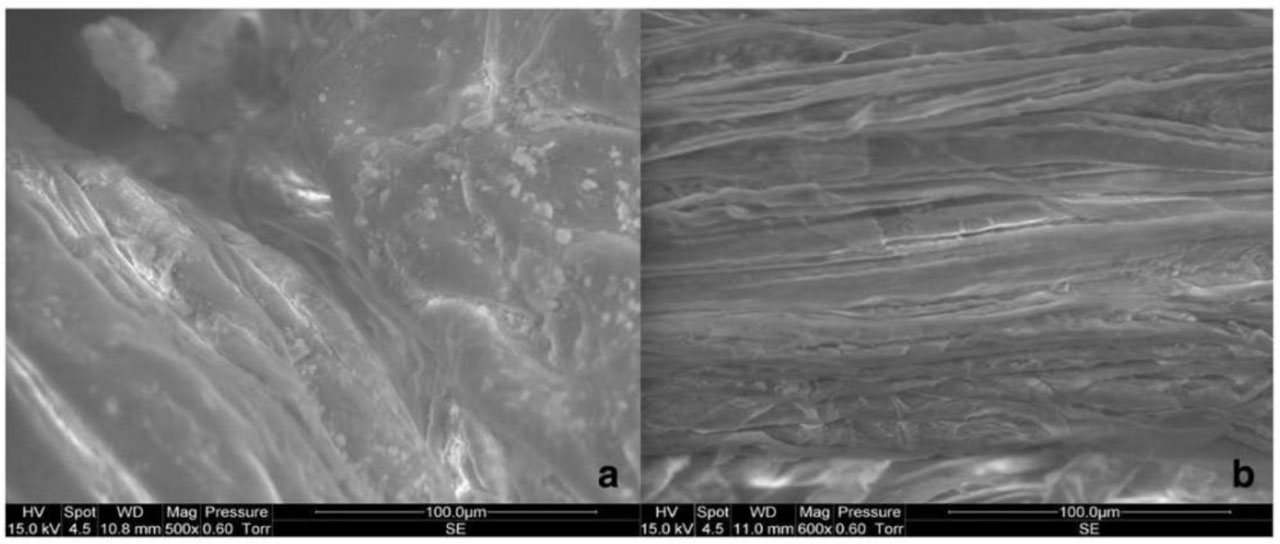
Figure 6:
SEM micrographs of a) untreated luffa fibers; b) treated luffa fibers
The morphology reveals partial disorganization due to the removal of substances such as lignin and hemicelluloses, resulting in a more porous texture. The visible pores indicate increased porosity, which may enhance the material’s adsorption capacity and its interaction with other substances.
2.2.5. X-ray Diffraction (XRD) Analysis of Untreated Soil and Luffa Fiber
X-ray diffraction (XRD) is a non-destructive technique used to identify the crystalline structure of materials by analyzing the interaction of X-rays with atomic planes. In soil analysis, XRD is employed to determine the mineralogical composition, particularly of clay minerals and oxides, with high precision. This information is essential for evaluating soil properties in agricultural, environmental, and geotechnical contexts. In the present study, the untreated soil was analyzed using X-ray diffraction (XRD). The analysis of the clay fraction revealed the presence of several minerals, including quartz (SiO2), kaolinite (Al2Si2O5(OH)4), illite, and hematite (Fe2O3), as well as minor amounts of calcium- and magnesium-bearing phases. These results indicate the mineralogical heterogeneity of the clay sample, with quartz identified as the predominant phase. Figure 7 shows the XRD pattern of luffa fibers. The diffraction peaks observed at 2θ = 14.3°, 22.5°, and 34.5° correspond to the (110), (002), and (040) crystalline planes, respectively, indicating the presence of cellulose polymorph I as the dominant crystalline structure.
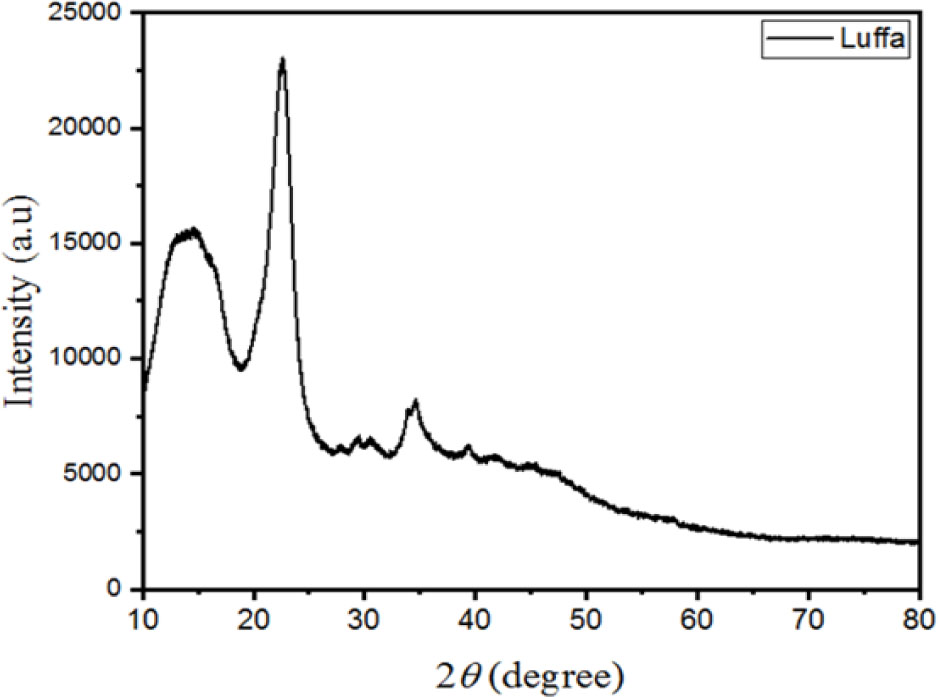
Figure 7:
XRD of luffa fiber
2.3. Research Methodology
To investigate the effect of soil reinforcement using luffa fibers, untreated expansive clay soil was mixed with varying amounts of luffa fibers. The reinforced samples were then subjected to laboratory tests, including Atterberg limits, Methylene Blue Value, Standard Proctor Test, pH measurement, free swell, and swelling pressure.
Based on the results, a 1% luffa fiber content provided the most balanced performance in terms of physical and mechanical properties. Consequently, further analyses, such as X-ray Fluorescence (XRF) and X-ray Diffraction (XRD), were conducted to evaluate the chemical and mineralogical composition. These tests aimed to detect any potential chemical interactions or mineralogical changes resulting from the incorporation of luffa fibers into the natural soil matrix.
2.4. Data Collection
Data for this study were obtained through a systematic series of laboratory experiments conducted on expansive clay soil samples. Initial characterization was carried out on the untreated soil, followed by treatment with varying proportions of natural luffa fibers. Standard sampling and preparation procedures were followed to ensure the homogeneity and representativeness of the specimens.
The laboratory tests included Atterberg limits, Methylene Blue Value, Standard Proctor Test, pH measurement, free swell test, and shear strength test, as well as advanced material characterization techniques such as X-ray Diffraction (XRD), X-ray Fluorescence (XRF), and Scanning Electron Microscopy (SEM).
All testing procedures were conducted under controlled laboratory conditions using standardized equipment. The resulting data provided quantitative insights into the changes in the physical, chemical, and mechanical behavior of the reinforced soil compared to the untreated control.
2.5. Geotechnical and Physicochemical Testing Procedures
2.5.1. Atterberg Limits Test
The Atterberg limits of both untreated and treated soils, incorporating various percentages of luffa fiber, were determined following the EN ISO 17892-12 (Association Française de Normalisation, 2022) standard, which specifies procedures for measuring the liquid limit, plastic limit, and plasticity index. The liquid limit was measured using the Casagrande apparatus after the sample was sieved through a No. 40 sieve (0.400 mm).
2.5.2. Free Swell and Swelling Pressure Tests
The primary objective of these tests was to determine the free swell and swelling pressure of both untreated and fiber-treated soils. Free swell tests were conducted following the XP P94-091 (Association Française de Normalisation, 1995), using a standard one-dimensional oedometer apparatus. For each test, soil samples, both untreated and treated, were mixed with water at their respective optimum moisture content (OMC) and thoroughly blended until a homogeneous mixture was obtained.
The oedometer ring used had a diameter of 50 mm and an initial height of 19 mm. Specimens were placed between two dry porous stones inside the oedometer cell and subjected to a seating pressure of 6.9 kPa. A dial gauge was mounted on the top cap to measure vertical displacement during the test.
The extensometer was calibrated, and the specimen was inundated from both the top and bottom to allow vertical swelling to occur. Deformation readings were recorded at time intervals of 0.1, 0.2, 0.5, 1.0, 2.0, 4.0, 8.0, 15.0, and 30.0 minutes, as well as at 1, 2, 4, 6, 24, 48, and 72 hours, until deformation stabilized following both the primary and secondary swelling phases.
The oedometric (oedometer) tests were performed at the optimum moisture content (OMC) determined for each fiber-reinforced mixture using the Standard Proctor compaction method.
The percentage of free swell was then calculated based on the specimen’s initial height. Swelling pressure tests followed a similar procedure; once primary swelling was complete, vertical pressure was incrementally applied to the top of the specimen until the initial void ratio was restored, that is, until no further vertical displacement was recorded by the extensometer.
2.5.3. Methylene Blue Test
The methylene blue test conducted in this study followed the French standard NF EN 17542-3 (Association Française de Normalisation, 2022). The test solution was prepared by dissolving 10 ± 0.1 g of methylene blue powder in one liter of distilled water, with continuous stirring at room temperature for one hour.
Methylene blue is a cationic dye with the chemical formula C16H18N3SCl. When dissolved in water and mixed with a soil suspension, the chloride ions in the methylene blue solution are exchanged with cations present in clay minerals, allowing the dye to be adsorbed onto their surfaces. The amount of methylene blue adsorbed depends on the type and quantity of clay minerals, the cation exchange capacity (CEC), and the specific surface area of the soil. For each luffa fiber content, the methylene blue adsorption value was determined accordingly.
2.5.4. Standard Proctor Test
The primary objective of soil compaction is to produce a material that meets three fundamental requirements: reducing settlement under load, decreasing permeability to limit water-induced stresses, and improving shear strength and bearing capacity.
The optimum moisture content (OMC) and maximum dry unit weight (γdmax) are determined from the compaction curve. Standard Proctor tests were conducted following the NF P94-093-10 (Association Française de Normalisation, 2014) to evaluate these parameters for both untreated soil and soil treated with 0.5%, 1%, 1.5%, and 2% luffa fiber.
2.5.5. pH Test Procedure
The pH values of both untreated and luffa fiber–reinforced soils were determined in accordance with the NF ISO 10390 (Association Française de Normalisation, 2022), which specifies procedures for determining soil pH in either water or a KCl solution.
In this study, soil samples were first air-dried and then sieved through a 2 mm mesh. A soil-to-water ratio of 1:2.5 was used; the mixture was stirred and allowed to equilibrate before the pH was measured using a calibrated pH meter. This test provides insight into the chemical reactivity of the soil and potential changes in its environment following fiber reinforcement.
3. Results and Discussion
3.1. Effect of Luffa Fiber on Atterberg Limits
After curing the soil-luffa fiber mixtures at room temperature for 24 hours, Atterberg limits tests were conducted. Table 5 presents the results for the liquid limit (LL), plastic limit (PL), and plasticity index (PI) of both untreated soil and soil treated with varying percentages of luffa fiber.
The addition of luffa fibers affects the consistency limits of the soil, as reflected in the changes in LL, PL, and PI. The LL slightly decreases with the initial addition of luffa fibers, dropping from 63.34% (untreated) to 62.6% at 1% fiber content. However, further increases to 1.5% and 2% fiber content result in a slight rise in LL to 62.86% and 63.15%, respectively. This trend suggests that a small amount of fiber reduces the soil’s water sensitivity, while higher fiber contents may increase water retention due to the porous structure of the fibers.
Table 5:
Atterberg limits of untreated soil and soil treated with different percentages of luffa fiber
| Luffa fibers [%] | Liquid Limit, LL [%] | Plastic Limit, PL [%] | Plasticity Index, PI [%] |
|---|---|---|---|
| 0 | 63.342 | 27.74 | 35.602 |
| 0.5 | 62.860 | 30.580 | 32.28 |
| 1 | 62.600 | 32.825 | 29.775 |
| 1.5 | 62.861 | 32.47 | 30.391 |
| 2 | 63.149 | 31.8 | 31.349 |
The plastic limit (PL) increases consistently with the addition of luffa fibers, rising from 27.74% (untreated) to a maximum of 32.83% at 1% fiber content, then fluctuating slightly around that level. This trend suggests that luffa fibers enhance the soil’s workability by increasing its resistance to plastic deformation, likely due to physical reinforcement and improved particle interaction.
The plasticity index (PI) decreases from 35.60 (untreated) to a minimum of 29.78 at 1% fiber content, indicating reduced soil plasticity and a more stable structure. However, the PI increases slightly beyond 1%, suggesting that higher fiber contents may begin to counteract the benefits by increasing water absorption or disrupting the soil matrix. Figure 8 illustrates the results summarized in Table 5.
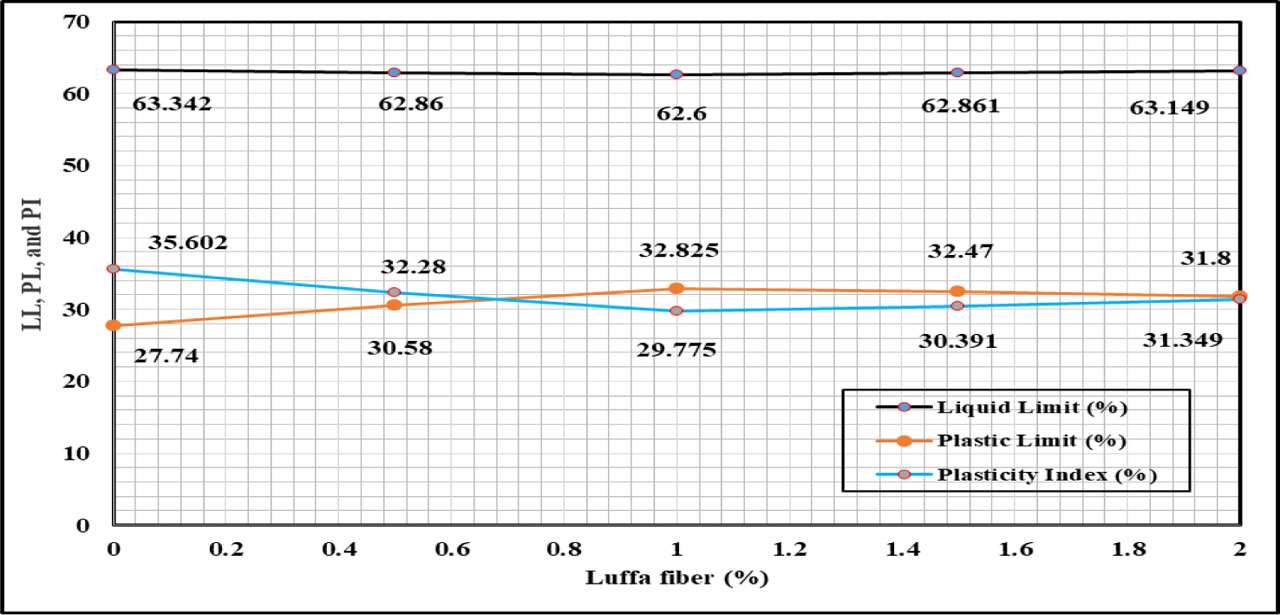
Figure 8:
LL, PL, and PI versus percentage of lime and luffa fiber
In conclusion, the addition of 1% luffa fiber results in the greatest reduction in the plasticity index (PI) and the highest increase in the plastic limit (PL). These effects can be attributed to flocculation and agglomeration processes, which modify the texture and structure of the expansive soil.
3.2. Effect of Luffa Fiber on Free Swell and Swelling Pressure
The swelling behavior of expansive soils is characterized by two key parameters: free swell and swelling pressure. Swelling pressure refers to the external pressure required to prevent volume increase in a swelling soil, while free swell represents the vertical expansion (heave) that occurs under specific moisture and loading conditions.
Determining the swelling potential is essential, particularly for foundation design on expansive soils. One of the objectives of this study is to stabilize the expansive clay from Hammam N'Bail using luffa fiber, in order to improve its shrink–swell characteristics. The effects of different luffa fiber contents on free swell and swelling pressure are illustrated in Figure 9.
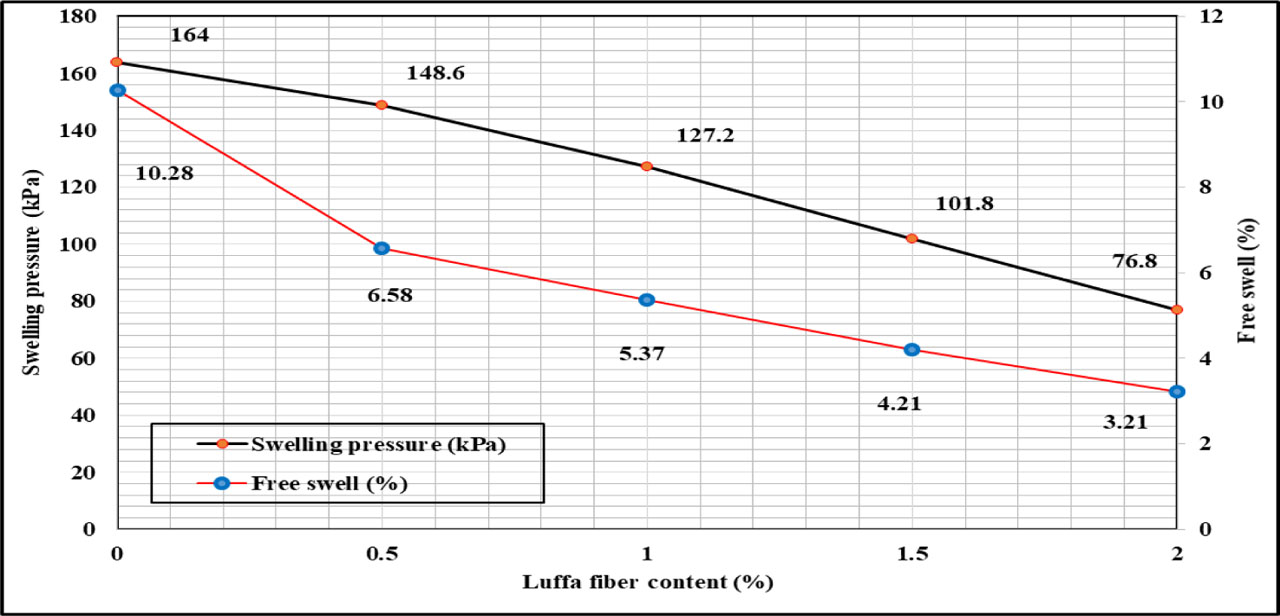
Figure 9:
Variation of free swell and swelling pressure vs. luffa fiber content
It is worth noting that the addition of 1% luffa fiber reduced the free swell percentage from 10.28% to 5.37%. Luffa fiber contents of 1.5% and 2% further decreased the free swell to 4.74% and 3.21%, respectively.
As shown in Figure 9, the incorporation of 1% luffa fiber reduced the swelling pressure from 164 kN/m2 (untreated) to 127.2 kN/m2. Fiber contents of 1.5% and 2% resulted in swelling pressures of 101.8 kN/m2 and 76.8 kN/m2, respectively. This progressive reduction in both free swell and swelling pressure with increasing fiber content can be attributed to a decrease in the maximum dry unit weight, which in turn reduces the repulsive forces between expansive soil particles.
3.3. Effect of Luffa Fiber Content on pH Values
The pH analysis following the addition of luffa fibers shows a slight and gradual acidification of the soil, with values decreasing from 7.5 to 6.04, yet remaining within acceptable limits. This moderate pH reduction does not indicate aggressive acidification, suggesting that luffa does not chemically alter the soil in a harmful way, unlike agents such as cement or lime, which significantly increase pH. The results are presented in Figure 10. According to the FD P18-011 (Association Française de Normalisation, 2022), soils with a pH between 5.5 and 6.5 are classified as slightly aggressive.
This classification applies to soils reinforced with 1.5% and 2% luffa fiber, whereas those with 0.5% and 1% remain neutral and non-aggressive. Therefore, it can be concluded that luffa fiber treatment is environmentally friendly, maintaining the soil's chemical balance while enhancing its mechanical properties. This stability supports the ecological nature of the treatment, with no significant alteration of the soil’s chemical structure.
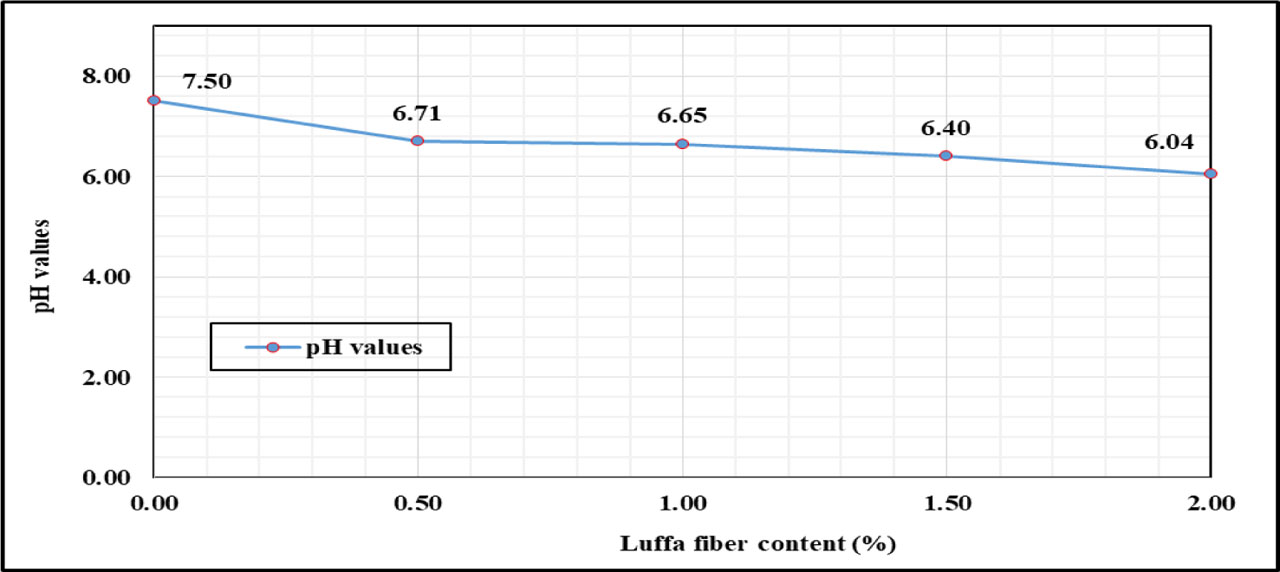
Figure 10:
pH variation versus luffa fiber content
3.4. Effect of Luffa Fiber on Methylene Blue Value
The results of the methylene blue value (MBV) tests conducted on both treated and untreated soils are presented in Figure 11.
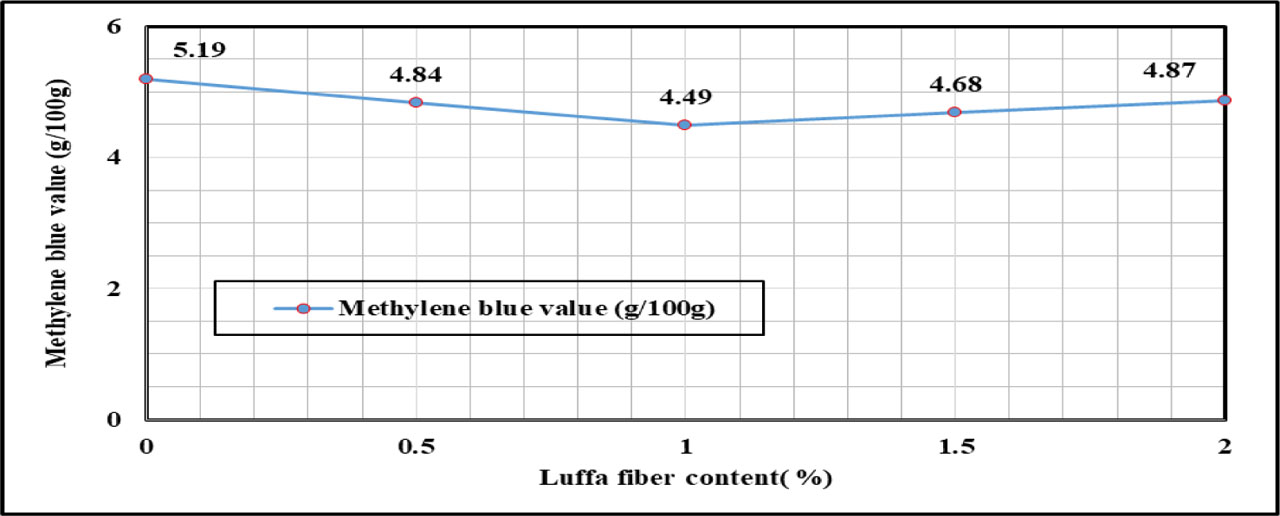
Figure 11:
Variation of the methylene blue value (MBV) of treated and untreated soil as a function of luffa fiber content
As illustrated in Figure 11, a linear decrease in the methylene blue value (MBV) was observed with the addition of 1% luffa fiber, reaching a minimum value of 4.49. However, further increases in luffa fiber content to 1.5% and 2% resulted in a rise in MBV, reaching 4.68 and 4.87, respectively.
This behavior can be attributed to the formation of hydration products from pozzolanic reactions, which coat the surfaces of soil particles and act as binding agents. This coating initially reduces the available surface area for methylene blue adsorption, thereby lowering the MBV. However, at higher fiber contents (1.5% and 2%), the increased presence of organic matter may interfere with this effect, leading to a subsequent rise in MBV.
3.5. Effect of Luffa Fiber on Compaction Tests
The compaction test is crucial for assessing the impact of natural luffa fiber on the optimum moisture content (OMC) and the corresponding maximum dry unit weight (MDUW) of expansive soils. Standard Proctor tests were conducted to assess these compaction characteristics.
Table 6 summarizes the results, including the MDUW and OMC for the various soil and luffa fiber mixtures. The samples were compacted using the Standard Proctor method in three layers, with each layer receiving 25 blows from a standard hammer weighing 2.5 kg and falling from a height of 30 cm. A cylindrical mold with a diameter of 10.15 cm and a height of 11.65 cm was used. The Standard Proctor parameters were determined from the compaction curve, which relates dry unit weight to moisture content.
Table 6:
Results of compaction proctor test according to NF P94-093
| Luffa fibers [%] | γdmax [kN/m3] | OMC [%] |
|---|---|---|
| 0 | 16.33 | 19.21 |
| 0.5 | 16.18 | 20.306 |
| 1 | 15.778 | 21.13 |
| 1.5 | 15.37 | 21.88 |
| 2 | 15.09 | 22.46 |
The observed decrease in maximum dry unit weight (γdmax) with increasing luffa fiber content can be attributed to the intrinsic properties of the fibers. Luffa fibers are lightweight and possess a low specific gravity, as well as a porous and irregular structure. When incorporated into the soil matrix, they partially replace heavier soil particles, leading to a reduction in overall dry unit weight.
Additionally, the fibrous structure tends to create interparticle voids, which increases the required moisture content for compaction and reduces particle packing efficiency. This behavior has been reported in similar studies using natural fibers such as coir, jute, and straw.
Regarding the potential shrinkage problems in real construction, it is true that excessive fiber content could cause drying shrinkage due to the high water absorption and low cohesion of fiber-rich zones. However, our results suggest that optimal performance occurs at fiber contents of 1.0% to 1.5%, where the reduction in dry density remains moderate and the mechanical improvements (e.g., cohesion, internal friction) are maximized.
As shown in Figure 12, increasing the luffa fiber content leads to an increase in the optimum moisture content (OMC) and a decrease in the maximum dry unit weight (MDUW). At 1% fiber content, the OMC increased from 19.21% to 21.13%, while the MDUW decreased from 16.33 kN/m3 to 15.78 kN/m3 compared to the untreated expansive soil.
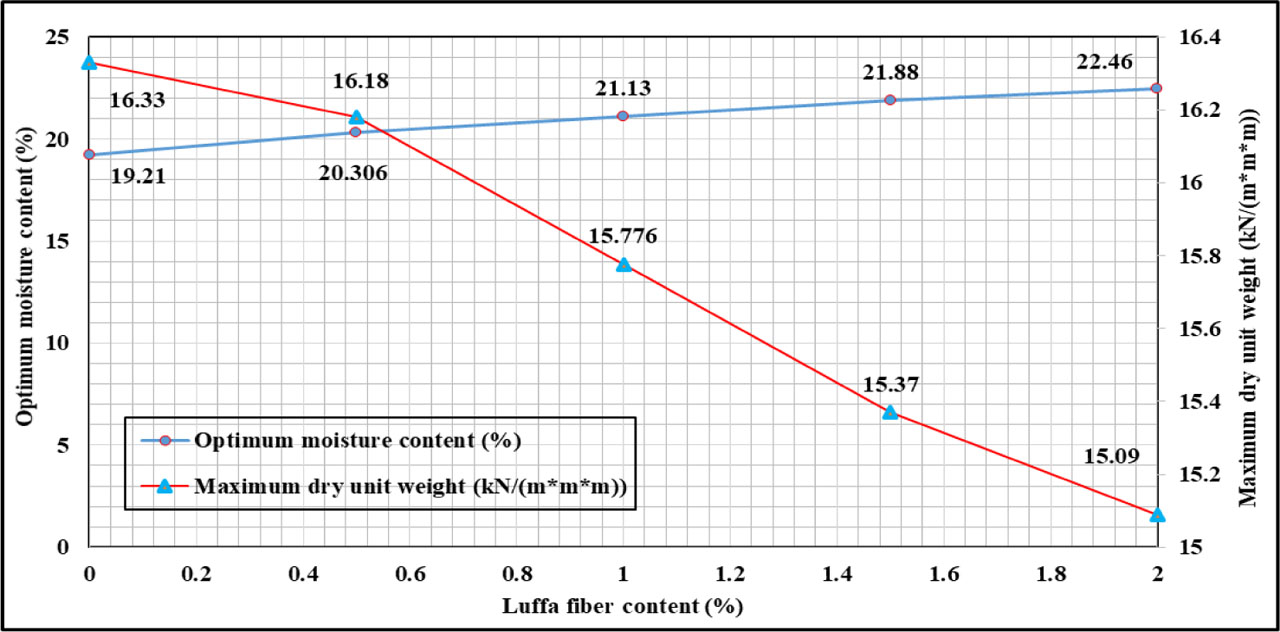
Figure 12:
Variation of optimum moisture content (%) and maximum dry unit weight (kN/m3) with increasing Luffa fiber content
These results indicate that luffa fiber promotes particle aggregation, leading to the formation of larger voids and altering the effective grading of the expansive soil. Additionally, pozzolanic reactions between the clay minerals and the luffa fiber contribute to the increase in optimum moisture content.
3.6. Effect of Luffa Fiber on Shear Strength Parameters
Cohesion and internal friction angle are fundamental mechanical properties that govern the shear strength and overall stability of soils. Together, they form the basis of the Mohr–Coulomb failure criterion, which is widely used to evaluate soil shear strength under varying stress conditions. The shear strength of the stabilized soil samples was determined according to the NF EN ISO 17892-10 (Association Française de Normalisation, 2018) standard, using a Wykeham Farrance direct shear apparatus. All tests were performed under consolidated drained (CD) conditions to ensure accurate measurement of shear parameters.
The direct shear tests were performed using a shear box with dimensions of 60 mm × 60 mm, depth of 20 mm, and a constant shear strain rate of 0.024 mm/min was applied. A slow shear rate, like 0.024 mm/min, helps ensure pore pressures have time to dissipate, simulating drained conditions.
The direct shear tests conducted in this study were carried out following the NF EN ISO 17892-10 (Association Française de Normalisation, 2018) standard, which recommends selecting normal stresses based on the expected in-situ loading conditions.
The specimens were tested under applied vertical stresses of 100, 200, and 300 kPa. Soil samples were prepared at the optimum moisture content, as determined by the Standard Proctor compaction tests.
Lower normal stresses (e.g., 20 kPa) were not considered, as the focus was on typical subgrade conditions where higher confining pressures are expected. Low stress levels are generally more relevant for interface testing or shallow granular layers.
Figure 13 illustrates the variation of horizontal deformation with shear stress, showing how deformation changes with shear stress for both untreated soil and treated soil with 1% luffa fiber. Figure 14 presents the shear stress–normal stress relationship used to compute the shear strength parameters.
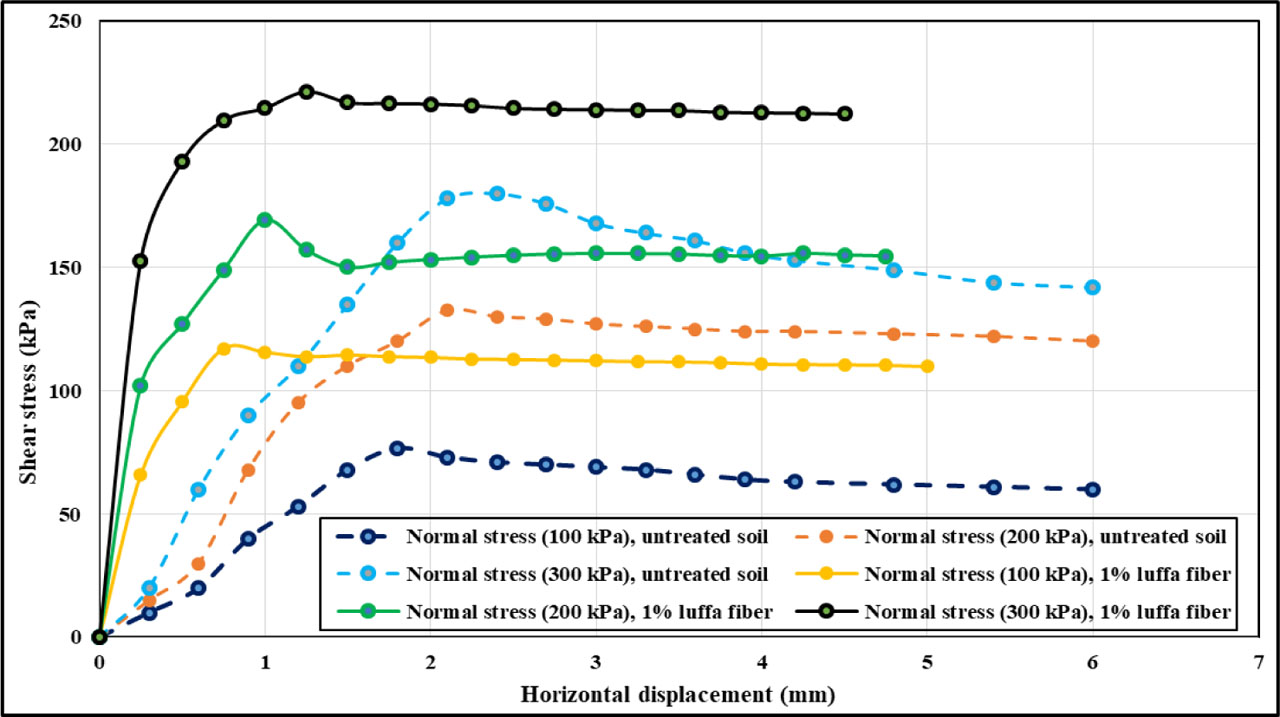
Figure 13:
Shear stress vs. horizontal displacement curves for untreated soil and 1% luffa fiber
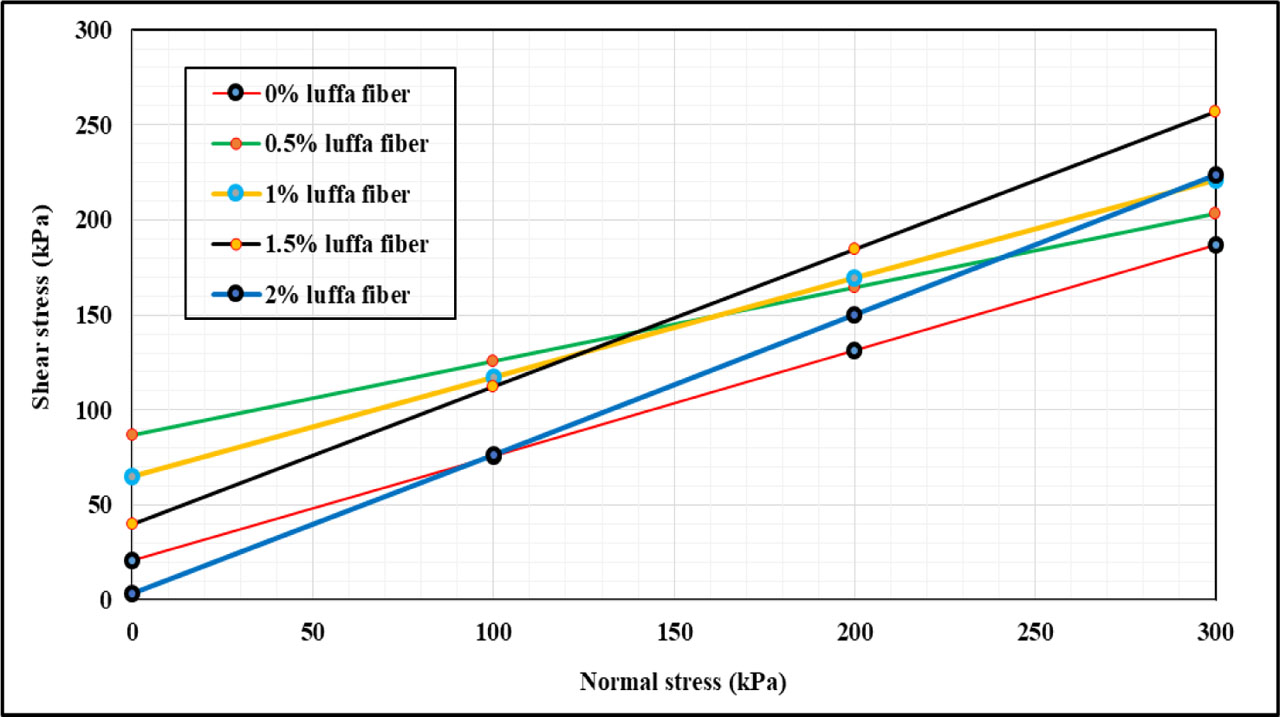
Figure 14:
Variation of shear stress with normal stress for various luffa fiber contents
The results of the direct shear tests were analyzed to determine the shear strength parameters, specifically, cohesion and the internal friction angle. The strength envelope obtained from direct shear testing was approximately linear for all fiber contents, and shear strength parameters were derived using linear regression based on the Mohr–Coulomb criterion. The shear tests were performed on samples prepared at the optimum moisture content (OMC), as determined by the Standard Proctor compaction tests for each mixture.
Direct shear tests were conducted on both untreated soil and soil treated with luffa fiber at four different contents: 0.5%, 1%, 1.5%, and 2%, under consolidated-drained (CD) conditions. The resulting cohesion and internal friction angle values for the untreated and treated soils are presented in Figure 15. As shown in Figure 15, the addition of luffa fibers significantly increased the soil's cohesion, with an initial rise of 318% at a 0.5% fiber content. This improvement is likely due to the reinforcing effect of the fibers, which enhances inter-particle bonding. The increase in cohesion observed in our luffa fiber-reinforced samples is consistent with results reported by Nguyen et al. (2024), where polyester fiber inclusion in CH soils significantly improved shear strength parameters. However, with fiber contents above 0.5%, cohesion gradually decreases, reaching a minimum value of 3.2 kN/m2 at 2% luffa, representing an 84.54% reduction from the initial peak value. This decline suggests that excessive fiber content may disrupt soil structure and weaken cohesive forces.
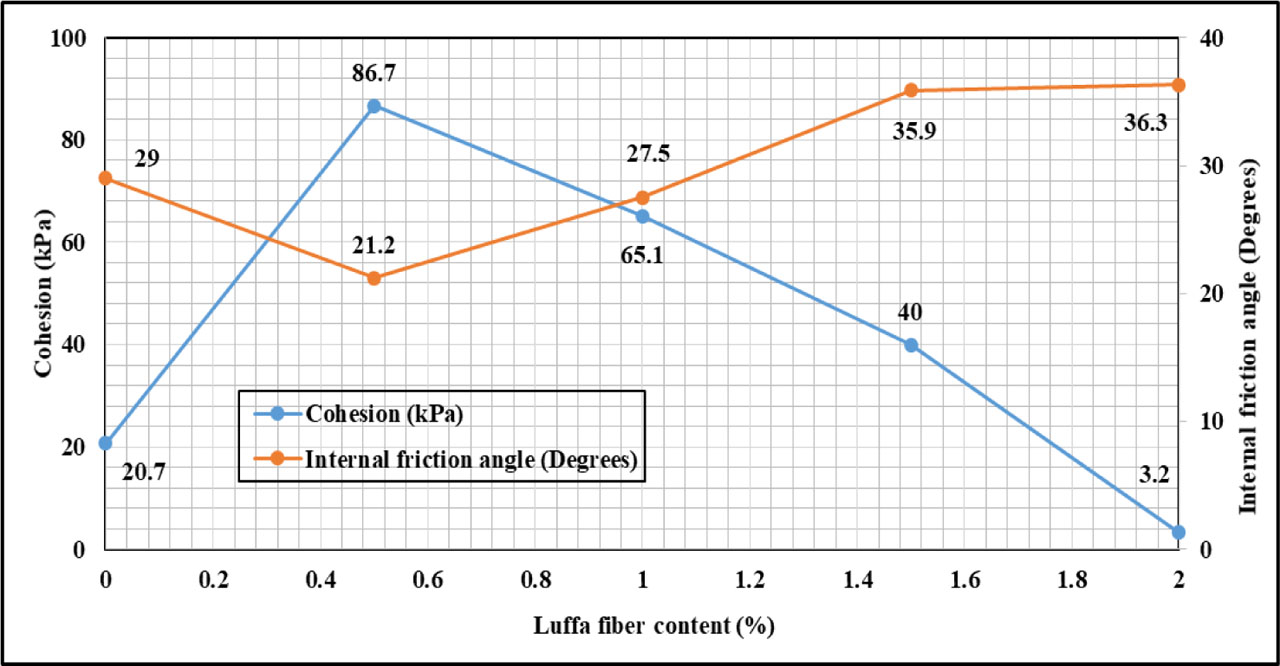
Figure 15:
Variation of cohesion and internal friction angle with luffa fiber content
The results indicated that the soil treated with 0.5% luffa fiber exhibited the lowest internal friction angle, at 21.2°. This behavior is likely due to local saturation effects or fiber-induced sliding mechanisms.
However, as the luffa fiber content increased, the internal friction angle also rose, reaching 27.5° at 1%, 35.9° at 1.5%, and 36.3° at 2%. This increase can be attributed to the presence of luffa fibers, which significantly modified the frictional properties of the soil’s shear surfaces. The fibers disrupted the continuity of the shear plane, preventing it from remaining parallel to the shear direction and enhancing interlocking between soil particles and fibers.
This suggests that at higher dosages, luffa fibers act as internal mechanical reinforcements, thereby increasing frictional shear strength. A similar mechanism may also contribute to the observed variations in cohesion.
3.7. Material Characterization Using XRF, XRD, and SEM
Based on the results of the previous tests, it can be concluded that optimal performance was achieved at a luffa fiber content between 1.0% and 1.5%, offering the best balance of improved shear strength, increased internal friction angle, reduced plasticity index, and minimized swelling potential. Consequently, material characterization using X-ray fluorescence (XRF), X-ray diffraction (XRD), and scanning electron microscopy (SEM) was performed on the soil treated with 1% luffa fiber.
3.7.1. Chemical Composition Determined by X-ray Fluorescence (XRF)
The chemical composition of the untreated expansive soil (clay) and the soil treated with 1% luffa fiber was determined after 1, 7, and 28 days of air-drying. For the treated samples, the composition was evaluated as a function of curing time following reinforcement with luffa fiber. The results are presented in Table 7.
Table 7:
Chemical composition of untreated soil and soil treated with 1% luffa fiber after 1, 7, and 28 days of air-drying curing
| Type of soil | Curing duration | SiO2 | Al2O3 | Fe2O3 | CaO | MgO | SO3 | K2O | Na2O | Cl |
|---|---|---|---|---|---|---|---|---|---|---|
| Untreated soil | 1 day | 45.4 | 15.8 | 4.74 | 17.198 | 2.3 | 0.664 | 2.035 | 0.3 | 0.021 |
| Treated soil with 1% luffa | 1 day | 45.5 | 16.1 | 4.756 | 17.147 | 2.346 | 0.576 | 2.039 | 0.3 | 0.018 |
| Treated soil with 1% luffa | 7 days | 44.3 | 15.1 | 4.749 | 17.14 | 2.207 | 0.672 | 2.005 | 0.3 | 0.022 |
| Treated soil with 1% luffa | 28 days | 44.2 | 15.3 | 4.69 | 17.125 | 2.243 | 0.673 | 2.024 | 0.3 | 0.025 |
Silica content shows a slight variation, indicating limited pozzolanic reactivity. A similar trend is observed for alumina, where minor fluctuations may reflect initial interactions between luffa fibers and clay minerals, followed by stabilization. Iron oxide remains stable across all samples (4.69%–4.76%), suggesting it is unaffected by fiber treatment or curing and remains chemically inert. Calcium oxide content gradually decreases, reaching 17.15% at 28 days, possibly due to minor chemical interactions such as carbonation or bonding with reactive clay constituents.
Magnesium oxide remains relatively constant (2.2%–2.3%), confirming its chemical stability. Sulfate levels vary slightly (0.576%–0.673%) without a clear trend, likely due to transient ion exchange or measurement variability. Potassium and sodium oxide contents also remain stable, indicating no significant influence from luffa fiber treatment or curing.
Chloride content remains consistently low (0.018%–0.025%), well below the 0.03% threshold considered acceptable, indicating minimal risk of chloride-induced reactions or corrosion. This supports the long-term chemical stability of the treated soil.
In conclusion, X-ray fluorescence (XRF) analyses of clay treated with 1% luffa fiber at 1, 7, and 28 days confirm notable chemical stability. The consistency in major oxide contents (SiO2, CaO, and Fe2O3) suggests no significant chemical reactivity between the fiber and the soil. These findings imply that the interactions are primarily physical, likely involving adsorption or dispersion of luffa particles, rather than chemical reactions.
The low and stable chloride (Cl−) levels further confirm the absence of soluble salt accumulation. Additionally, no heavy metals (e.g., Pb, Cr, and Cd) were detected, indicating that the treatment does not introduce toxicity.
Overall, these results demonstrate that incorporating luffa fibers into expansive soil does not cause chemical contamination or harmful mineralogical changes, reinforcing their environmentally friendly nature.
3.7.2. X-ray Diffraction (XRD)
The XRD analysis of the matrix revealed intense diffraction peaks at 2θ = 26.6° and 29.6°, corresponding to quartz (SiO2) and other mineral phases containing Fe, S, and K, respectively. Additional smaller peaks indicate the presence of various minerals characteristic of the matrix’s heterogeneous surface, including dolomite (CaMg(CO3)2), calcite (CaCO3), albite (NaAlSi3O8), and kaolinite/illite (Al2Si2O5(OH)4).
The XRD analysis indicates that the mineralogical assemblage of the expansive soil remains unchanged after the incorporation of 1% luffa fibers. Quartz (SiO2) continues to be the dominant crystalline phase, accompanied by aluminosilicate clay minerals (illite/kaolinite), carbonate phases (calcite/dolomite), and minor iron oxides (hematite). No new crystalline phases were identified in the treated sample, confirming the absence of chemical or mineralogical reactivity between the soil and the luffa fibers.
Two main modifications can be observed in the treated soil pattern:
a slight reduction in the intensity of the major diffraction peaks, particularly those of quartz, suggesting partial masking of the crystalline signal by the organic matter of the fibers;
a modest increase and broadening of the diffuse background in the 15–30° 2θ range, characteristic of an amorphous contribution related to the luffa.
These results demonstrate that luffa fibers act primarily as a physical and mechanical reinforcement rather than as a reactive mineralogical modifier.
3.7.3. Scanning Electron Microscopy (SEM)
Figure 16 presents a scanning electron microscopy (SEM) micrograph of soil treated with 1% luffa fiber, illustrating the morphological changes induced by the fiber addition.
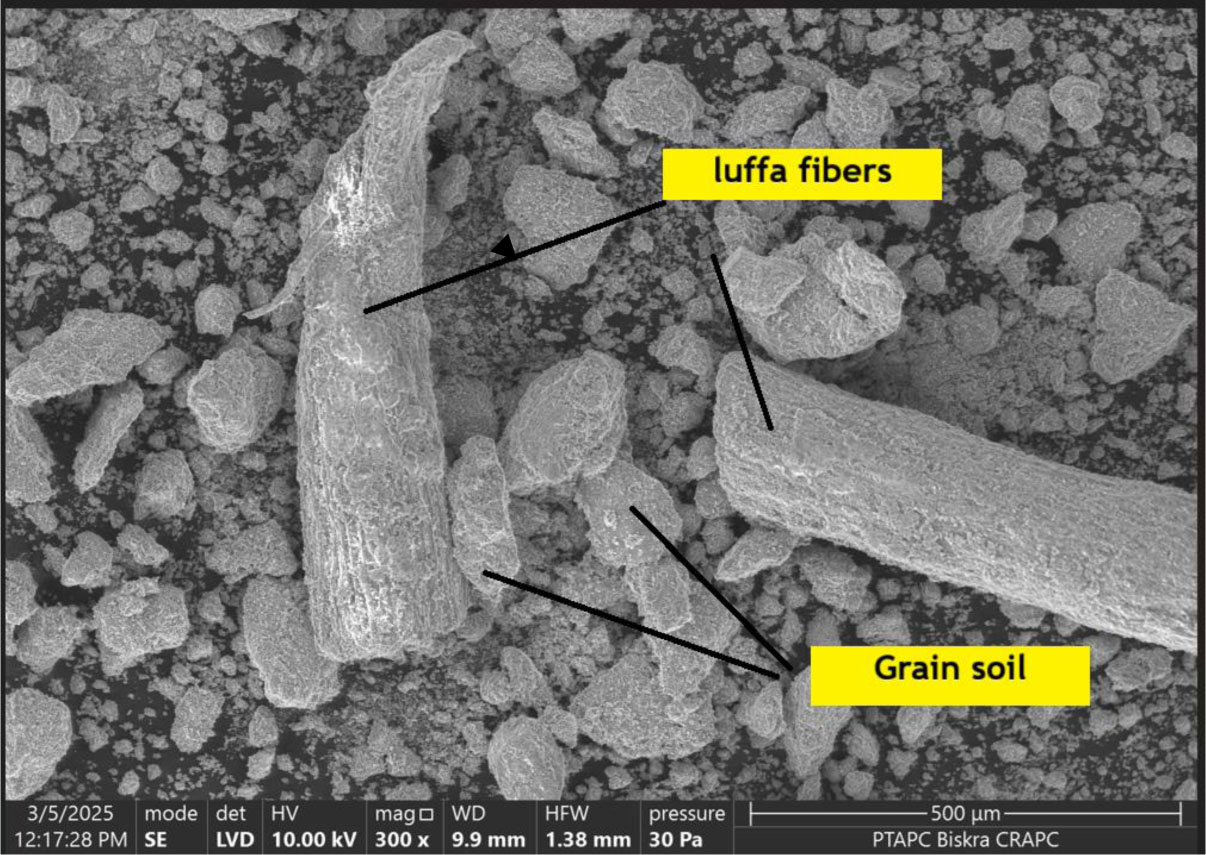
Figure 16:
Scanning Electron Microscopy (SEM) micrograph of soil treated with 1% luffa fiber
The scanning electron microscopy (SEM) micrograph (Figure 16) reveals that the addition of 1% luffa fibers alters the morphology and structure of the treated soil, primarily through physical interactions. The presence of elongated, rough fibers indicates that the luffa does not dissolve but instead interacts with clay particles, leading to a less compact microstructure. This observation is further supported by the results of the Standard Proctor compaction test.
4. Conclusion
This research investigated the use of natural luffa fibers as a stabilizing additive for expansive soils. The results demonstrate that luffa fiber is a promising, eco-friendly alternative for soil stabilization, primarily through physical rather than chemical interactions. XRF, XRD, and pH analyses confirmed the absence of significant chemical reactions between the luffa fibers and clay minerals, thereby preserving the natural composition and structure of the soil while enhancing its engineering properties.
Optimal performance was achieved at a fiber content between 1.0% and 1.5%, offering the best balance of improved shear strength, increased internal friction angle, reduced plasticity index, and minimized swelling.
Higher dosages (above 2%) led to a significant reduction in cohesion, making the soil more fragile. Therefore, precise dosage control is essential to avoid diminishing returns or adverse effects.
Morphological analysis (SEM) revealed that the fibers physically reinforce the soil matrix by increasing porosity, modifying structure, reducing compactness, and enhancing moisture retention.
Atterberg limit tests showed that the addition of luffa fibers reduced soil plasticity and improved mechanical behavior. Both swelling pressure and free swell decreased significantly with increasing fiber content. Although luffa is not a pozzolanic material, its fibrous structure contributes to a mechanical stabilization effect.
Quantitative results indicated that incorporating 1% luffa fibers resulted in:
A 16.4% reduction in plasticity,
A 47.8% decrease in swelling potential,
A 214.5% increase in cohesion.
The optimum moisture content increased by 16.9%, while the maximum dry density slightly decreased due to the lightweight and porous nature of the fibers.
It is important to note that the long-term durability of fiber-reinforced soils under environmental conditions such as biodegradation, moisture variations, and microbial activity remains an open question. While the present study provides promising laboratory-based results, further research is necessary to assess performance under real-world conditions, including field trials and long-term aging tests.
In conclusion, luffa fiber improves the behavior of expansive soils through mechanical reinforcement and moisture regulation, without chemically altering the soil. Its local availability, low cost, and non-aggressive interaction with clay make it a sustainable and environmentally friendly solution for geotechnical applications. This study opens up new avenues for utilizing natural fibers in soil stabilization, aligning with the principles of green engineering and sustainable development.
While the observed improvements in shear strength, plasticity, and swelling behavior suggest potential for practical use, particularly in light foundation works or subgrade improvement, these findings are currently based on controlled laboratory conditions. Therefore, field-scale testing is essential to confirm performance under variable environmental and loading conditions before widespread adoption.
Although luffa fiber shows significant promise in laboratory settings, scaling up for larger projects may present challenges, such as ensuring uniform fiber distribution, managing higher material volumes, and addressing variability in soil properties across construction sites. However, its low cost, local availability, and biodegradability make it an attractive candidate for sustainable geotechnical applications if supported by field validation.
5. Recommendations and Future Work
Further testing is crucial for transitioning from laboratory results to real-world applications. While this study focused on high-plasticity expansive clay, the performance of luffa fiber reinforcement may vary with different soil types, and further studies are recommended to evaluate its effectiveness in granular, silty, or low-plasticity soils. Further testing is crucial for transitioning from laboratory results to real-world applications.
Specifically, large-scale field trials are needed to validate the behavior of luffa-stabilized soils under practical construction conditions and diverse soil types. Long-term performance should also be assessed under environmental stresses such as cyclic wetting drying and freeze-thaw cycles, which are critical to infrastructure durability.
Additional testing should explore:
The combined effects of luffa fibers with other stabilizing agents (e.g., lime, fly ash) for potential performance enhancement,
Comparative studies with traditional and alternative fibers (e.g., coir, jute, polypropylene) to benchmark effectiveness, sustainability, and cost-efficiency.
Future research should focus on:
Long-term durability of luffa-stabilized soils under cyclic wetting–drying and freeze–thaw conditions,
Evaluating synergistic effects of combining luffa fibers with other natural or industrial byproducts (e.g., lime, fly ash),
Conducting field-scale studies to validate laboratory findings and assess implementation challenges across different soil types and climates,
Performing comparative analyses between luffa fibers and other conventional or natural stabilizers (e.g., lime, cement, coir, jute, synthetic fibers) to assess relative performance, cost-effectiveness, and environmental impact