

Figure 1:
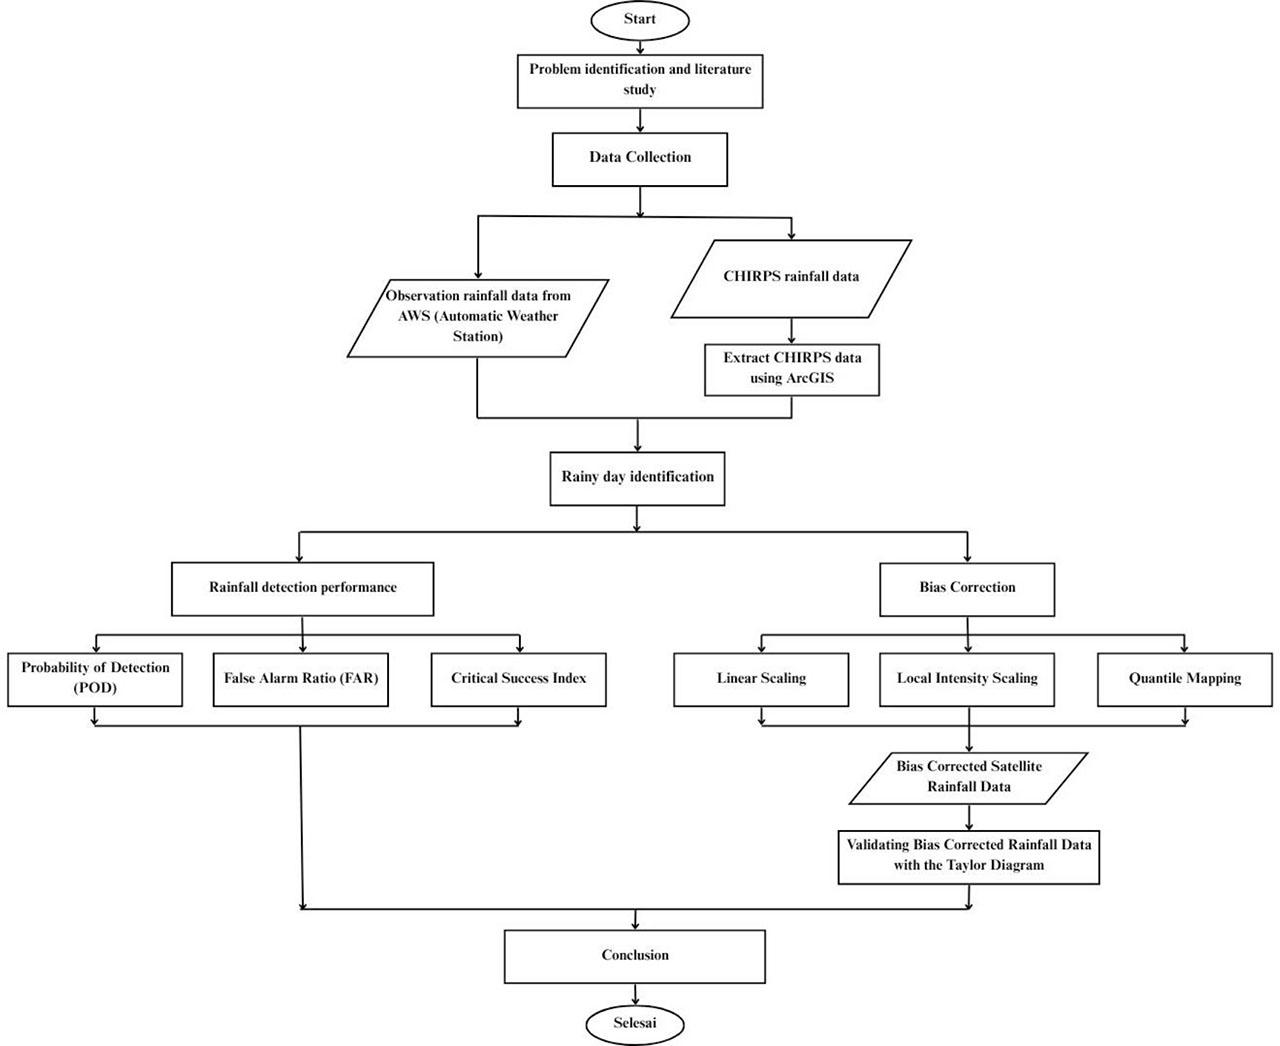
Figure 2:
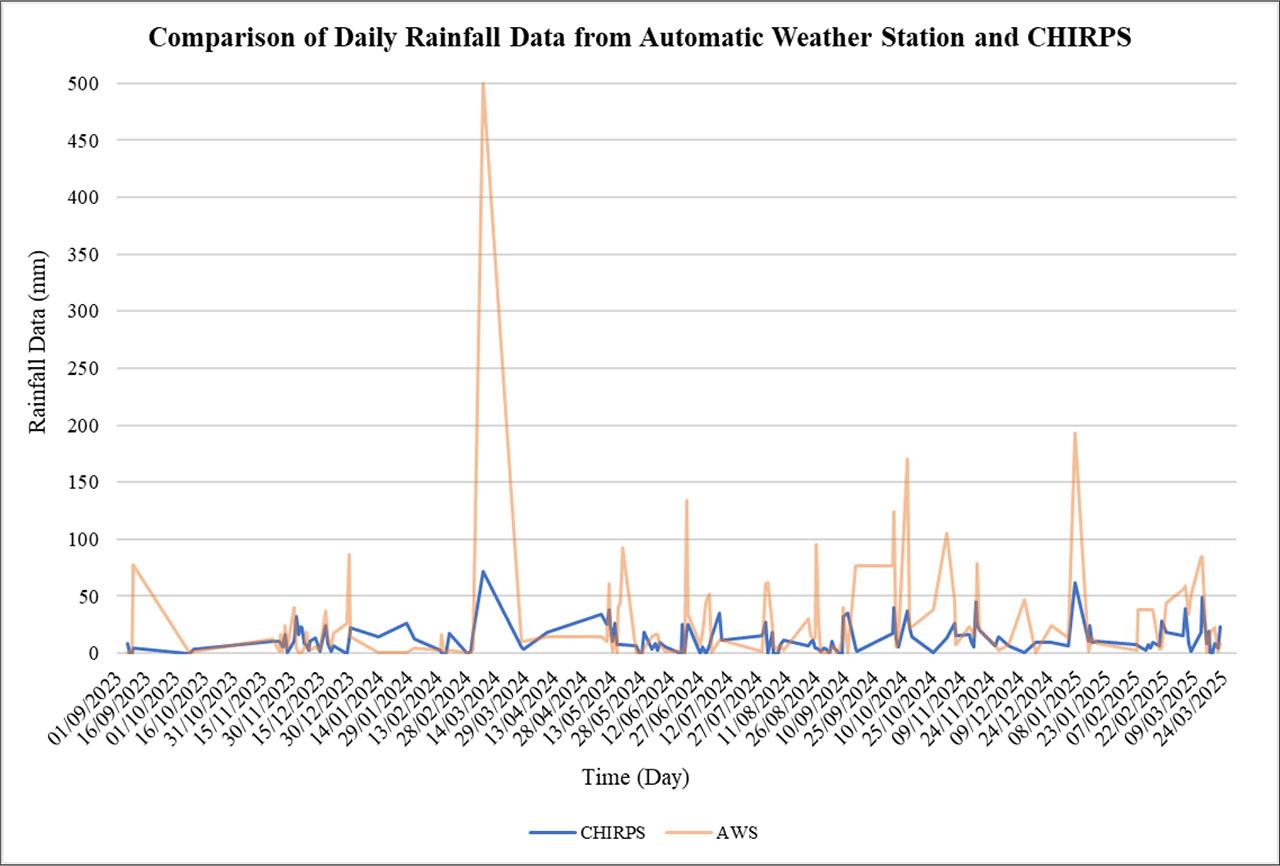
Figure 3:
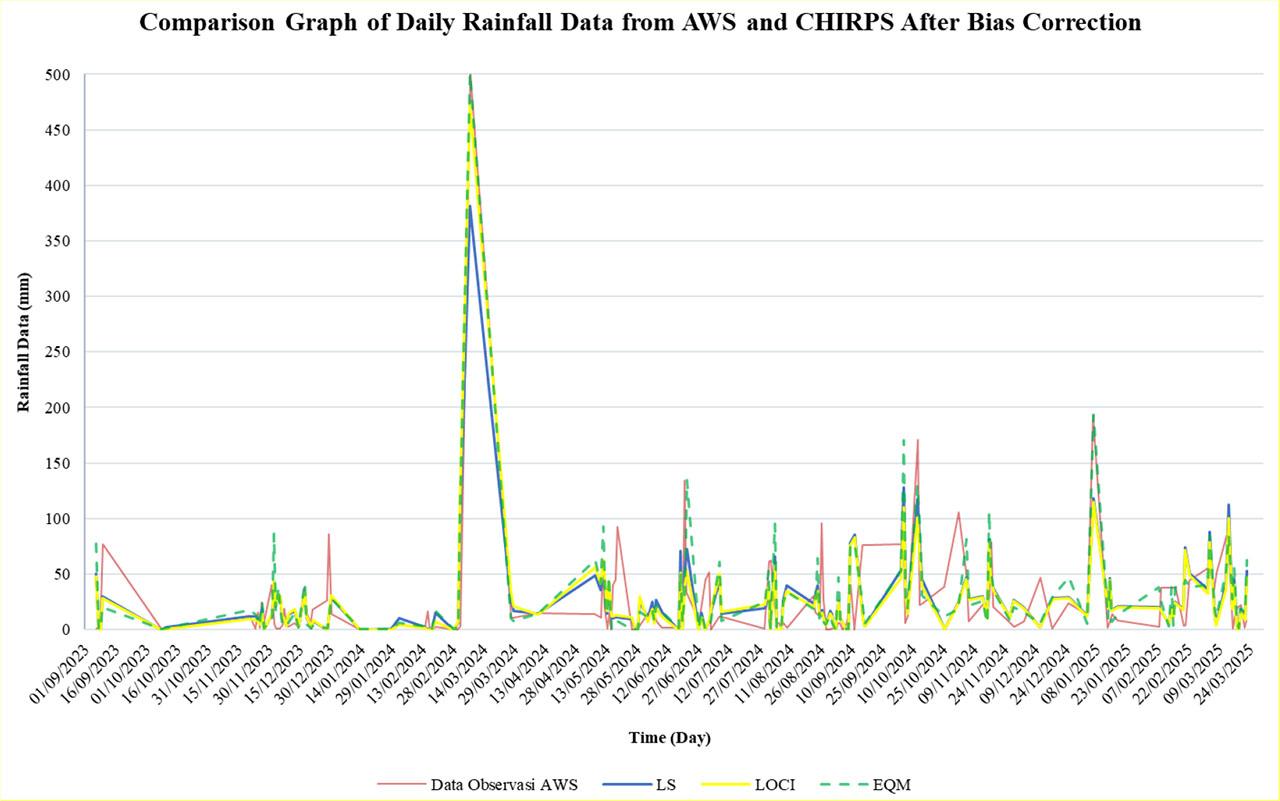
Figure 4:
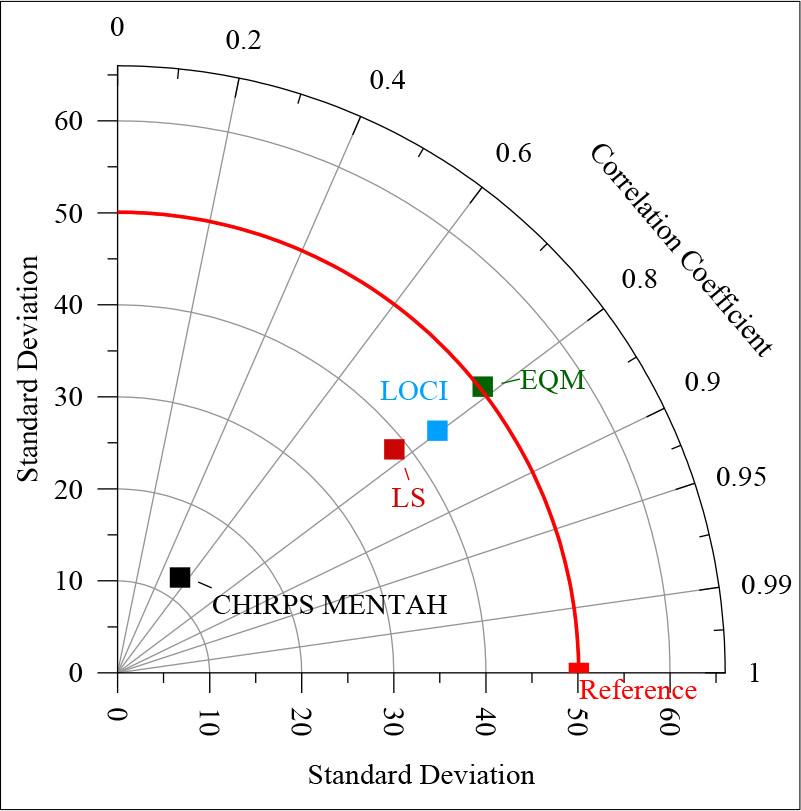
Results of validated CHIRPS rainfall data
| Products | Mean | Standard Deviation | Centred RMS Difference (cRMSD) | Correlation Coefficient |
|---|---|---|---|---|
| AWS | 26.34 | 50.09 | 0.00 | 1.00 |
| CHIRPS RAW DATA | 12.04 | 12.39 | 44.39 | 0.55 |
| LS | 26.34 | 38.64 | 31.41 | 0.78 |
| LOCI | 25.75 | 43.56 | 30.39 | 0.80 |
| EQM | 29.18 | 50.39 | 32.72 | 0.79 |
Satellite performance evaluation accuracy values
| Statistical Parameter | Formula | Value Range | Description |
|---|---|---|---|
| POD |
| ∼1 | The satellite detected most of the actual event. |
| FAR |
| ∼0 | Satellites minimize false alarms. |
| CSI |
| ∼1 | The satellite has good overall performance. |
Satellite performance evaluation
| Detection Classification | Many data |
|---|---|
| POD | 0.9 |
| FAR | 0.1 |
| CSI | 0.8 |