

Rainfall data is a crucial element in agriculture and hydrology. A comprehensive knowledge of rainfall data is important in decision-making regarding waterworks, water resources management, disaster mitigation, and development planning (Maria et al., 2022). Also, reliable rainfall and hydrological data availability are highly related to hydrological features such as basin topography, river networks, and water flow direction (Abd Elrahman & Ataalmanan, 2023). Because water resources are interdependent subsystems of the Earth, the hydrological cycle and precipitation trends are seasonal, periodic processes that affect a region's water supplies (Smrčková et al., 2024). Therefore, rainfall data must be collected and provided with high spatial and temporal resolution (Dlamini & Tfwala, 2024). In Indonesia, the availability of quality rainfall data is often constrained by uneven station coverage, manual data recording, and delays in processing and reporting, resulting in significant gaps in institutional datasets (Marta et al., 2023). These limitations are particularly problematic in regions with high rainfall, such as West Sumatra, which is influenced by seasonal land-sea wind interactions and exhibits two annual rainfall peaks (Febri et al., 2016). On this condition, accurate and timely rainfall data are essential for capturing spatial and temporal variability, which is crucial for practical hydrometeorological analysis and planning (Islamiyanto, 2019; Abdaa et al., 2021).
To overcome the challenges associated with limited spatial coverage and delayed acquisition of rainfall data, Automatic Weather Stations (AWS) are a reliable alternative that provides continuous, automated measurements of key meteorological variables, including temperature, humidity, wind, and precipitation (Hippargi & Patkar, 2022). Although AWS significantly reduces human error and enhances data availability, its performance may still be affected by electronic and algorithmic inaccuracies, and its spatial representativeness remains constrained due to high operational and maintenance costs (Wibawanty et al., 2022; Nsabagwa et al., 2019; WMO, 2017).
As a complementary solution, satellite-based rainfall products such as the Climate Hazards Group InfraRed Precipitation with Station data (CHIRPS) offer broad spatial and temporal coverage by integrating satellite imagery and ground-based data (Maria et al., 2022; Harsanto & Tsaury, 2021). In this study, CHIRPS was selected based on its relatively high spatial resolution of 0.05°, which is finer than other widely used satellite products such as GPM-IMERG, GSMaP, and TRMM, all of which typically provide data at a coarser resolution of 0.1°. Furthermore, CHIRPS offers a long-term and consistent rainfall record dating back to 1981, making it particularly advantageous for both historical climate assessments and contemporary hydrometeorological applications. Previous studies conducted in the same region have applied bias correction techniques to GPM-IMERG, GSMaP, and TRMM data, demonstrating their suitability for regional hydrological evaluation (Andari & Daoed, 2024; Andari et al., 2024). Building on this foundation, CHIRPS was chosen to leverage its superior spatial detail and integration of in-situ observations, offering improved potential for localized validation and hydrometeorological analysis in data-sparse regions.
Several studies have evaluated CHIRPS performance globally and in Indonesia. Dinku et al. (2018) Reported that CHIRPS outperformed ARC2 and TAMSAT3 in accuracy, though it exhibited substantial bias in daily rainfall. Similarly, Tikuye et al. (2024) Found CHIRPS effective in representing rainfall patterns and drought prediction in Ethiopia, while Shrestha et al. (2017) Noted reduced accuracy in mountainous regions. In Indonesia, Suryanto et al. (2023) observed good performance in West Kalimantan, though limited to light rainfall events (<20 mm), and Saidah et al. (2024) Low accuracy was found in North Lombok, indicating the need for calibration. Pratama et al. (2022) Despite linearity with AWS data in South Lampung, a significant bias in daily rainfall estimates was also reported.
Multiple factors, including geographic location, observation timescale, rainfall intensity, and topographical complexity, highly influence the accuracy of satellite-based rainfall datasets such as CHIRPS. Since satellite sensors primarily detect atmospheric properties, their outputs are inherently subject to systematic biases and random errors. These limitations highlight the importance of local validation, especially in regions with diverse climatic and physical landscapes, to ensure the reliability of satellite-derived precipitation data for climatological and hydrological purposes. Accurate representation of surface-level conditions is essential for data used in natural resource management and environmental planning, as it forms the basis for informed and effective decision-making. Consequently, validating satellite-based rainfall estimates against ground-based observations is crucial to ensure their precision and dependability. This study aims to validate CHIRPS satellite rainfall data against observational data obtained from an AWS WS-2902 station installed at the Faculty of Engineering, Andalas University, to evaluate its suitability for local-scale hydrometeorological analysis.
This research can be categorized as applied research that aims to apply, test, and evaluate the ability of a thing or theory in solving practical problems. This research aims to validate the accuracy of CHIRPS rainfall data in estimating daily rainfall. Validation will be conducted using observational rainfall data collected by AWS Ambient Weather WS-2902. The research steps include collecting daily rainfall data from AWS and CHIRPS in several periods, performing bias correction on the data, evaluating satellite data errors, and evaluating satellite product performance. The research flow chart can be seen in the following Figure 1.
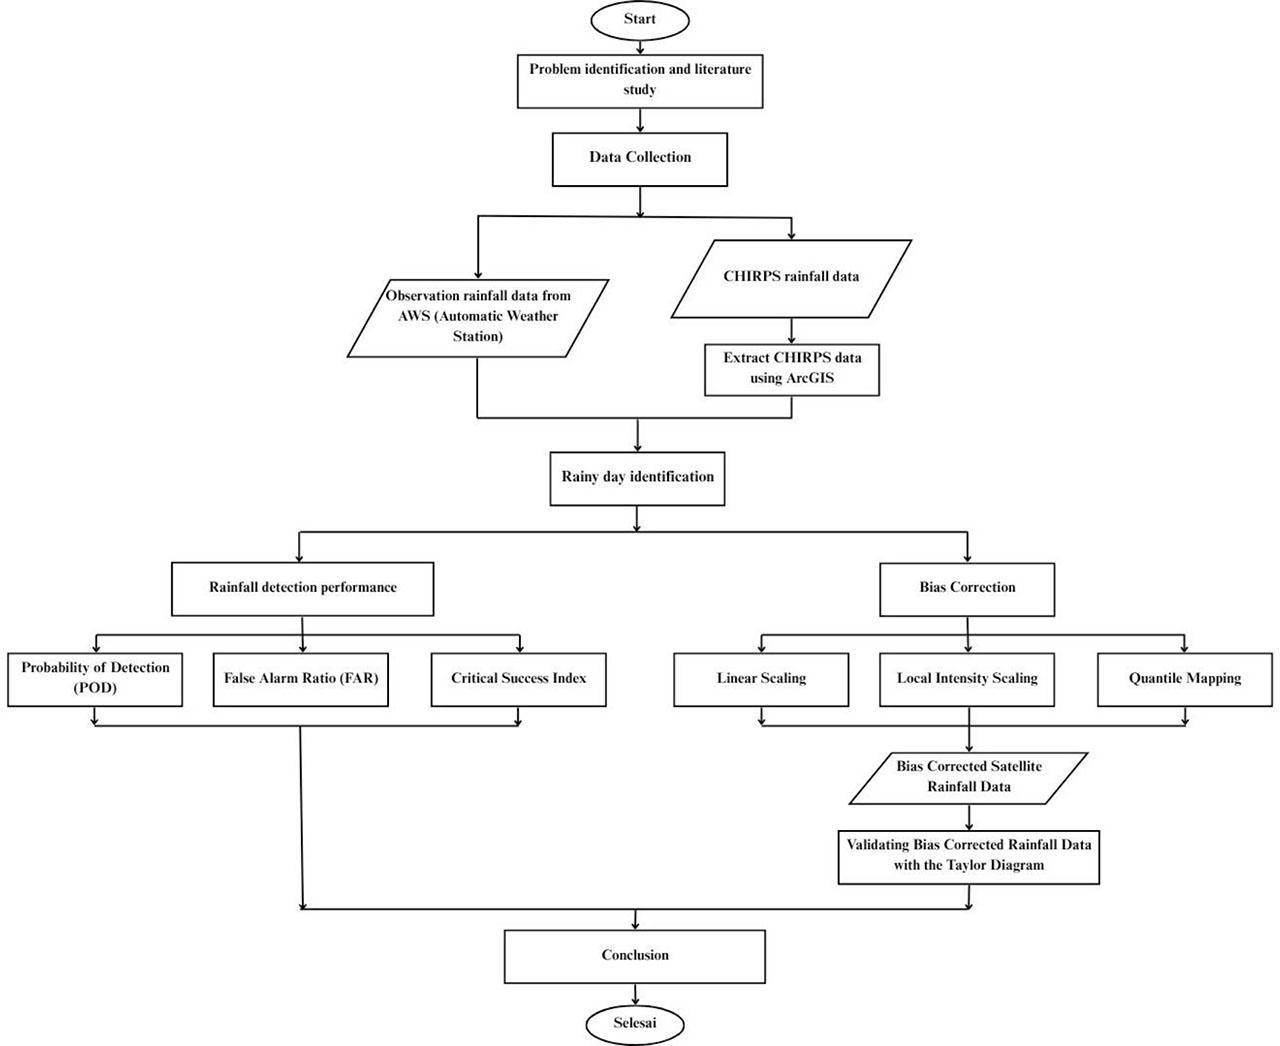
Research flow chart
Bias correction is adjusting modeled (satellite) rainfall data to match observed rainfall data better, considering the errors present. Bias in daily rainfall measurements not only affects monthly averages but also affects intensity, frequency, and other statistical characteristics at various periods used in hydrological studies. Therefore, bias correction methods are needed to correct the magnitude and frequency of rainfall distribution (Jaiswal et al., 2022).
Linear Scaling (LS) is a simple bias correction method that matches the average of the corrected values to the observed values using a monthly average factor. The equation for this method is written as follows:
Where:
Pcorr - Corrected rainfall data (mm),
Praw - Modeled (satellite) rainfall data (mm),
Pobs - Observed rainfall data (mm),
μ (Pobs) - Average value of observation data (mm),
μ (Praw) - Average value of model (satellite) data (mm).
This method adjusts the number of rainy days and intensity of satellite rainfall by setting a threshold. This threshold ensures that the number of rainy days in the (satellite) model matches the number of rainy days in the observational data. If the model's average number of rainy days in a given month is more than the observational data, rainfall smaller than the threshold will be converted to 0 (no rain). The corrected rainfall value is determined through the subsequent processes (Andari et al., 2024).
Determining threshold values (Pth)
Calculate the correction factor (Sm) based on the following equation.
(2) {S_m} = {{\mu \left( {{P_{obs}} > {P_{th}}} \right)} \over {\mu \left( {{P_{raw}} > {P_{th}}} \right) - {P_{th}}}} The correction factor is multiplied by the model data using the following equation:
(3) {P_{corr}} = {P_{raw}} \times {S_m}
The EQM method looks for statistical adjustments between the observed Cumulative Distribution Function (CDF) and the model CDF quantiles. It does this by finding the empirical quantiles of the observation and model data CDFs, and then finding the relationship between those quantiles to obtain the correction factor. This combines the model data with the observation data to create a function that transforms the modeled rainfall into a more accurate one. After this adjustment, the CDFs of the model and observations should theoretically be the same.
In this study, the EQM method was implemented by constructing empirical cumulative distribution functions (ECDF) for both CHIRPS and AWS rainfall data across the entire validation period, using 100 quantiles (Percentile) to capture the distribution of each dataset with sufficient detail. To ensure a smooth and continuous correction, linear interpolation was applied between adjacent quantiles, allowing satellite rainfall estimates falling between defined bins to be accurately adjusted. This approach enables bias correction to be applied consistently across the entire rainfall spectrum, including ranges with sparse observations, while maintaining the spatial specificity of local rainfall patterns by applying the correction separately for each station.
Where:
ECDFraw - Cumulative Distribution Function (CDF/quantile function).
ECDF_{obs}^{ - 1}
Validation is the process of ensuring that the model produces accurate and reliable results. In research, this involves testing data consistency and assessing model uncertainty in hydrological predictions (Marta et al., 2023). This study uses a Taylor diagram to present the validation results, combining correlation coefficients, centred root mean square difference (cRMSD), and standard deviation ratios in a two-dimensional graph. This diagram facilitates comparison between observed and simulated data patterns and is very useful for evaluating the performance of satellite-based rainfall estimates (Taylor, 2001).
Satellite performance evaluation is a structured process that evaluates the performance of a satellite or its components according to its purpose. It involves measuring and analyzing various aspects of performance, such as the accuracy, reliability, efficiency, and suitability of satellite data in describing physical conditions or measured phenomena, such as rainfall. In this research, the POD (Probability of Detection), FAR (False Alarm Ratio), and CSI (Critical Success Index) methods are used to evaluate satellite performance as presented in the following Table 1.
Satellite performance evaluation accuracy values
| Statistical Parameter | Formula | Value Range | Description |
|---|---|---|---|
| POD |
| ∼1 | The satellite detected most of the actual event. |
| FAR |
| ∼0 | Satellites minimize false alarms. |
| CSI |
| ∼1 | The satellite has good overall performance. |
POD is the fraction of rain events estimated by the satellite that occurred. FAR is the error of the satellite when estimating a rain event, but it did not occur. CSI combines POD and FAR by integrating correct detections, missed events, and false alarms.
The data required in this study is daily rainfall data from September 2023 to March 2025, assuming that measurement data 0 means no rain, so it is omitted. The data types collected in this study are primary data collected by AWS Ambient Weather WS-2902 and secondary data obtained by downloading it via the internet. The rainfall data used in this study are as follows.
Daily surface rainfall data obtained through the measurement of the AWS Ambient Weather WS-2902 device as primary data; data can be accessed through the website https://www.ecowitt.net/home/login.
CHIRPS daily rainfall data as secondary data, data obtained from the website https://data.chc.ucsb.edu/products/CHIRPS-2.0/.
Initial analysis was conducted by comparing daily rainfall data from the CHIRPS satellite with observational data from the Automatic Weather Station (AWS). In this stage, days with zero rainfall were excluded to focus the analysis on actual rainfall events and better observe intensity patterns. Figure 2 shows a comparison of rainfall intensity between CHIRPS and AWS, where AWS displays higher values and more extreme fluctuations.
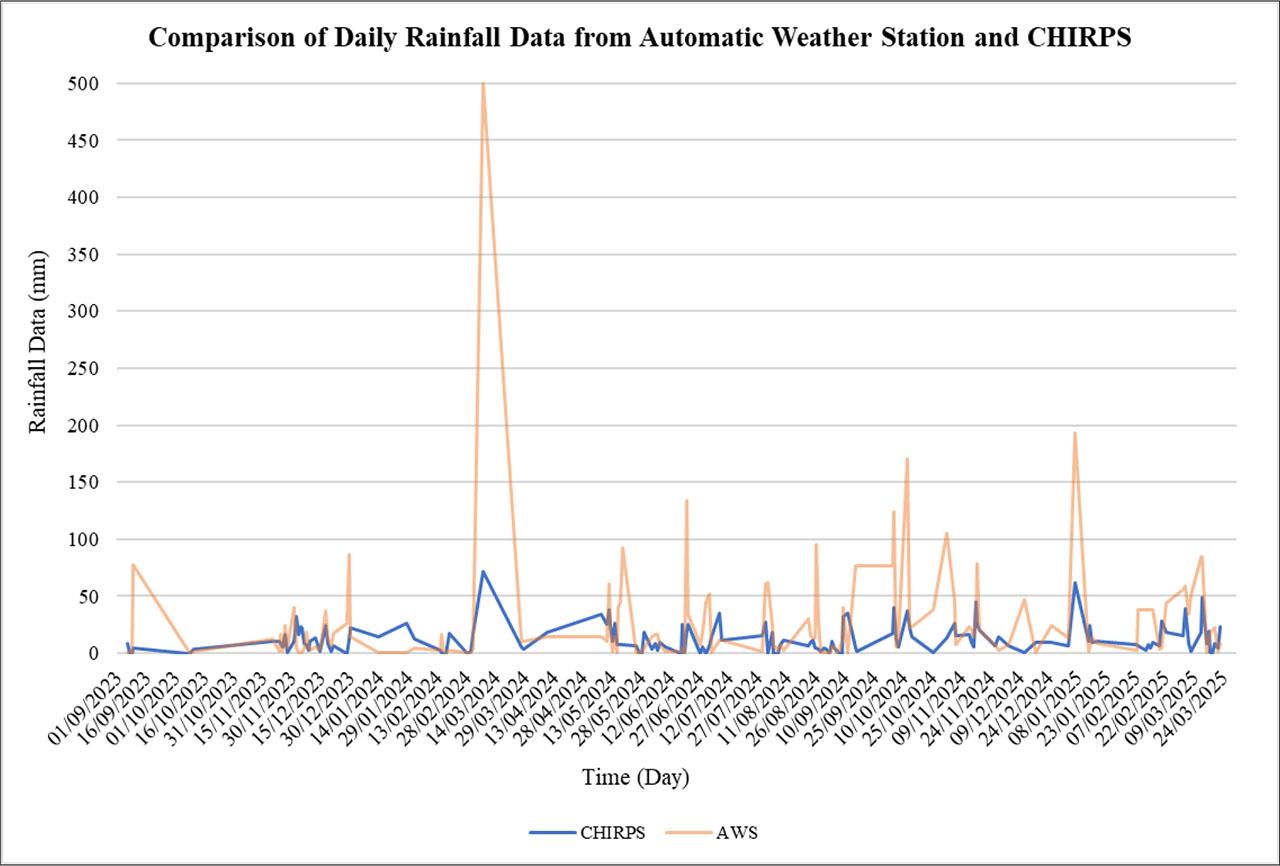
Comparison graph of daily rainfall data from AWS and CHIRPS
CHIRPS captures the general daily pattern and performs reasonably well for light to moderate rainfall, it underestimates high-intensity events. The CHIRPS curve also appears flatter, indicating reduced day-to-day variability due to its lower spatial and temporal resolution and the averaging approach used in satellite processing. These findings suggest limitations in CHIRPS' ability to detect localized, intense rainfall, thus supporting the need for bias correction to improve its accuracy for daily rainfall estimation.
The comparison graph shows that all three bias correction methods, Linear Scaling (LS), Local Intensity Scaling (LOCI), and Empirical Quantile Mapping (EQM), enhanced the alignment of CHIRPS rainfall estimates with AWS observational data, though with varying effectiveness. The application of the LS (blue line) method resulted in improved estimates of average daily rainfall. However, this method exhibited notable underestimations during high-intensity rainfall events, particularly in March 2024 and January 2025 (Figure 3). This limitation is attributed to using a single correction factor applied uniformly across all data points.
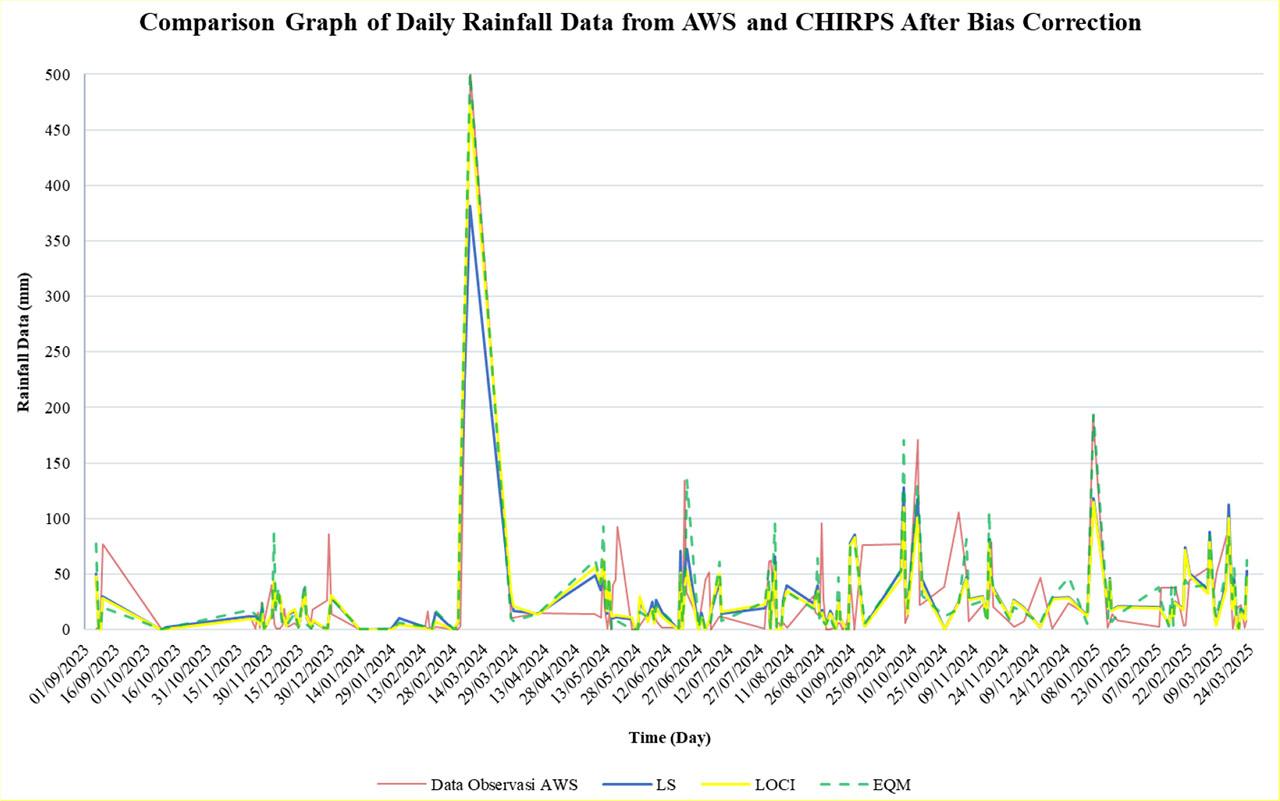
Comparison graph of daily rainfall data from AWS and CHIRPS after bias correction
The LOCI (yellow line) method yielded better conformity with AWS observations, particularly in representing the frequency and variability of rainfall at low to moderate intensities. However, it still showed discrepancies during extreme events. In comparison, the EQM (dashed line) method demonstrated the highest level of agreement with AWS data across all intensity ranges. It was particularly effective in capturing the magnitude and timing of rainfall, including extreme events not adequately represented by the other methods. Overall, while each correction technique improved the performance of CHIRPS data to some extent, EQM and LOCI provided the most substantial enhancements in reflecting the temporal dynamics and intensity distribution of daily rainfall.
The validation result of CHIRPS rainfall data is presented in the following Table 2. The raw CHIRPS data showed weak performance, with a low correlation of 0.55, standard deviation, and cRMSD values of 12.39 mm and 44.39 mm, respectively. This indicates poor agreement with AWS observations and limited reliability for daily rainfall analysis. After correction, all methods significantly improved CHIRPS accuracy. The LOCI method achieved the highest correlation (0.80) and the lowest cRMSD (30.39 mm), with a standard deviation (43.56 mm) close to that of AWS (50.09 mm), reflecting improved variability and closeness to observed data. EQM, while having a slightly higher cRMSD (32.72 mm), preserved the natural variation best with a standard deviation of 50.39 mm, closest to AWS, though it was slightly less precise in rainfall timing. The LS method also improved performance (CC = 0.78; cRMSD = 31.41 mm) but had a lower standard deviation (38.64 mm), indicating reduced variability capture. Bias correction significantly enhances CHIRPS data quality, with LOCI and EQM identified as the most effective methods for improving daily rainfall estimation.
Results of validated CHIRPS rainfall data
| Products | Mean | Standard Deviation | Centred RMS Difference (cRMSD) | Correlation Coefficient |
|---|---|---|---|---|
| AWS | 26.34 | 50.09 | 0.00 | 1.00 |
| CHIRPS RAW DATA | 12.04 | 12.39 | 44.39 | 0.55 |
| LS | 26.34 | 38.64 | 31.41 | 0.78 |
| LOCI | 25.75 | 43.56 | 30.39 | 0.80 |
| EQM | 29.18 | 50.39 | 32.72 | 0.79 |
These findings are further supported by the Taylor diagram in Figure 4, which visualizes the statistical performance of each correction method in terms of correlation coefficient (cc), standard deviation, and centered root mean square difference (cRMSD) against AWS observations. In the diagram, the angular position indicates the correlation strength, the radial distance represents the standard deviation, and the distance from the reference point denotes the cRMSD. As shown in Figure 4, the LOCI is positioned closest to the reference point, suggesting that it achieves the most balanced and accurate representation of the observed AWS data. These results, in line with Table 2, confirm that LOCI is the most theoretically optimal correction approach based on the Taylor diagram framework.
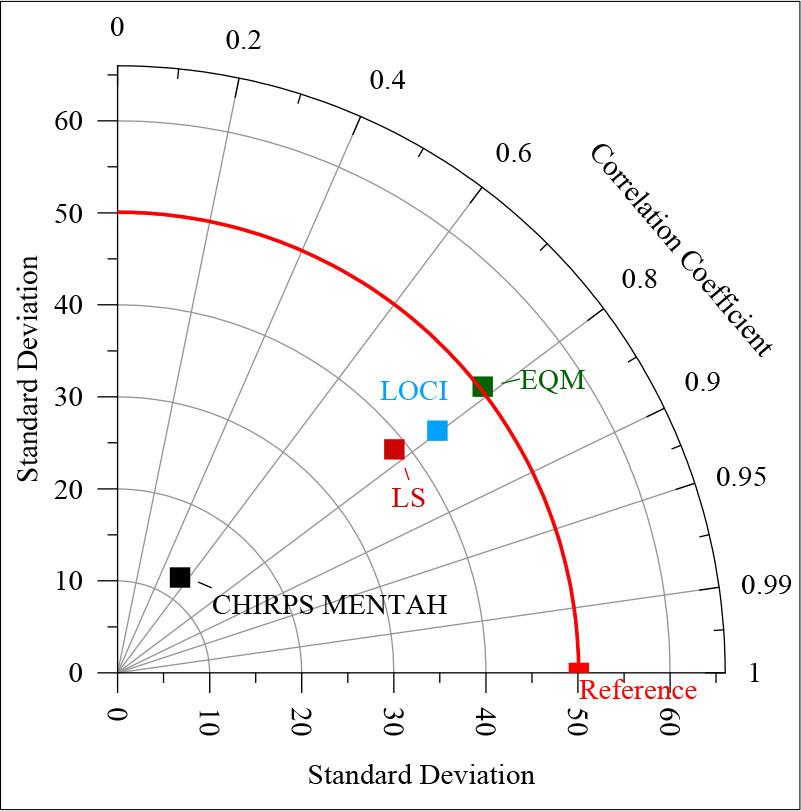
Taylor diagram of corrected data
Satellite performance evaluation
| Detection Classification | Many data |
|---|---|
| POD | 0.9 |
| FAR | 0.1 |
| CSI | 0.8 |
To evaluate the performance of CHIRPS in detecting daily rainfall events, a rainfall threshold of greater than 1 mm/day was applied. This threshold was selected to filter out trace precipitation and to ensure that only meaningful rainfall events were included in the analysis. It was uniformly applied to both CHIRPS and AWS datasets to maintain consistency in event detection. According to Table 3, the Probability of Detection (POD) was 0.90, indicating that CHIRPS correctly identified 90% of rainfall events observed by AWS. The False Alarm Ratio (FAR) was 0.10, showing that 10% of CHIRPS-detected rainfall events did not correspond to actual observations. The Critical Success Index (CSI) reached 0.80, reflecting a high overall accuracy in rainfall event detection. These results indicate that CHIRPS data demonstrates strong performance in detecting daily rainfall, with a high detection rate and a low error rate.
The results of this study demonstrate that the uncorrected CHIRPS rainfall data exhibit suboptimal performance in capturing daily rainfall dynamics, particularly in regions characterized by high spatial and temporal variability such as West Sumatra. A relatively low correlation coefficient (CC = 0.55) and elevated cantered root mean square difference (cRMSD = 44.39 mm) signify a substantial discrepancy from AWS observations. These findings are consistent with those reported by Saidah et al. (2024), who observed a tendency for CHIRPS to underestimate rainfall in North Lombok, and López-Bermeo et al. (2022), which notes that CHIRPS is unreliable in tropical mountainous regions.
The application of three bias correction techniques, Linear Scaling (LS), Local Intensity Scaling (LOCI), and Empirical Quantile Mapping (EQM), significantly improved the accuracy of CHIRPS estimates. Among these, LOCI outperformed the others in capturing light to moderate rainfall variability, achieving the highest correlation (CC = 0.80) and the lowest cRMSD (30.39 mm), indicating enhanced alignment with AWS daily rainfall patterns. LOCI’s ability to adjust both rainfall frequency and intensity above a wet-day threshold makes it particularly effective in correcting for non-homogeneous rainfall distribution (Ramadhan et al., 2024). EQM showed a slightly lower correlation (CC = 0.78) and a higher cRMSD (30.39 mm) than LOCI, but excelled under heavy rainfall conditions, especially in preserving distributional characteristics and correcting extreme events (Romadhoni et al., 2021). Its standard deviation (50.39 mm) closely matched that of AWS, reflecting its strength in replicating rainfall variability. In contrast, LS, which applies a uniform correction factor, improved mean estimates (CC = 0.78) but failed to capture the non-linearity and distributional spread of the data, resulting in substantial underestimation during high-intensity events (e.g., March 2024 and January 2025). These outcomes align with Budiyono & Faisol (2021), who highlighted the necessity of CHIRPS calibration to reflect daily rainfall variability accurately, and by Dinku et al. (2018), who emphasized the role of bias correction in mitigating systematic and random errors in satellite-derived precipitation products.
In addition, categorical performance metrics revealed a high Probability of Detection (POD = 0.90), low False Alarm Ratio (FAR = 0.10), and a favourable Critical Success Index (CSI = 0.80), suggesting that CHIRPS data effectively identifies rainfall occurrences. These results align with those of Suryanto et al. (2023) and Faisol et al. (2020), who reported strong detection performance of CHIRPS in high-resolution and daily-scale applications across different regions of Indonesia. Nonetheless, as noted by Shrestha et al. (2017), CHIRPS performance may deteriorate in regions with complex terrain due to limitations in spatial resolution and estimation algorithms.
Overall, the findings reinforce the utility of statistical bias correction in enhancing the operational value of CHIRPS data for hydrometeorological monitoring. Each correction method presents distinct advantages: LOCI improve temporal precision and magnitude estimation, EQM maintains statistical fidelity of intensity distributions, and LS offers a straightforward implementation approach. These methodological options allow researchers and practitioners to tailor correction strategies to specific climatic conditions and analytical objectives.
Despite corrections made to address bias, this study still has several limitations. First, the validation process was limited to a single AWS station at the Faculty of Engineering, Andalas University. This limited the spatial representation of findings across the broader West Sumatra region, which has complex topography and spatially variable rainfall patterns. Second, the study's timeframe (September 2023 to March 2025) cannot capture longer-term seasonal or interannual climate variability. Third, this analysis assumes equilibrium in rainfall distribution, an assumption that may not hold under changing climate conditions.
The improved performance of bias-corrected CHIRPS data confirms its potential as a viable alternative for rainfall monitoring in regions with limited observation infrastructure. LOCI is highly recommended for studies focused on event-based rainfall analysis, while EQM is more suitable for applications that maintain rainfall distribution characteristics. Region-specific optimization and validation of correction approaches remain essential for integrating satellite-derived rainfall data into hydrological and climatological decision-making frameworks.
Rainfall data is a fundamental component in agricultural planning, hydrological modelling, and disaster risk mitigation, especially in regions such as West Sumatra, which experience high spatial and temporal variability in rainfall. Addressing the challenges posed by the limited availability and uneven distribution of ground-based rainfall observations in Indonesia, this study validates the performance of CHIRPS satellite-based rainfall data compared to AWS observations. Uncorrected CHIRPS data showed poor agreement with ground-based observations, highlighting the need for correction before use in local-scale analysis. Through bias correction, particularly with the LOCI and EQM methods, the accuracy of CHIRPS data improved significantly in correlation, error reduction, and rainfall intensity representation. These findings confirm the suitability of bias-corrected CHIRPS data as a viable alternative source for operational hydrometeorological applications, especially in data-scarce environments. The enhanced reliability of corrected CHIRPS products opens promising opportunities for practical implementation in early warning systems, flood forecasting, and hydrological modelling, where real-time or near-real-time data are essential. Among the tested correction methods, EQM is particularly advantageous in modelling extreme events, while LOCI provide robust estimates across moderate rainfall regimes, both features are critical for anticipating hydroclimatic hazards. Future research should focus on extending validation to multiple AWS sites across diverse topographical and climatic settings to improve spatial representativeness. Additionally, investigating dynamic or seasonally adaptive correction techniques would enable better accommodation of non-stationary biases under evolving climate patterns. The integration of bias corrected CHIRPS into hydrological simulation tools and decision support platforms should also be explored to maximize its utility for policy making and risk reduction strategies.