

Figure 1:
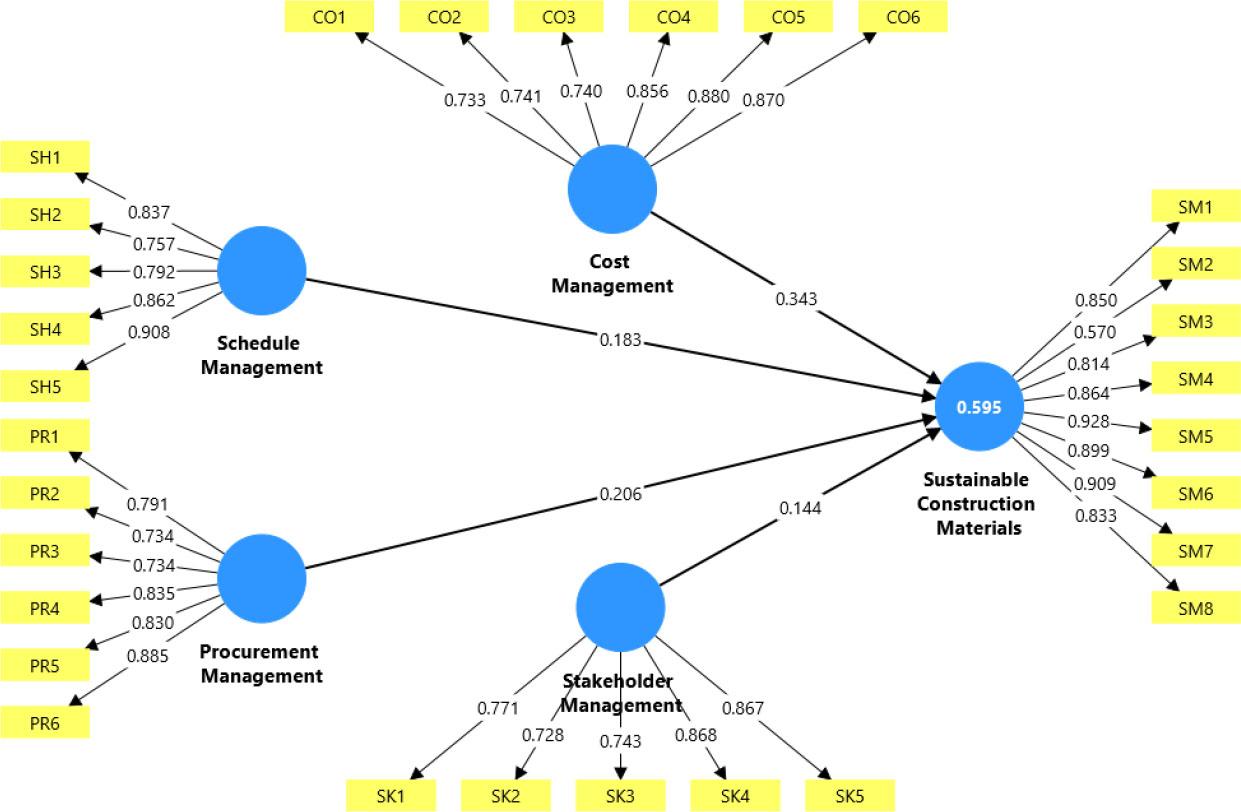
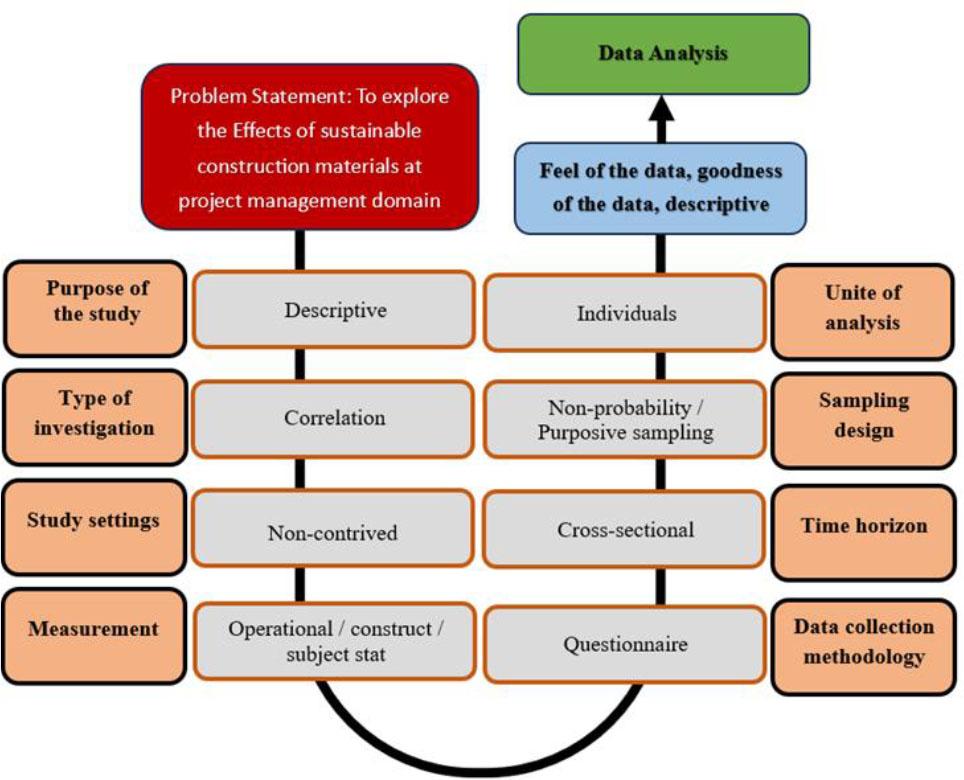
Figure 2:
Descriptive Statistics of the Variables
| Items | Mean | Observed min | Observed max | Standard deviation | Excess kurtosis | Skewness | Number of observations used |
|---|---|---|---|---|---|---|---|
| CO1 | 6.398 | 6.000 | 7.000 | 0.490 | −1.836 | 0.417 | 384.000 |
| CO2 | 6.370 | 6.000 | 7.000 | 0.483 | −1.716 | 0.542 | 384.000 |
| CO3 | 6.471 | 6.000 | 7.000 | 0.499 | −1.997 | 0.115 | 384.000 |
| CO4 | 6.432 | 6.000 | 7.000 | 0.495 | −1.935 | 0.274 | 384.000 |
| CO5 | 6.383 | 6.000 | 7.000 | 0.486 | −1.775 | 0.484 | 384.000 |
| CO6 | 6.365 | 6.000 | 7.000 | 0.481 | −1.690 | 0.565 | 384.000 |
| PR1 | 6.352 | 6.000 | 7.000 | 0.477 | −1.619 | 0.624 | 384.000 |
| PR2 | 6.367 | 6.000 | 7.000 | 0.482 | −1.703 | 0.553 | 384.000 |
| PR3 | 6.430 | 6.000 | 7.000 | 0.495 | −1.929 | 0.285 | 384.000 |
| PR4 | 6.378 | 6.000 | 7.000 | 0.485 | −1.752 | 0.507 | 384.000 |
| PR5 | 6.375 | 6.000 | 7.000 | 0.484 | −1.740 | 0.518 | 384.000 |
| PR6 | 6.336 | 6.000 | 7.000 | 0.472 | −1.522 | 0.697 | 384.000 |
| SH1 | 6.359 | 4.000 | 7.000 | 0.526 | 1.140 | −0.225 | 384.000 |
| SH2 | 6.393 | 4.000 | 7.000 | 0.534 | 1.025 | −0.337 | 384.000 |
| SH3 | 6.419 | 4.000 | 7.000 | 0.529 | 0.279 | −0.256 | 384.000 |
| SH4 | 6.388 | 4.000 | 7.000 | 0.523 | 0.334 | −0.144 | 384.000 |
| SH5 | 6.354 | 4.000 | 7.000 | 0.520 | 0.462 | −0.063 | 384.000 |
| SK1 | 6.333 | 5.000 | 7.000 | 0.477 | −1.403 | 0.637 | 384.000 |
| SK2 | 6.378 | 5.000 | 7.000 | 0.490 | −1.637 | 0.440 | 384.000 |
| SK3 | 6.422 | 5.000 | 7.000 | 0.499 | −1.779 | 0.254 | 384.000 |
| SK4 | 6.357 | 5.000 | 7.000 | 0.484 | −1.540 | 0.531 | 384.000 |
| SK5 | 6.336 | 5.000 | 7.000 | 0.478 | −1.419 | 0.625 | 384.000 |
| SM1 | 6.318 | 5.000 | 7.000 | 0.471 | −1.293 | 0.711 | 384.000 |
| SM2 | 6.581 | 4.000 | 7.000 | 0.509 | −0.301 | −0.625 | 384.000 |
| SM3 | 6.349 | 5.000 | 7.000 | 0.482 | −1.497 | 0.566 | 384.000 |
| SM4 | 6.344 | 4.000 | 7.000 | 0.491 | −0.371 | 0.328 | 384.000 |
| SM5 | 6.307 | 5.000 | 7.000 | 0.467 | −1.211 | 0.761 | 384.000 |
| SM6 | 6.333 | 4.000 | 7.000 | 0.488 | −0.298 | 0.371 | 384.000 |
| SM7 | 6.346 | 4.000 | 7.000 | 0.492 | −0.388 | 0.318 | 384.000 |
| SM8 | 6.404 | 5.000 | 7.000 | 0.496 | −1.731 | 0.330 | 384.000 |
Discriminant Validity of the Construct Heterotrait-Monotrait ratio (HTMT)
| Constructs | Cost Management | Procurement Management | Schedule Management | Stakeholder Management | Sustainable Construction Materials |
|---|---|---|---|---|---|
| Cost Management | |||||
| Procurement Management | 0.828 | ||||
| Schedule Management | 0.700 | 0.780 | |||
| Stakeholder Management | 0.815 | 0.835 | 0.717 | ||
| Sustainable Construction Materials | 0.779 | 0.756 | 0.688 | 0.729 |
Summary of Structural Model Results-1
| Constructs | VIF | Original sample [O] beta | Sample mean [M] | Standard deviation [STDEV] | T statistics [|O/STDEV|] | P values [-] |
|---|---|---|---|---|---|---|
| Cost Management -> Sustainable Construction Materials | 2.592 | 0.343 | 0.334 | 0.083 | 4.147 | 0.000 |
| Schedule Management -> Sustainable Construction Materials | 2.092 | 0.183 | 0.194 | 0.086 | 2.119 | 0.034 |
| Procurement Management -> Sustainable Construction Materials | 3.049 | 0.206 | 0.205 | 0.087 | 2.367 | 0.018 |
| Stakeholder Management -> Sustainable Construction Materials | 2.550 | 0.144 | 0.144 | 0.076 | 1.887 | 0.059 |
Demographic Information of the Respondent
| Demographic | Category | Frequency | Percentage [%] |
|---|---|---|---|
| Designation | Project Manager | 61 | 16% |
| Construction Manager | 95 | 25% | |
| Project Engineer | 123 | 32% | |
| Material / QA/QC Engineer | 83 | 21% | |
| Other (higher management) | 22 | 6% | |
| Organization | Contractor | 160 | 42% |
| Consultant | 206 | 53% | |
| Client | 18 | 5% | |
| Experience | 0–5 Years | 20 | 5% |
| 6–10 Years | 180 | 47% | |
| 11–15 Years | 123 | 32% | |
| More than 15 Years | 61 | 16% |
Summary of Structural Model Results-2
| Constructs | R2 | Q2 | ƒ2 |
|---|---|---|---|
| Cost Management -> Sustainable Construction Materials | 0.595 | 0.569 | 0.112 |
| Schedule Management -> Sustainable Construction Materials | 0.039 | ||
| Procurement Management -> Sustainable Construction Materials | 0.034 | ||
| Stakeholder Management -> Sustainable Construction Materials | 0.020 |
Summary of Hypothesis Testing
| Hypothesis | Description of hypothesis | Results |
|---|---|---|
| H1 | Project Cost Management challenges affect the use of Sustainable Construction materials in building projects. | Positively Supported |
| H2 | Project Schedule Management challenges affect the use of Sustainable Construction materials in building projects. | Positively Supported |
| H3 | Project Procurement Management challenges affect the use of Sustainable Construction materials in building projects. | Positively Supported |
| H4 | Project Stakeholder Management challenges affect the use of Sustainable Construction materials in building projects. | Not Supported |
Construct reliability and validity
| Constructs | Items | Loadings | Cronbach’s alpha | Composite reliability [rho_a] | Composite reliability [rho_c] | Average variance extracted [AVE] |
|---|---|---|---|---|---|---|
| Sustainable Construction Materials | SM1 | 0.850 | 0.937 | 0.943 | 0.950 | 0.706 |
| SM2 | 0.570 | |||||
| SM3 | 0.814 | |||||
| SM4 | 0.864 | |||||
| SM5 | 0.928 | |||||
| SM6 | 0.899 | |||||
| SM7 | 0.909 | |||||
| SM8 | 0.833 | |||||
| Cost Management | CO1 | 0.733 | 0.890 | 0.894 | 0.917 | 0.650 |
| CO2 | 0.739 | |||||
| CO3 | 0.742 | |||||
| CO4 | 0.858 | |||||
| CO5 | 0.879 | |||||
| CO6 | 0.869 | |||||
| Schedule Management | SH1 | 0.837 | 0.889 | 0.892 | 0.916 | 0.646 |
| SH2 | 0.757 | |||||
| SH3 | 0.792 | |||||
| SH4 | 0.862 | |||||
| SH5 | 0.908 | |||||
| Procurement Management | PR1 | 0.790 | 0.888 | 0.892 | 0.919 | 0.694 |
| PR2 | 0.734 | |||||
| PR3 | 0.737 | |||||
| PR4 | 0.836 | |||||
| PR5 | 0.830 | |||||
| PR6 | 0.883 | |||||
| Stakeholder Management | SK1 | 0.771 | 0.855 | 0.860 | 0.897 | 0.636 |
| SK2 | 0.728 | |||||
| SK3 | 0.743 | |||||
| SK4 | 0.868 | |||||
| SK5 | 0.867 |