

The construction industry has the potential to significantly influence sustainable development through its resource consumption, environmental performance, and socio-economic development. The global awareness of climate change and the resource depletion is increasing, as a result, the transition towards sustainable construction materials and practices are of utmost important subject in order to mitigate the environmental implications of construction projects. Researches has been undertaken to investigate the possibility of producing sustainable construction material by using construction waste and substitute materials in order to help mitigate the resource depletion (Hilal et al., 2024). The supplementary cementitious materials like fly ash, micro silica, and ground granulated blast furnace slags are game changes in the concrete industry, help mitigating conservation of natural resources, and reduce the greenhouse gas emission (Mousa et al., 2025).
The definition of a sustainable building material has now expanded beyond typical traits to encompass issues such as the locality of a material, composition, recycling, waste management, lifecycle performance, durability, and reusability. These could be recycled concrete blocks and recycled concrete aggregates. To enhance efficiency of resources and support the circular economy, rational choice of materials and reduction of the project impact on the environment is to be considered. Passive strategies like natural ventilation, glazing, insulation helps in decreasing energy consumption (Sadar Din & Ishak, 2024). Sustainable construction materials are offsetting air and water pollution by lowering material consumption and improving the quality of indoor air. Their application helps reduce emissions of harmful products in the course of production and beyond the building life cycle. In addition, recycled aggregates such as composite bio-based materials reduce wastes and limit water pollutant dumping. These materials demonstrate their high effectiveness in solving environmental problems (Wang, 2025).
The practice of considering sustainability within project management is positive, because it contributes to organizing a project, engaging stakeholders, and carrying out a cost-benefit analysis. Sustainable building materials are capable of enhancing the environment, building occupant health, and working with the rest of the world to mitigate climate change, conserve resources, and foster energy efficiency. Additionally, utilizing non-construction materials (e.g., municipal waste) in building materials enhances thermal comfort and reduces emissions, water consumption, and environmental impact. Sustainable materials generally provide better indoor air quality, energy reduction, and long-term value to occupants, communities, and countries (Sadar Din & Ishak, 2024).
These kinds of materials aim at minimizing greenhouse gases, energy consumption, and waste of materials. They support sustainable building construction through the reduction of operational costs, improving the indoor air of buildings and enhancing local economic development, which brings social inclusivity to meet the climate change objectives. Nevertheless, availability and cost concerns in the emerging markets as well as technological development and regulatory norms are the challenges that persist (Kashem et al., 2024).
Environmentally friendly building materials are crucial for promoting sustainability, reducing waste, and preventing resource depletion. They can enhance project performance by providing greener options and help address challenges like resource exhaustion and emissions, leading to a more efficient and sustainable built environment. (Daniel Iluyomade & Okwandu, 2024)
They play a vital role in mitigating pollution, resolving environmental issues—including affordable housing—supporting the economy and energy supply, and addressing the increasing demand in the growing market of environmentally friendly building practices in response to urbanization challenges. They also play a vital role in minimizing wastage of resources, use of energy, and carbon emissions in the construction industry. They provide substitutes to traditional materials, making them less environmental sound and favorable to sustainable development by using new materials made of polymer concrete and bamboo fiber geopolymer. However, much research is still needed on alternative materials and methods for sustainable development and decreasing reliance on traditional resources. (Yu, 2024).
Sustainable building materials have an increased energy efficiency and durability and the recyclability of building materials to minimize environmental impacts and overcome the challenge of resource scarcity, which helps the construction sector to achieve sustainable management regardless of the toughest challenges concerning cost, regulation, and technological impediments (Patil et al., 2024). Sustainable building materials are more energy efficient, durable, and recyclable, solving the environmental issue and reducing the shortage of resources. This helps the construction industry to embrace sustainability in spite of the difficulties in mainstream use (Din & Ishak, 2025).
The adoption of sustainable materials faces several significant barriers, including higher material costs, which increase overall project expenses. (Chan et al., 2018). Potential project cost overruns further obstruct the use of sustainable materials by causing financial uncertainty. (Gounder et al., 2023). The high cost of sustainable materials discourages stakeholders in the construction industry from adopting sustainable options. (Safinia et al., 2017). Economic factors are the primary obstacle to green construction in achieving sustainable development within industry. (Shi et al., 2013), particularly the high costs associated with sustainable construction. The high costs related to these materials. (Wang et al., 2019) are a main obstacle for organizations. (Khan et al., 2018).
Sustainable materials are prohibitively expensive, and this is mostly worsened by imports. Sustainable projects face additional upfront costs because many stakeholders are unwilling to invest, which discourages efforts to adopt sustainable practices. (Ahmed & El-Sayegh, 2022). The fact that extensive monetary investments are required for sustainable practices makes it a major barrier that causes organizations and individuals to reject these initiatives. (Kineber et al., 2022). Its access to adequate financing is a major problem since investors are usually reluctant to invest in green projects citing risks and uncertainties relating to the projects. In addition, the costs of green products are usually high upfront and may pose a significant challenge to new businesses and small companies. (Hendratmoko, 2023); the cost related issues are primary concerns that hinder the projects in adopting sustainable practices. Misconceptions that sustainability causes extra costs also hinder its adoption, discouraging many from pursuing environmentally responsible construction practices. (Aghimien, Adegbembo, et al., 2018).
The challenge of increased investment costs (Aghimien, Aigbavboa, et al., 2018) and the fear of higher investment costs related to sustainable construction materials discourages adoption. (Aghimien et al., 2019). These initial investment costs hinder widespread adoption due to increasing financial burdens on projects. (Djokoto et al., 2014). High costs serve as a major obstacle to sustainable construction practices. (Yin et al., 2018); this perception of extra costs associated with sustainable materials discourages their use. (Akadiri, 2015), economic challenges inhibit the stable pricing of sustainable construction materials (Kissi et al., 2018). The high cost of building materials (Omer & Noguchi, 2020), and the lack of government incentives further hinders the uptake of green building technologies by reducing financial motivation for stakeholders. (Chan et al., 2018).
Lengthy planning and approval processes (Chan et al., 2018), and a limited understanding of sustainability among developers are the significant challenges that cause delays in green construction projects (Shi et al., 2013). Lengthy timeframe for eco-friendly building design (Akcay, 2023), lack of skilled workforce, lack of cooperation among team members (Maqbool & Amaechi, 2022), and compliance with constantly evolving green building codes and regulations poses considerable challenges for project teams (Ahmed & El-Sayegh, 2022), thus affecting the successful delivery of sustainable projects.
The lack of knowledge among professionals working in the industry (Akadiri, 2015) and inaccessible information regarding the sustainability of materials restricts the opportunities that stakeholders have to make informed decisions. The limited availability of tools and data for effective material comparison further complicates the selection process, making evaluating and adopting sustainable options difficult (Akadiri, 2015). The lack of efforts to promote sustainable materials (Omer & Noguchi, 2020), and complex building codes and regulations (Yin et al., 2018) negatively influence decision-making, hence, slowing progress toward sustainable construction practices (Safinia et al., 2017). The low availability of sustainable building materials is highly risky to projects and long lead times of these materials increase challenges to project schedules resulting to errors and delays. (Polat et al., 2017).
There are various barriers to the adoption of sustainable construction materials, including low demands on green measures. Education and technological development gaps that impede on the success of implementation and mainstreaming of green building projects are still considerable. (Zhang et al., 2024). Moreover, the absence of the green building materials has an influence on the project development and hinders the implementations. The current poor market demand of green building practices also constrains their nationwide usage. (Akcay, 2023).
A limited number of green building material suppliers and long lead times for quotes on sustainable construction materials pose significant supply-related risks for construction projects. (Polat et al., 2017). Such a limited supply of green suppliers also hinders the adoption of sustainable practices by restricting access to the necessary materials and products. (Shi et al., 2013), and complicating the shift toward sustainable construction practices (Wang et al., 2019). The lack of expertise in sustainable materials is a significant obstacle because it hampers informed decision-making. Additionally, low demand and the absence of a culture that encourages green construction are slowing the widespread adoption. (Safinia et al., 2017), and reducing market opportunities for sustainable material (Gounder et al., 2023).
Green procurement encounters several barriers that prevent its successful implementation. A lack of corporate commitment to sustainability and green practices in operations restricts the ability to adopt green procurement effectively. Additionally, limited knowledge among practitioners hampers their capacity to implement sustainable procurement practices. (Khan et al., 2018). Green entrepreneurs face many significant challenges when starting and expanding their ventures. Additionally, the green entrepreneurial process itself involves complex obstacles and risks, such as market uncertainties, technological limitations, and regulatory hurdles, all of which hinder the success of green businesses. (Hendratmoko, 2023).
Different countries face different challenges related to their development levels, which influence their approach to building requirements. Additionally, the rising demand for complex systems to achieve sustainable development goals (SDGs) further increases resource demand, adding pressure on material shortages and prices. (Omer & Noguchi, 2020).
Several challenges hinder the implementation of sustainability, such as management-related and standards-related barriers that prevent the adoption of sustainable practices through uncertainty and inconsistencies. (Kineber et al., 2022). These include resistance to change, government, and resource-related barriers that negatively affect the development of sustainable construction activities. Additionally, a lack of skills and poor cooperation among team members create further challenges, affecting the successful completion of sustainable projects. (Maqbool & Amaechi, 2022). The resistance to change is the main factor, and the client does not prioritize sustainable materials over traditional materials. (Aghimien et al., 2019), due to the lack of knowledge about the echo friendly buildings. (Akcay, 2023). Lack of public awareness about sustainable construction (Djokoto et al., 2014), construction-related problems (Aghimien, Adegbembo, et al., 2018), low level of stakeholder interest, and lack of understanding of the concept of sustainability are some other aspects that create obstacles (Yin et al., 2018).
Insufficient organizational awareness and knowledge of the principles of sustainability (Ahmed & El-Sayegh, 2022), lack of green building codes, education, and technological gap are the key challenges that limit the successful implementation and acceptance of green building strategies (Zhang et al., 2024). The absence of information or common knowledge about advantages and access to green building materials is another obstacle on the way to change the current constructing process. (Wang et al., 2019). Attributable to uncertainty and perceived risks (Aghimien, Aigbavboa, et al., 2018), unavailability of accessible information about sustainable materials, inaccessibility of the tools and data allowing effective material comparison (Akadiri, 2015); a scarcity of training and awareness among industry professionals complicates the selection process and makes it difficult to evaluate and embrace the sustainable choices (Akadiri, 2015).
Sustainability is further hampered by a lack of corporate commitments and management-related barriers (Chan et al., 2018), whereby businesses do not prioritize or incorporate green practices into their operations (Khan et al., 2018). Finding the right amount of funding also remains the key challenges since investors are reluctant to aid green projects due to risks and uncertainties (Hendratmoko, 2023). Government-related barriers (Chan et al., 2018), lack of knowledge among stakeholders, and lack of government policies to support the use of sustainable materials (Kissi et al., 2018), inability to provide stakeholder incentives to use these materials and supportive policies are the most significant barriers. Conservative practices and the attitude in the industry are also contributors to the ineffective usage of sustainable materials (Gounder et al., 2023).
The aim of the paper is to explore the extent to which the issues of cost, time, procurement and stakeholder management have impact on use of sustainable materials in construction. To explore how cost, schedule, procurement, and stakeholder management issues in project management influence the adoption and use of sustainable construction materials in building projects.
Independent Variables (IVs):
Cost Challenges
Schedule Challenges
Procurement Challenges
Stakeholder Challenges
Dependent Variable (DV):
Use of Sustainable Construction Materials
H1: The cost management challenges has negative effect on sustainable construction materials adoption.
H2: The schedule management challenges has negative effect on sustainable construction materials adoption.
H3: The procurement management challenges has negative effect on sustainable construction materials adoption.
H4: The stakeholder management challenges has negative effect on sustainable construction materials adoption.
Figure 1 shows the conceptual framework.
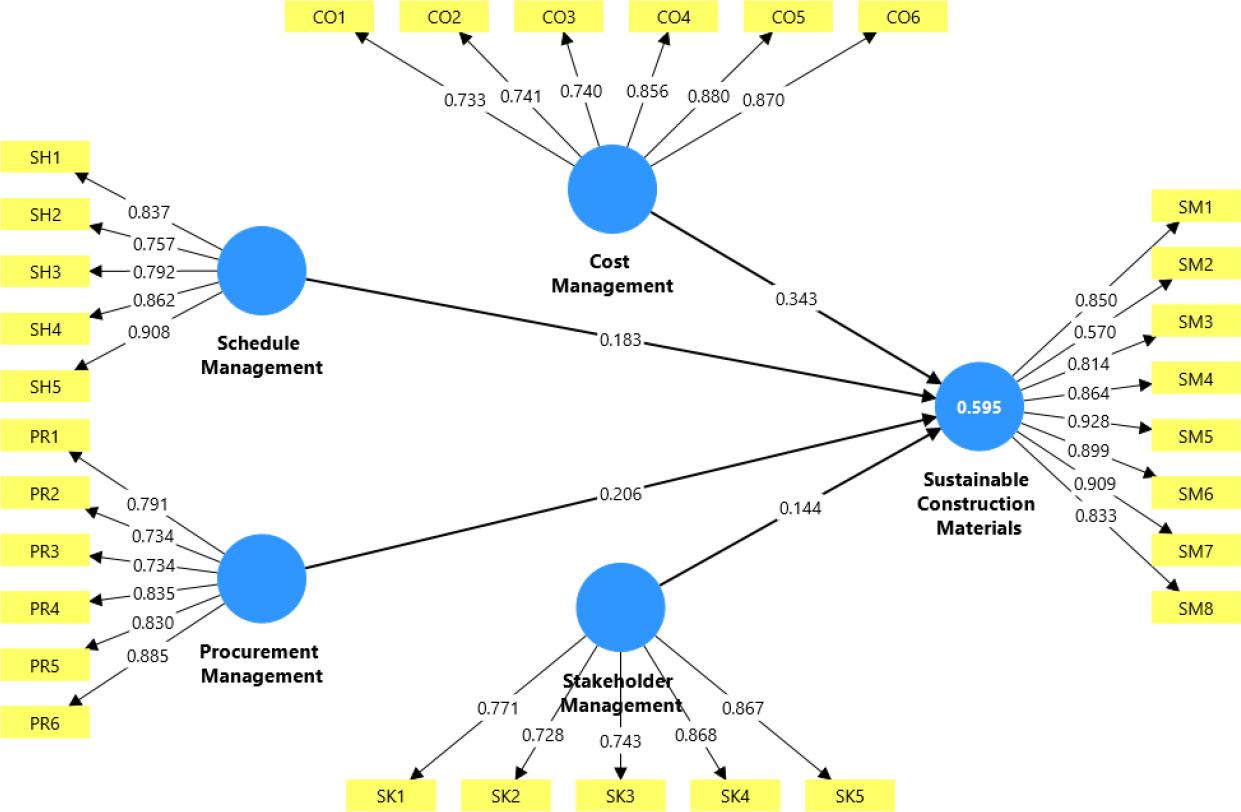
Conceptual framework
The study utilized the quantities approach in order to achieve research aims and objective. A comprehensive literature was conducted by the research to identify the challenges faced in the move towards sustainable construction practices. The questionnaire was developed with four independent variables namely cost challenges, schedule challenge, procurement challenges, stakeholder challenges, and one dependent variable named sustainable construction materials. Primary data was collected through an online questionnaire survey with key members of construction professionals working on various ongoing building projects. Purposive sampling techniques were used, and the collected data was further analyzed using partial least squares structural equation modeling (PLS-SEM). Figure 2 shows the research flowchart diagram.
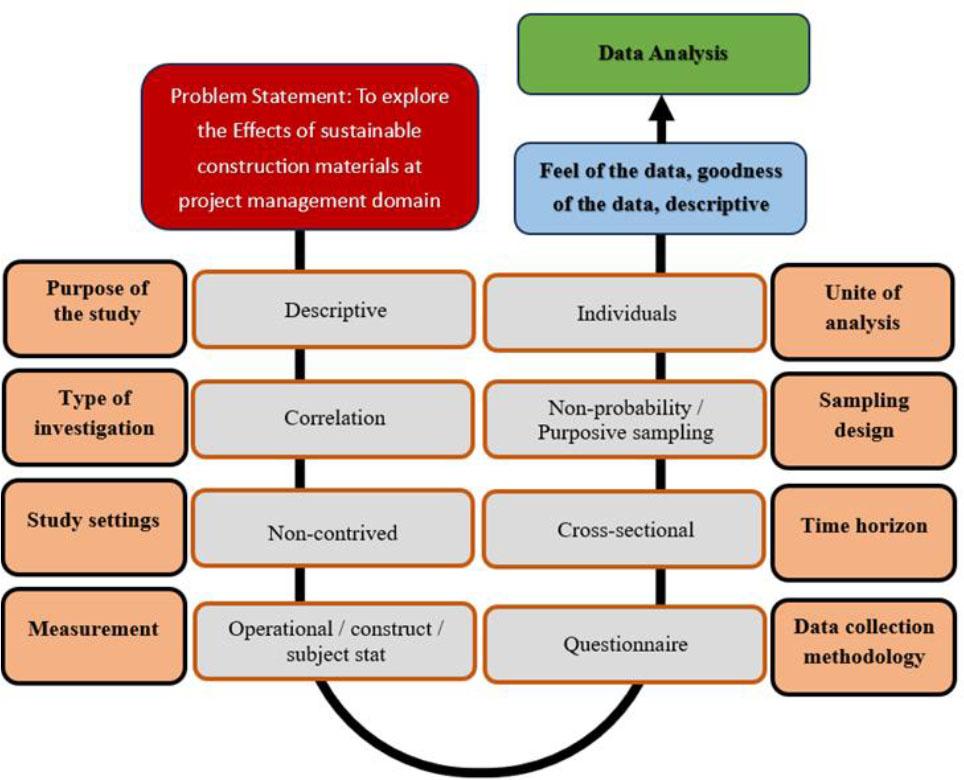
Conceptual framework
Quantitative research aims to measure problems, assess their size, and analyze cause-and-effect patterns. It frequently uses data collection methods such as questionnaires, experiments, and observation checklists. Generally, it relies on numbers and statistics to help the researcher make comparisons, perform calculations, and identify specific patterns, averages, and relationships from the data collected. (Pritha Bhandari, 2020). This approach is classical, constructive, experiential, or empirical model (Kivunja & Kuyini, 2017). It is used to find the relationship between two variables, whereas qualitative methods describe social phenomena and their contexts.
The current study aimed to identify the impact of the main project management challenges in using sustainable materials for construction. Related research used the questionnaire to advance the discussion on sustainability in the built environment, including sustainable/green materials and sustainable construction. (Abraham & Gundimeda, 2018; Gounder et al., 2023). Furthermore, the questionnaire is frequently used in social research because it is easy to administer and quickly reaches a large population. Therefore, this study is suitable for large targets such as clients, consultants, construction professionals, and contractors working for public and private construction companies across the seven states of the UAE.
The survey questionnaire was developed from scholarly, peer-reviewed articles that highlight the challenges of project management in sustainable construction practices. It consists of six sections. The first section of the questionnaire covers the respondent’s role, years of experience, and the type of organization. The second section includes sustainable construction materials with eight measurable items codes as SM1, SM2, SM3, SM4, SM5, SM6, SM7, and SM8. The items from SM1 to SM8 are the representative of the challenges of sustainable materials. The third section focuses on the project cost management factor related to sustainable materials, featuring six measurable items of the construct codes as CO1, CO2, CO3, CO4, CO5, and CO6, these items from CO1 to CO6 are the representative of the challenges of cost management. The variables evaluate respondents’ perceptions of the higher costs linked to sustainable materials compared to traditional ones, including higher upfront costs, increased overall expenses, and cost fluctuations.
The fourth section covers project schedule factors related to sustainable materials, including five measurable items within the construct codes as SH1, SH2, SH3, SH4, and SH5. The items from SH1 to SH5 are the representative items of the challenges of schedule management challenges. The items consist of project delays, schedule extensions, longer construction times, and a slower work progress rate due to sustainable construction materials. The fifth section evaluates the latent variable of project procurement management concerning sustainable materials through six measurable items codes as PR1, PR2, PR3, PR4, PR5, and PR6. The items from PR1 to PR6 are the representative of the procurement management challenges. These include limited supplier options, cross-border sourcing, increased negotiations with vendors, restricted choices, enhanced compliance, and financial constraints. All items are rated on a 7-point Likert scale. The sixth section involves factors related to project stakeholder management in the context of sustainable materials, comprising five measurable items coded as SK1, SK2, SK3, SK4, SK5, and SK6. The items from SK1 to SK6 are the representative of the procurement management challenges, representing stakeholder awareness, interest, benefits, resistance, and the intention to change traditional methods.
In the current research, the latent variables are measured on a seven-point Likert scale, ranging from strongly disagree (1) to strongly agree (7). Numerous studies have revealed several benefits and drawbacks of both 5- and 7-point scales. A 7-point scale might be more effective than a 5-point scale in considering the survey respondent’s reliability. It also offers more options, increasing the likelihood that it will accurately reflect the respondent’s true perspective. The Likert scale, the most popular scaling tool in many research studies, is a non-comparative, unidimensional method where respondents rate their level of agreement or disagreement with various declarative statements. (Athirah Diyana Mohammad Yusof et al., 2019).
This study used non-probability, purposive sampling. The purposive sampling technique is a non-random method in which a researcher selects informants based on their specific qualities of interest. (Tobi & Kampen, 2018). This will be fair since hardly anyone or a specific group of individuals could have been of assistance. (Boadu & Sorour, 2015). Thus, purposive sampling involves selecting individuals likely to have relevant information and understanding of the subject being studied. (Creswell, 2018). The population in this research refers to construction industry practitioners working on various building construction projects.
In structural equation modeling, the sample size is essential because it influences statistical power, model fit, and parameter estimates. PLS-SEM often shows better convergence behavior and greater statistical power in these situations. (Henseler & Fassott, 2010) (Reinartz et al., 2009). The data was gathered through an online survey questionnaire. The survey was conducted with construction industry practitioners to understand their perspectives on sustainable construction materials and related challenges. A Google Form link was shared with professionals involved in building construction projects who are implementing sustainable materials across the UAE. The collected data is then analyzed to assess the importance of these challenges.
One key principle guiding the sampling technique is the sampling frame. The sampling frame is the complete list of all respondents within the larger population from which research samples are selected. Without an appropriate sampling frame that clearly defines and estimates the population, it becomes impractical for the researcher to collect a representative sample capable of leading to a conclusion that can be generalized to the entire population. (Opoku, 2016). The research sample frame in this study consists of construction organizations in the UAE. The sample was drawn from registered construction companies listed by the municipalities of seven states.
When conducting research, the researcher’s main challenge is estimating the number of respondents needed to provide the necessary information and determining the process by which sufficient data can be generated to meet his research objectives. Because of this, a sampling technique is considered the most suitable method for making such estimates and gathering information to help him fulfill the requirements of his research goals. (Opoku, 2016).
The sample size in quantitative research is crucial for ensuring the sample’s representativeness and generalizability. A large sample size alone will not allow findings to be extrapolated to the population if proper sampling design is not used. Similarly, unless the sample size is sufficient to achieve the desired accuracy and confidence, results may be unreliable. However, an excessively large sample size (say, more than 500) could also be problematic because it increases the likelihood of making a Type II error. In other words, if the sample is too big, even weak relationships may appear significant. This might lead us to wrongly assume these relationships are true for the population when they’re not. Therefore, research benefits from neither too large nor too small a sample size.
Generally, a sample size of 30 to 500 is appropriate for most studies. In multivariate research, which includes methods such as multiple regression analysis, the sample size should be several times (preferably ten times or more) the number of variables being examined. In the book “RESEARCH METHODS FOR BUSINESS: A Skill-Building Approach, Fifth Edition” by Uma Sekaran and Roger Bougie, the recommended sample size varies depending on the population size. As the population increases, the sample size also increases, but beyond a certain point, the sample size ceases to grow further, remaining constant at 384 (Sekaran & Bougie, 2016). Since the population of engineers working in the building construction industry across the UAE is unknown in the current research, a sample size of 384 is considered appropriate.
The current research have used Partial Least Square Structural Equation Modeling (SEM) technique for statical analysis. SEM’s widespread popularity comes from its ability to test comprehensive theories and concepts. Its success depends on its capacity to measure latent variables and analyze their relationships. (J. F. Hair et al., 2019). Partial least squares, a specific SEM approach, uses an iterative process to optimize the explained variance of the endogenous variable. Because of this feature, PLS-SEM is especially useful for exploratory research. Recently, PLS-SEM has gained a lot of interest. The ability of PLS-SEM to address challenging modeling problems that often occur in the social sciences, such as atypical data characteristics (e.g., non-normal data) and highly complex models, largely explains the method’s increasing popularity. (J. F. Hair et al., 2019).
PLS-SEM is a great choice for researchers because of its many advantages. It is especially useful when working with constructively assessed measures, small sample sizes, and non-normal data. By applying adjustments based on the central limit theorem, the PLS algorithm adapts to non-normal data, reducing the negative effects of skewed data on statistical power (J. F. Hair et al., 2019). Analysis of complex relationships among latent variables is common with Structural Equation Modeling (SEM). Although covariance-based SEM (CB-SEM) is appropriate in theory confirmation, it is limited in small sample size and non-normal data. These are addressed by a regression-like, variance-based approach maximizing variances explained that partial least square PLS-SEM uses. Due to its flexibility, simplicity of principles, and compatibility with exploratory studies, PLS-SEM is a great alternative to CB-SEM, particularly in applied and empirical research (Sarstedt et al., 2022). The steps involved in PLS-SEM application include defining the inner and outer models, collecting and analyzing data, estimating the models, and interpreting the outcomes.
The measurement model in the study is tested for Cronbach’s Alpha and Composite Reliability as reliability indictors. The convergent validity is assessed using average variance extracted AVE, and discriminant validity is tested with Heterotrait-Monotrait ration. In variance-based structural equation modeling, and notably Partial Least Squares SEM (PLS-SEM), the discriminant validity of a measurement model has historically been ascertained through the Fornell & Larcker criterion and evaluation of cross-loadings. Nevertheless, a comprehensive simulation study conducted by Henseler et al. (2015) revealed that such traditional approaches tend to be unreliable to measure the lack of discriminant validity in common research settings. As a way of overcoming this weakness, they proposed the Heterotrait-Monotrait (HTMT) ratio of correlations as more powerful and accurate. The multicomponent HTMT criterion is anchored on the multitraitmultimethod (MTMM) matrix and proven to consist of high discriminant validity concerns detection capabilities as compared to the Fornell-Larcker criterion in the contemporary PLS-SEM application (Henseler et al., 2015).
Whereby, the structural model is tested for collinearity (VIF), path coefficient beta, coefficient of determination R2 value, effect size f2, parameter estimates t-statistics, and statical significance p-value.
In the research, the researcher employed a quantitative approach, utilizing an online survey questionnaire methodology. The survey was created on Google Forms, and the link was shared with construction industry professionals, including project managers, project engineers, materials engineers, and QA/QC engineers working at various contracting, consulting, and client firms. The survey link was distributed via social media platforms, including WhatsApp groups. The respondents were contacted personally through phone calls as well as in person for their convenience and reassurance, since several respondents feared online scams and hacking activities via social media links. The respondents were briefed about the survey and assisted in understanding the questionnaire if needed. The data was collected from 384 respondents working in the construction industry across various building projects throughout the UAE.
The survey included 384 professionals from the construction industry. The demographic data shows that 16% were project managers, 25% were construction managers, 32% were project engineers, 21% were materials and quality assurance/control engineers, and 6% held upper management positions. Respondents working with contracting companies account for 42%, those working with consulting firms make up 53%, and those working with clients comprise 5%. The sample includes professionals with 0–5 years of experience (5%), 6–10 years (47%), 11–15 years (32%), and more than 15 years (16%), as shown in Table 1.
Demographic Information of the Respondent
| Demographic | Category | Frequency | Percentage [%] |
|---|---|---|---|
| Designation | Project Manager | 61 | 16% |
| Construction Manager | 95 | 25% | |
| Project Engineer | 123 | 32% | |
| Material / QA/QC Engineer | 83 | 21% | |
| Other (higher management) | 22 | 6% | |
| Organization | Contractor | 160 | 42% |
| Consultant | 206 | 53% | |
| Client | 18 | 5% | |
| Experience | 0–5 Years | 20 | 5% |
| 6–10 Years | 180 | 47% | |
| 11–15 Years | 123 | 32% | |
| More than 15 Years | 61 | 16% |
The descriptive statistics summarizes the data collected. The normality of the data is evaluated by the use of a descriptive analysis, mean, standard deviation, skew and kurtosis. The means explain the average of the data whereas standard deviation explains the degree of the data against the mean. Skewness shows the direction whether the data is skewed either to the positive or negative and kurtosis explains how sharp the data is in the peak.
Normality is regarded as the fundamental assumption in multivariate analysis. (J. F. Hair et al., 2019). Assuming that the data distribution is typically distributed for each element, and any linear combination of elements is the definition of normally (Sarstedt et al., 2014). The data distribution is less significant for partial least square PLS-SEM analysis because it is of a non-parametric kind. However, highly skewed data may make it more challenging to determine significant levels (J. Hair et al., 2017).
Kurtosis measures how peaked a distribution is, while skewness measures its asymmetry. Skewness quantifies how uneven a variable’s distribution is. A normal distribution is considered symmetrical if its skewness value is zero. A positive skew indicates that the tail on the right side of the distribution is longer than on the left, while a negative skew means the tail on the left side is longer than on the right.
Depending on the histograms and the absolute values of skewness and kurtosis for sample sizes larger than 300, significant non-normality can be indicated by either an absolute skew value greater than 2 or an absolute kurtosis greater than 7. (Kim, 2013) In the current study, all skewness and kurtosis values fall within the acceptable range. The descriptive statistics results are shown in Table 2. The results and analysis of the partial least squares structural equation model are summarized in the inner model (measurement model) and the outer model (structural model). (Sarstedt et al., 2014).
Descriptive Statistics of the Variables
| Items | Mean | Observed min | Observed max | Standard deviation | Excess kurtosis | Skewness | Number of observations used |
|---|---|---|---|---|---|---|---|
| CO1 | 6.398 | 6.000 | 7.000 | 0.490 | −1.836 | 0.417 | 384.000 |
| CO2 | 6.370 | 6.000 | 7.000 | 0.483 | −1.716 | 0.542 | 384.000 |
| CO3 | 6.471 | 6.000 | 7.000 | 0.499 | −1.997 | 0.115 | 384.000 |
| CO4 | 6.432 | 6.000 | 7.000 | 0.495 | −1.935 | 0.274 | 384.000 |
| CO5 | 6.383 | 6.000 | 7.000 | 0.486 | −1.775 | 0.484 | 384.000 |
| CO6 | 6.365 | 6.000 | 7.000 | 0.481 | −1.690 | 0.565 | 384.000 |
| PR1 | 6.352 | 6.000 | 7.000 | 0.477 | −1.619 | 0.624 | 384.000 |
| PR2 | 6.367 | 6.000 | 7.000 | 0.482 | −1.703 | 0.553 | 384.000 |
| PR3 | 6.430 | 6.000 | 7.000 | 0.495 | −1.929 | 0.285 | 384.000 |
| PR4 | 6.378 | 6.000 | 7.000 | 0.485 | −1.752 | 0.507 | 384.000 |
| PR5 | 6.375 | 6.000 | 7.000 | 0.484 | −1.740 | 0.518 | 384.000 |
| PR6 | 6.336 | 6.000 | 7.000 | 0.472 | −1.522 | 0.697 | 384.000 |
| SH1 | 6.359 | 4.000 | 7.000 | 0.526 | 1.140 | −0.225 | 384.000 |
| SH2 | 6.393 | 4.000 | 7.000 | 0.534 | 1.025 | −0.337 | 384.000 |
| SH3 | 6.419 | 4.000 | 7.000 | 0.529 | 0.279 | −0.256 | 384.000 |
| SH4 | 6.388 | 4.000 | 7.000 | 0.523 | 0.334 | −0.144 | 384.000 |
| SH5 | 6.354 | 4.000 | 7.000 | 0.520 | 0.462 | −0.063 | 384.000 |
| SK1 | 6.333 | 5.000 | 7.000 | 0.477 | −1.403 | 0.637 | 384.000 |
| SK2 | 6.378 | 5.000 | 7.000 | 0.490 | −1.637 | 0.440 | 384.000 |
| SK3 | 6.422 | 5.000 | 7.000 | 0.499 | −1.779 | 0.254 | 384.000 |
| SK4 | 6.357 | 5.000 | 7.000 | 0.484 | −1.540 | 0.531 | 384.000 |
| SK5 | 6.336 | 5.000 | 7.000 | 0.478 | −1.419 | 0.625 | 384.000 |
| SM1 | 6.318 | 5.000 | 7.000 | 0.471 | −1.293 | 0.711 | 384.000 |
| SM2 | 6.581 | 4.000 | 7.000 | 0.509 | −0.301 | −0.625 | 384.000 |
| SM3 | 6.349 | 5.000 | 7.000 | 0.482 | −1.497 | 0.566 | 384.000 |
| SM4 | 6.344 | 4.000 | 7.000 | 0.491 | −0.371 | 0.328 | 384.000 |
| SM5 | 6.307 | 5.000 | 7.000 | 0.467 | −1.211 | 0.761 | 384.000 |
| SM6 | 6.333 | 4.000 | 7.000 | 0.488 | −0.298 | 0.371 | 384.000 |
| SM7 | 6.346 | 4.000 | 7.000 | 0.492 | −0.388 | 0.318 | 384.000 |
| SM8 | 6.404 | 5.000 | 7.000 | 0.496 | −1.731 | 0.330 | 384.000 |
In the measurement model, the quality parameters of the constructs being studied are assessed through indicator reliability, internal consistency reliability, convergent validity, and discriminant validity.
Indicator loadings measure how strongly each item in the correlation matrix relates to the given principal component; higher absolute values indicate stronger correlations with the underlying variable. Loadings above the threshold show that the construct accounts for more than 50 percent of the indicator’s variance, thereby indicating acceptable indicator reliability. (J. F. Hair et al., 2019).
The indicator loadings of the reflective measurement model are assessed through a minimum acceptable limit threshold of 0.5 (Cheung et al., 2024). The factor loadings above 0.7 are desirable (J. Hair et al., 2017), However, researchers might encounter weaker outer loadings (< 0.70) in their studies. Instead of deleting the indicator, they assess how removing it affects content validity, composite reliability, and average variance extracted. Usually, items with outer loadings between 0.40 and 0.70 are considered for removal if doing so improves composite reliability and average variance extracted. (J. Hair et al., 2017).
All variable loadings in the current research are above 0.708, except for item SM2, which has a loading of 0.570. The item SM2 will undergo further evaluation for content validity, composite reliability, as well as convergent and discriminant validity to decide whether to retain or remove it from the scale. All other items have outer loadings ranging from 0.733 to 0.928, indicating that all elements used in this research demonstrate acceptable indicator reliability. Removing item SM2 (loading = 0.572) would not significantly increase CR and AVE, since the construct’s values already exceed the recommended thresholds. Consequently, no items were eliminated from the study for further analysis. Items with loadings between 0.40 and 0.70 are retained due to their contribution to content validity and will only be considered for removal if their deletion improves composite reliability or validity. Very weak loadings below 0.40 will be removed from the scale. (J. F. Hair et al., 2011).
Internal consistency reliability is evaluated using Cronbach’s Alpha and Jöreskog’s (1971) composite reliability. The suggested acceptable reliability range is 0.60 to 0.70. Values from 0.70 to 0.90 are regarded as satisfactory and good. (Diamantopoulos et al., 2012).
The instrument is considered reliable only if it provides stable and consistent measurements. The core of reliability is repeatability. If an instrument is used repeatedly, it should produce the same results. The two most common methods for establishing reliability are Cronbach’s Alpha and Composite Reliability (CR). The results for both Cronbach’s Alpha are shown in Table 3. Cronbach’s Alpha values ranged from 0.855 to 0.937, while Composite Reliability values ranged from 0.860 to 0.943. These values exceed 0.7, indicating a high level of internal consistency among the reflective variables, which shows strong internal coherence among the elements that define the constructs. Both reliability indicators exceed the minimum threshold of 0.70. (J. F. Hair et al., 2011). Hence, construct reliability is established.
Construct reliability and validity
| Constructs | Items | Loadings | Cronbach’s alpha | Composite reliability [rho_a] | Composite reliability [rho_c] | Average variance extracted [AVE] |
|---|---|---|---|---|---|---|
| Sustainable Construction Materials | SM1 | 0.850 | 0.937 | 0.943 | 0.950 | 0.706 |
| SM2 | 0.570 | |||||
| SM3 | 0.814 | |||||
| SM4 | 0.864 | |||||
| SM5 | 0.928 | |||||
| SM6 | 0.899 | |||||
| SM7 | 0.909 | |||||
| SM8 | 0.833 | |||||
| Cost Management | CO1 | 0.733 | 0.890 | 0.894 | 0.917 | 0.650 |
| CO2 | 0.739 | |||||
| CO3 | 0.742 | |||||
| CO4 | 0.858 | |||||
| CO5 | 0.879 | |||||
| CO6 | 0.869 | |||||
| Schedule Management | SH1 | 0.837 | 0.889 | 0.892 | 0.916 | 0.646 |
| SH2 | 0.757 | |||||
| SH3 | 0.792 | |||||
| SH4 | 0.862 | |||||
| SH5 | 0.908 | |||||
| Procurement Management | PR1 | 0.790 | 0.888 | 0.892 | 0.919 | 0.694 |
| PR2 | 0.734 | |||||
| PR3 | 0.737 | |||||
| PR4 | 0.836 | |||||
| PR5 | 0.830 | |||||
| PR6 | 0.883 | |||||
| Stakeholder Management | SK1 | 0.771 | 0.855 | 0.860 | 0.897 | 0.636 |
| SK2 | 0.728 | |||||
| SK3 | 0.743 | |||||
| SK4 | 0.868 | |||||
| SK5 | 0.867 |
Traditional Cronbach’s alphas provide less precise reliability because the items are unweighted, whereas composite reliability offers a more accurate measure as items are weighted based on individual indicator loadings. Therefore, the reliability results of composite reliability tend to be higher than Cronbach’s Alpha. Considering Cronbach’s Alpha too conservative and composite reliability too liberal, Rho A is proposed as an accurate measure of construct reliability. (Theo K. Dijkstra and Jörg Henseler, 2015).
The convergent validity of the constructs is demonstrated by the average variance extracted (AVE), which indicates the extent to which the construct converges and explains the variance of its items. The AVE is calculated by taking the mean of the squared loadings of the items of the construct. The acceptable threshold for convergent validity (AVE) is 0.50 or higher. This indicates that the construct itself accounts for 50 percent of the variance of its items. (Fornell & Bookstein, 1982; Reinartz et al., 2009).
The Average Variance Extracted (AVE) for each latent structure was calculated to evaluate the convergent validity of variables (Fornell & Bookstein, 1982; J. F. Hair et al., 2019). The convergent validity is assessed for the current research model, and values are presented in Table 3. All the AVE values are higher than the acceptable threshold value of 0.50. Therefore, the model demonstrates strong internal consistency and convergent validity.
Discriminant Validity of the Construct Heterotrait-Monotrait ratio (HTMT)
| Constructs | Cost Management | Procurement Management | Schedule Management | Stakeholder Management | Sustainable Construction Materials |
|---|---|---|---|---|---|
| Cost Management | |||||
| Procurement Management | 0.828 | ||||
| Schedule Management | 0.700 | 0.780 | |||
| Stakeholder Management | 0.815 | 0.835 | 0.717 | ||
| Sustainable Construction Materials | 0.779 | 0.756 | 0.688 | 0.729 |
Summarizing the results of indicator loadings, internal consistency reliability, and validity based on recent scholarly research articles. (J. F. Hair et al., 2019). Each item should have an indicator loading of more than 0.70, AVE should be equal to or greater than 0.50, and composite reliability should be more than or equal to 0.70.
According to the findings on the reliability of indicators for the items of the constructs, we previously discovered that item SM2 has an indicator loading of 0.57, which is below the threshold value. In contrast, other items of the same construct exceed the threshold values, and the AVE is 0.706, which is above the threshold value of 0.50. Therefore, item SM2 will be retained in the construct. (J. F. Hair et al., 2011).
Discriminant validity measures how well a construct is different from others in the model. It indicates how separate measures of different concepts are. The idea is that if two or more concepts are truly distinct, then valid measures of each should not be highly correlated.
The Heterotrait-monotrait (HTMT) correlation is used to assess discriminant validity (Voorhees et al., 2016). Regarding the geometric mean of the average correlation for the items measuring the construct, the HTMT represents the mean value of item correlations across constructs. Discriminant validity issues arise with higher values of HTMT. The accepted threshold for assessing discriminant validity is 0.85 or lower (J. F. Hair et al., 2019; Sarstedt et al., 2014). As shown in Table 4, the HTMT values are all well below the conservative threshold value of 0.85 for each construct pair.
Summary of Structural Model Results-1
| Constructs | VIF | Original sample [O] beta | Sample mean [M] | Standard deviation [STDEV] | T statistics [|O/STDEV|] | P values [-] |
|---|---|---|---|---|---|---|
| Cost Management -> Sustainable Construction Materials | 2.592 | 0.343 | 0.334 | 0.083 | 4.147 | 0.000 |
| Schedule Management -> Sustainable Construction Materials | 2.092 | 0.183 | 0.194 | 0.086 | 2.119 | 0.034 |
| Procurement Management -> Sustainable Construction Materials | 3.049 | 0.206 | 0.205 | 0.087 | 2.367 | 0.018 |
| Stakeholder Management -> Sustainable Construction Materials | 2.550 | 0.144 | 0.144 | 0.076 | 1.887 | 0.059 |
Summary of Structural Model Results-2
| Constructs | R2 | Q2 | ƒ2 |
|---|---|---|---|
| Cost Management -> Sustainable Construction Materials | 0.595 | 0.569 | 0.112 |
| Schedule Management -> Sustainable Construction Materials | 0.039 | ||
| Procurement Management -> Sustainable Construction Materials | 0.034 | ||
| Stakeholder Management -> Sustainable Construction Materials | 0.020 |
According to the results presented in Tables 3, and 4, the model demonstrates satisfactory reliability and validity; therefore, the measurement model is suitable for beginning the structural model assessment.
The structural model is tested after validating the measurement model. The structural model, also known as the inner model, involves analyzing its predictive validity and the inter-construct relationships. According to PLS-SEM, the following steps are involved in testing the structural model. (J. Hair et al., 2017) The structural model is tested for collinearity assessment (VIF), path coefficient assessment (beta), determination coefficient assessment (R2), effect size assessment (f2), and predictive significance assessment (Q2).
Before evaluating the relationships in the structural model, collinearity is checked to prevent bias in the regression results. The collinearity issue within the structural model is assessed by calculating the variance inflation factor (VIF) for the predictor variables. VIF values of 5 or higher suggest serious collinearity problems among the indicators of the predictor construct. (J. Hair et al., 2017). The Variance Inflation Factor (VIF) statistic is used to assess multicollinearity in the indicator. (Fornell & Bookstein, 1982). Multi-collinearity is not a serious issue if the VIF value is below 5. Table 5 presents the VIF values for the indicators in the study is below the recommended threshold (Jr. et al., 2017).
The path coefficient beta indicates the predicted variance in the units of the exogenous variables within the endogenous variable. Larger beta values signify a significant effect on the latent endogenous variable. These beta values are obtained through the PLS-SEM algorithm and reflect the hypothetical relationship between the exogenous and endogenous variables in the model. The path coefficient values range from −1 to +1. Positive values indicate a positive relationship, while negative values suggest a negative relationship. Values closer to 1 represent a strong relationship, whereas values closer to 0 indicate a weaker one. (J. F. Hair et al., 2019)
The bootstrapping technique is used to obtain values of beta, t-values, and p-values to test the hypothesized model. The two-tailed t-values for 10 percent, 5 percent, and 1 percent significance levels are 1.65, 1.96, and 2.58, respectively. (J. F. Hair et al., 2011).
The output results show that the independent variable “Cost Management” (beta 0.343, t-value 4.134, and p-value 0.000) demonstrates greater variation and has a significant impact on the dependent variable “Sustainable Construction Materials.” Procurement Management (beta 0.206, t-value 2.36, and p-value 0.018) shows moderate variation and a moderate effect on Sustainable Construction Materials. Schedule Management (beta 0.183, t-value 2.12, and p-value 0.034) has a weak influence on Sustainable Construction Materials, whereas Stakeholder Management (beta 0.144, t-value 1.887, and p-value 0.059) has an insignificant effect on Sustainable Construction Materials. Table 5 presents a summary of the structural model, variance inflation factor (VIF), beta coefficients, sample means, standard deviations, t-statistics, and p-values.
R2 is a coefficient that measures a model’s predictive power and is calculated by squaring the correlation between the actual and predicted values of the endogenous variable. The R2 value shows the combined effect of exogenous latent variables on the endogenous construct. In other words, the R2 value indicates how much of the variance in the dependent variable is explained by its related independent variables. Since R2 is the squared correlation of actual and predicted values and includes the data used in the model estimation to examine the model’s predictive ability, it functions as a measure of predictive power within the sample. (Ketchen, 2013; Leguina, 2015).
In this study, the inner path model yields a determination coefficient (R2) of 0.595 for the latent endogenous construct. Additionally, this study indicates that the design of the four independent variables explains a significant 59.5% of the variance in the dependent variable, which means that the model’s four latent independent variables—Cost Management, Schedule Management, Procurement Management, and Stakeholder Management—account for 59.5% of the use of Sustainable Construction Materials in building projects. Scholars suggest that R2 values of 0.75, 0.50, and 0.25 are considered substantial, moderate, and weak, respectively. (Henseler et al., 2015; Sarstedt et al., 2022) Therefore, the R2 value is moderate in this study.
Effect size f2 measures the impact of each exogenous construct on the endogenous construct within the study. The independent variable is removed from the model, and the effect of this removal on the dependent variable is evaluated by examining the change in the coefficient of determination, R2. The PLS-SEM calculates this effect by including and excluding the selected independent variable. f2 values of 0.02, 0.15, and 0.35 indicate small, medium, and large effects, respectively. (Cohen, 2013; Ketchen, 2013). Table 7 presents the f2 values from the SEM calculations, indicating that the effect sizes for Cost Management, Schedule Management, Procurement Management, and Stakeholder Management on Sustainable Construction Materials are 0.112, 0.034, 0.039, and 0.02, respectively. These findings agree with the recommendation of (Cohen, 2013), who notes that the R2 of three exogenous latent constructs has a moderate impact. In contrast, one exogenous latent construct has a weak effect on sustainable construction materials, as indicated by the R2 value.
Summary of Hypothesis Testing
| Hypothesis | Description of hypothesis | Results |
|---|---|---|
| H1 | Project Cost Management challenges affect the use of Sustainable Construction materials in building projects. | Positively Supported |
| H2 | Project Schedule Management challenges affect the use of Sustainable Construction materials in building projects. | Positively Supported |
| H3 | Project Procurement Management challenges affect the use of Sustainable Construction materials in building projects. | Positively Supported |
| H4 | Project Stakeholder Management challenges affect the use of Sustainable Construction materials in building projects. | Not Supported |
Predictive relevance of the model Q2 value, or predictive relevance, measures the model’s predictive power out-of-sample. Q2 values are derived using a blindfolding procedure to assess and perform cross-validation redundancy in the consistency of the PLS model. The blindfolding procedure is applied to the endogenous construct with reflective measurement model properties. (J. F. Hair et al., 2019; Ketchen, 2013).
The value of Q2 for the endogenous variable should be higher than zero to highlight the predictive accuracy of the structural model. Q2 values of 0, 0.25, and 0.50 represent low, medium, and high predictive relevance of the PLS model. (J. F. Hair et al., 2019). In the current study, the Q2 value is 0.569, exceeding the threshold and indicating that the predictive relevance of the path model is sufficient for the endogenous construct. The following table 6 illustrates the results of the coefficient of determination (R2), predictive relevance (Q2), and effect size (f2).
As shown in Tables 5, and 6, the summary of the structural model for sustainable construction materials indicates that the proposed hypotheses have been tested, and the results are as follows:
H1: Hypothesis H1 states that the challenges in cost management affect the use of sustainable construction materials in building construction projects. The hypothesized path for H1 is significant (β value = 0.343, t-value = 4.147, p-value = 0.000). Therefore, hypothesis H1 is supported, indicating a positive relationship.
H2: Hypothesis H2 states that the challenges in schedule management affect the use of sustainable construction materials in building construction projects. The hypothesized path for H2 is significant (β value = 0.183, t-value = 2.119, p-value = 0.034). Thus, hypothesis H2 is supported, demonstrating a positive relationship.
H3: Hypothesis H3 states that the challenges in procurement management affect the use of sustainable construction materials in building construction projects. The hypothesized path for H3 is significant (β value = 0.206, t-value = 2.367, p-value = 0.018). Thus, hypothesis H3 is supported, indicating a positive relationship.
H4: Hypothesis H4 states that the challenges in stakeholder management affect the use of sustainable construction materials in building construction projects. The hypothesized path for H4 is insignificant (β value = 0.144, t-value = 1.887, p-value = 0.059). Therefore, hypothesis H4 is not supported, as it shows no relationship. Table 7 illustrates the hypothesis results.
The results indicate that the correlation between cost challenge and use of sustainable construction material is positive and significant, such that a high cost deters the utilization of sustainable materials. This is supported by international literature, where financial limitations have always been cited as one of the greatest obstacles in sustainability initiatives in construction sector. Further, greater considerations on the issues of schedule and procurement reflect reality by indicating an actual limitations in the field where the project teams are overwhelmed by time-constrained and long procurement procedures that, in turn, compel a situation of prioritizing conventional and readily available materials instead of focusing on the sustainable ones. Interestingly, this study did not find a significant relationship between stakeholder challenges and the use of sustainable materials. This could be due to multiple reasons. One possibility is that the UAE already has an established regulatory framework and government-led sustainability initiatives that are currently increasing stakeholder awareness and acceptance of sustainable practices, including Estidama and the Dubai Green Building Regulations. Alternatively, it suggests that stakeholder concerns do exist but are not strong enough to statistically influence the choice of materials as much as other project limiting factors like cost and schedule.
The study is significant both in its theoretical and practical aspects. Theoretically, it addresses a major gap in current research by examining how the combination of various project management factors—such as cost, schedule, procurement, and stakeholder issues—affects the application of sustainable building products, rather than considering each factor separately as previous studies did. PLS-SEM analysis additionally makes the results obtained statistically significant and valid, and offers a profound interpretation of the intricate relations between the issues of project management and the sustainability of the introduced materials. In practice, the insights have potential implications to industry players. Estimating cost overruns, schedule pressures, and inefficient procurement as a burden to the use sustainable materials have been empirically proven and thus, project managers have time to address it further. The findings can also help policymakers formulate specific interventions such as financial and tax incentives, simplifying the procurement policy to make processes easier. In the case of construction firms, the study indicates that much is needed in terms of improving project planning, resource allocation as well as procurement processes in order to ensure that sustainable materials are indeed embedded within construction projects.
The research has limitations because it only collects data from the UAE, relies on self-reported data, and is cross-sectional. The future research is proposed to extend to different geographical locations, include qualitative data collection to get more contexts, and study other project management factors that can have an impact on sustainable materials use.
The study analyzed the determination of project management factors, which are cost, schedule, procurement, and stakeholders to affect the adoption of sustainable building materials- in the United Arab Emirates (UAE). These findings also indicate the barriers to the effective usage of sustainable materials are practical, primarily the costs, timeline, and procurement; which are in line with the global research on the construction industry. The findings highlight the need to consider the financial limitations, time issue, and procurement issues of building sustainable constructive materials in the building to increase its usage in the industry.
Notably, the researchers concluded that the stakeholder-related issues like change resistance or unawareness do not statistically significantly influence the use of sustainability materials in UAE. It would bring about the possibility that the acceptance among the stakeholders is slowly advancing with increase in government policies, regulating systems and awareness creation about the need to be sustainably built. In conclusion, issues regarding cost, schedule and procurement in project management are essential to address in an effort to ensure long term economic and environmental advantage to the construction industry.
The paper confirms that the inability to adopt the sustainable construction materials is highly linked to cost, time requirement and procurement, whereas stakeholder related issues seem not to play a crucial role in the UAE scenario. The study is insightful in that it takes an analysis of all these factors collectively but future studies need to cover more geographical locations, use qualitative methods of study and look into or uncover more avenues of project management as a way of secondary knowledge. The study is beneficial to the project managers, policymakers, and the stakeholders in the construction industry.