

Roads play a critical role in society by facilitating the economy, culture, and flow of goods and services as well as serving as an access link between different regions. They also help raise the community's standard of living and economy (Arianto et al., 2018; Isradi et al., 2021). One of the most crucial parts of the transportation infrastructure is the pavement, which directly and significantly affects overall safety standards and the provision of high-quality transportation services for the movement of people and commodities. Maintaining the road's current characteristics, which have existed since traffic first opened, is challenging. Regular and preventative maintenance is necessary for this (Al-Rubaee et al., 2020).
Numerous factors, such as excessive vehicle loads (overloading), unstable subgrade conditions, poor foundation soil condition, changing climate and environmental conditions, inadequate drainage systems that result in waterlogging, improper planning, an implementation that does not follow existing plans, pavement fatigue, compaction or shearing in all foundation layers, too much bitumen in the mixture, and a lack of maintenance can all lead to road damage (Isradi et al., 2021; Paikun et al., 2021). Road damage will undoubtedly slow down the speed and comfort of road users, cause many casualties because of road damage that is not immediately managed by the authorized agency, and result in many losses that may be felt by users directly (Mubaraki & Sallam, 2021). Therefore, identifying and addressing pavement distress is a critical concern for transportation agencies, and effective pavement management strategies can help ensure the safety and comfort of road users while minimizing costs and maximizing pavement lifespan (Fawzy et al., 2024).
The community will find it simpler to engage in various social activities if the roads are in satisfactory condition (Jatmika et al., 2018; Kadarisman et al., 2016; Paikun et al., 2021). Because traffic and the environment have an impact on the pavement, maintenance work is required to keep the road in satisfactory condition for the duration of the road's service life. A plan based on correct road condition data is required to carry out maintenance activities on schedule (Achmadi et al., 2017; Arianto et al., 2018).
Involving the conclusions drawn from PÍRY et al.'s study in decision-making can be viewed as a means of accomplishing objectives that are advantageous for meeting quantifiable indicators, delivering higher-quality, more convenient, and efficient transportation services, and conserving material and financial resources. When making decisions and designing projects, they use integration, inclusiveness, innovation, and strategy concepts. The actions they take have a measurable positive effect on sustainable development and the long-term enhancement of road quality (Píry et al., 2023).
Managing the assessment of in-service pavement is one of pavement engineering's most crucial tasks. Knowing the pavement's condition is essential for developing design requirements, maintenance schedules, and priorities. Surface distress evaluation is the one that has traditionally been distinguished by inconsistent data collection methods. Roughness and safety risks rise in tandem with the amount and intensity of distress. Complex distress, such as pavement cracking due to fatigue under repeated loadings and climatic cycles, is the cause of pavement deterioration (Al-Neami et al., 2018). Furthermore, one of the main causes of air pollution in cities is automobile traffic. Researchers have also studied the impacts of long-term exposure to pollutants on communities living near major roads. The dramatic increase in environmental pollutants is still a result of increased urbanization and motorization (Matara et al., 2024).
Surface-level distresses could be the result of normal wear and tear or a malfunction in the construction. The size and appearance of distresses might vary between rural and urban areas based on the type of surface, the underlying problem's severity (low, medium, or high), and other environmental factors. Typically, visual inspection of pavement surfaces can identify distresses, and manual measurement techniques can be used to record the number and degree of these distresses (Qureshi et al., 2023).
Transportation government agencies employ pavement management systems (PMS) to maintain road pavement conditions above the minimal performance levels at a fair cost and to encourage sustainable development. The pavement state is tracked to forecast degradation and identify when repair or rehabilitation is necessary to achieve this goal (Ali et al., 2023).
The activity of maintenance and restoration is a crucial stage in the life cycle of a road. A highway agency must consider the most recent state of the road section as well as the available money to choose and carry out a maintenance/rehabilitation program. Only the most appropriate program should then be processed. This emphasizes the significance of the method for evaluating road conditions (Al-Neami et al., 2018). One of the key components of any pavement management system (PMS) is the evaluation of pavement conditions. Pavement condition dictates maintenance requirements, costs, and priorities (A. I. Al-Mansour & Shokri, 2022; Setiadji & Purwanto, 2019). The system of road management and maintenance approaches based on scientific foundations is poor and deficient in the Iraqi road network, so the adoption of established foreign PMS systems should be considered. It also suffers from a lack of performance indicators that may be used to assess the state of the pavement throughout the course of its service life due to the lack of an extensive asset database and a method for continuously monitoring performance. Roughness data (IRI), rutting, and cracking were found in surveys; however, no systematic network-wide performance index is being monitored or utilized for maintenance scheduling (Al-Rubaee et al., 2020).
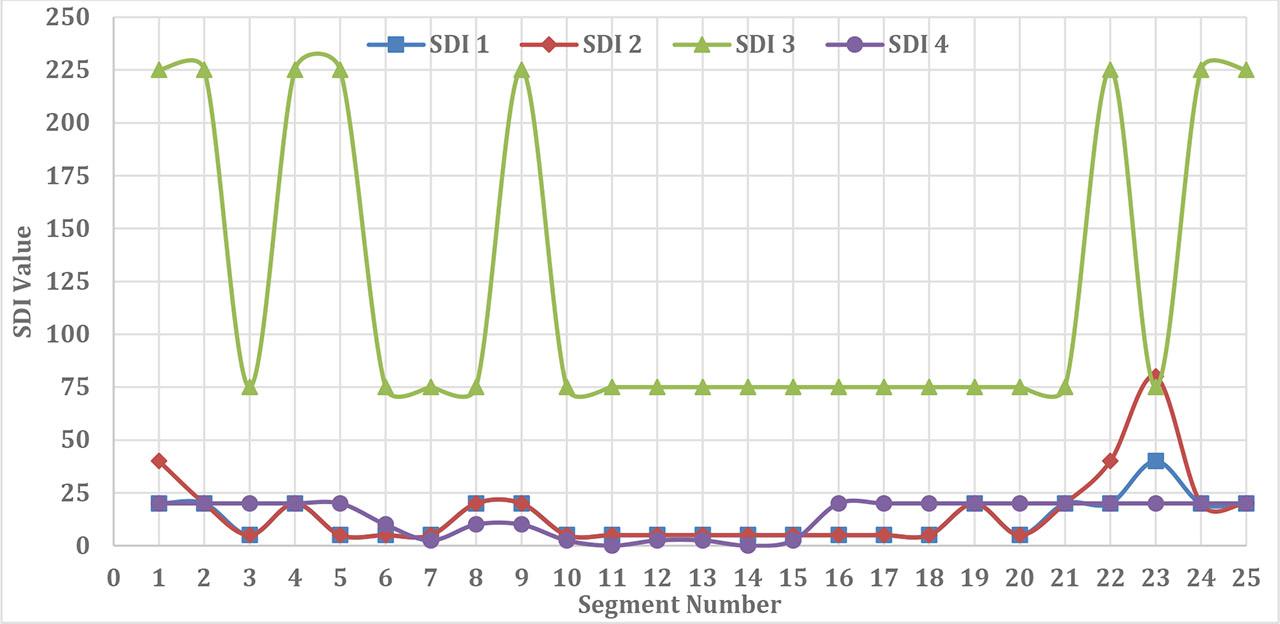
The Surface Distress Index (SDI) method was created by the Directorate General of Bina Marga in 2011 for a national road condition survey manual that is intended for road managers to assess pavement conditions and as a foundation for determining the kind of road maintenance needed (Al-Mansour et al., 1999; Isradi et al., 2021; Mahardika et al., 2021; Paikun et al., 2021; Yusup and Kartika, 2019). This method visually assesses the road condition by using the characteristics of total crack area, average crack width, number of potholes, and depth of vehicle rutting. Figure 1 (Al-Neami et al., 2018; Isradi et al., 2021; Paikun et al., 2021) shows SDI values for various damage types. Based on the SDI values, potholes are identified as the primary source of damage. In addition, Table 1 lists the categories of road damage based on the total SDI values.
Criteria of road damage based on SDI (Isradiet al., 2021; Paikun et al., 2021; Setiadji & Purwanto, 2019).
| Total SDI value | Damage category |
|---|---|
| <50 | Good |
| 50–100 | Fair |
| 100–150 | Bad |
| >150 | Poor |
Gerardo et al. (2025) employed the SDI approach in Indonesia to evaluate road conditions, particularly in regions with restricted access, insufficient equipment, and limited local resources, which results in inaccurate pavement condition assessments. Their study intends to create a more precise and effective model for evaluating pavement conditions based on three different forms of damage: rutting, potholes, and cracks (Gerardo et al., 2025). Lubis et al. (2025) used the SDI method in another study conducted in Indonesia. They determined that 51 road sections (98%) and one road section (2%) were in satisfactory and fair condition, respectively, based on their analysis of the degree of road damage in secondary local roads in Medan Amplas District. They concluded that the chosen road is in satisfactory condition and just needs regular upkeep at specific locations along each road segment (Lubis et al., 2025).
In the same context, research attempts to evaluate the state of the roads and determine the sorts of damage they have. Road condition was assessed using key indices such as the Surface Distress Index (SDI), Road Condition Index (RCI), International Roughness Index (IRI), and Pavement Condition Index (PCI). An average SDI value of 112 was discovered by visual examination, suggesting mild damage (Syukri et al., 2024). Furthermore, in Nepal, pavement status is typically evaluated using the SDI, and IRI data is also gathered annually, but it is rarely utilized to inform significant maintenance choices (Shrestha et al., 2024).
The following is the SDI value derived by measuring the pavement of the Gresik-Surabaya road's surface across a distance of 2800 meters, which is split into 28 segments: With an SDI value of 75 in segment 2, 60 in segment 3, 55 in segment 5, and 55 in segment 6, moderate SDI values are attained. Segment 1 yields a satisfactory SDI value with an SDI value of 15, segment 4 yields an SDI value of 25, segments 7 and 8 yield an SDI value of 10, segment 10 yields an SDI value of 25, segments 11 to 18 yield an SDI value of 20, segments 23 and 24 yield an SDI value of 15, segment 25 yields an SDI value of 10, and segments 26 to 28 yield an SDI value of 35 (Priambodo et al. 2023).
According to a study by Latjemma (2023), Jalan Bilo Tambun, Tolitoli Regency, had an SDI rating of 5.25. The road conditions were deemed satisfactory based on the SDI criteria, and routine maintenance was advised as a course of action (Latjemma S., 2023).
The selected road for the current case study is Al-Rabea Highway in Diwaniya city, south of Iraq, which is an urban area; it begins at Al-Shaafa’ town and ends in the city of Diwaniyah. It is a dual carriageway with two lanes per direction (10 m average width for each side) with a 4 m median. This highway serves many government institutions, hospitals, recreational centers, and companies, in addition to residential areas. This highway accounted for a significant portion of the damage. Figure 2 illustrates the location of the selected road.
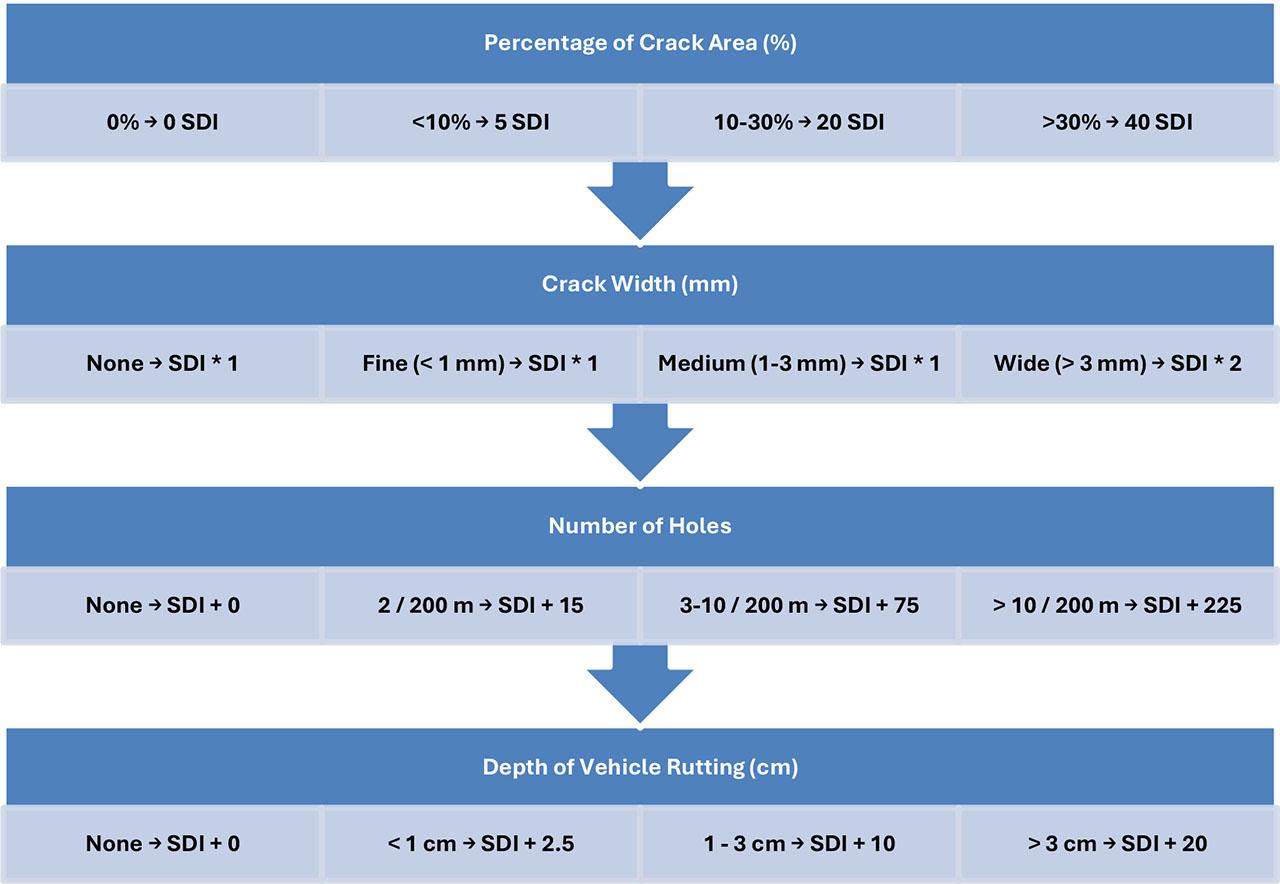
Assessment of the percentage of crack area, crack width, number of holes, and vehicle rutting (Isradiet al., 2021; Paikun et al., 2021; Setiadji & Purwanto, 2019).
This study employs quantitative approaches and relies on primary data collected through surveys and on-site observations on the chosen route, a total length of 5 km that has been divided into 25 segments, each measuring 200 m. Field survey teams can observe and record surface distress types, severity levels, and damage area, or extent, over a 200-meter practical length. Often, this resolution is adequate to detect differences in pavement conditions. Additionally, to facilitate integration, many pavement evaluation systems and local highway authorities use fixed-length segments that typically range from 100 to 250 meters. The assessment was conducted for both directions rather than for every road. Separate evaluation may not be required in low-volume routes or small urban streets if the conditions in both directions are almost the same.
The type of road damage is identified in each section, and the SDI approach is used to classify it and determine how to address it. Four parameters make up the SDI visual inspection: the depth of vehicle ruts, number of holes, crack width, and overall area of cracks. To determine the percentage of the entire defective region, it was essential to first distinguish the major and minor defects after the distress was recorded on the survey sheet. The field data was subsequently utilized for further analysis and pavement scoring while taking SDI into account. After these parameters are examined, the findings are computed using the Bina Marga assessment standard, yielding an SDI value. The four elements are added together based on the pavement damage to determine the SDI value. The stages of this research are briefly presented in Figure 3.
Compared to other pavement evaluation methods, the SDI has several advantages. Because of its field applicability, cost-effectiveness, and relative simplicity, it is especially well-suited for quick network-level inspections, particularly in areas with few resources. The visible surface distresses that are the focus of SDI can be effectively gathered by automated or visual surveys without the need for specific equipment. Its scoring system makes it simple to categorize conditions and rank maintenance requirements (Shrestha & Khadka, 2021).
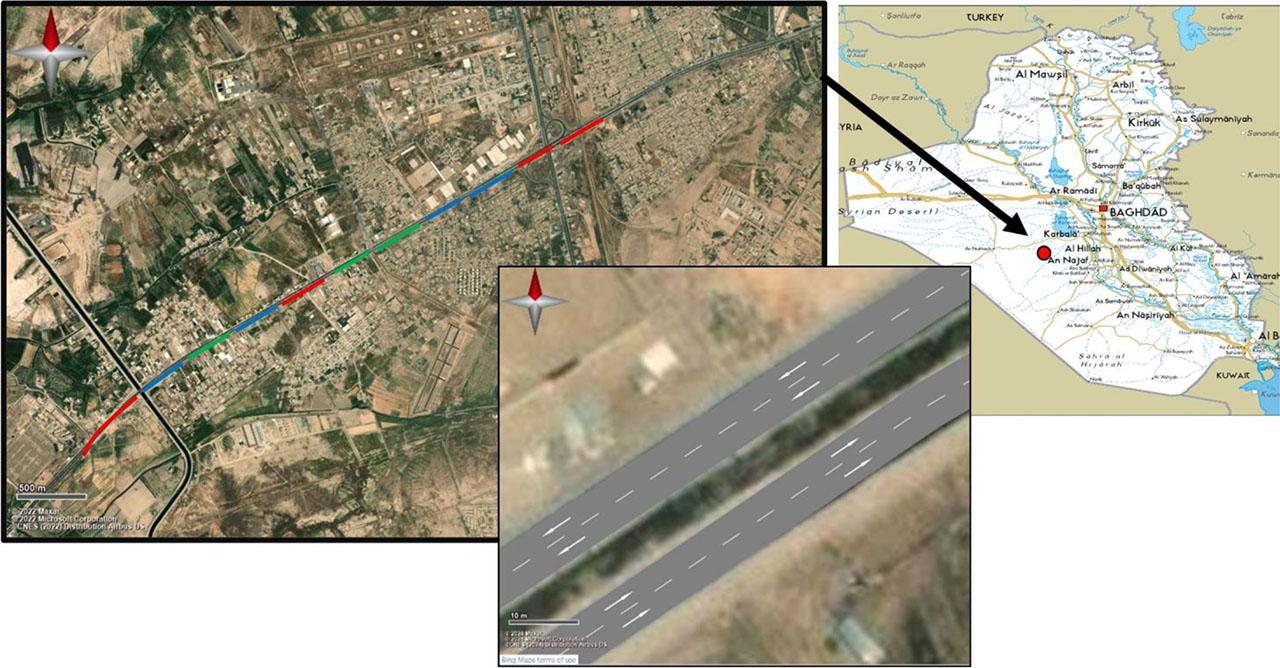
Location and carriageway details for the study area.
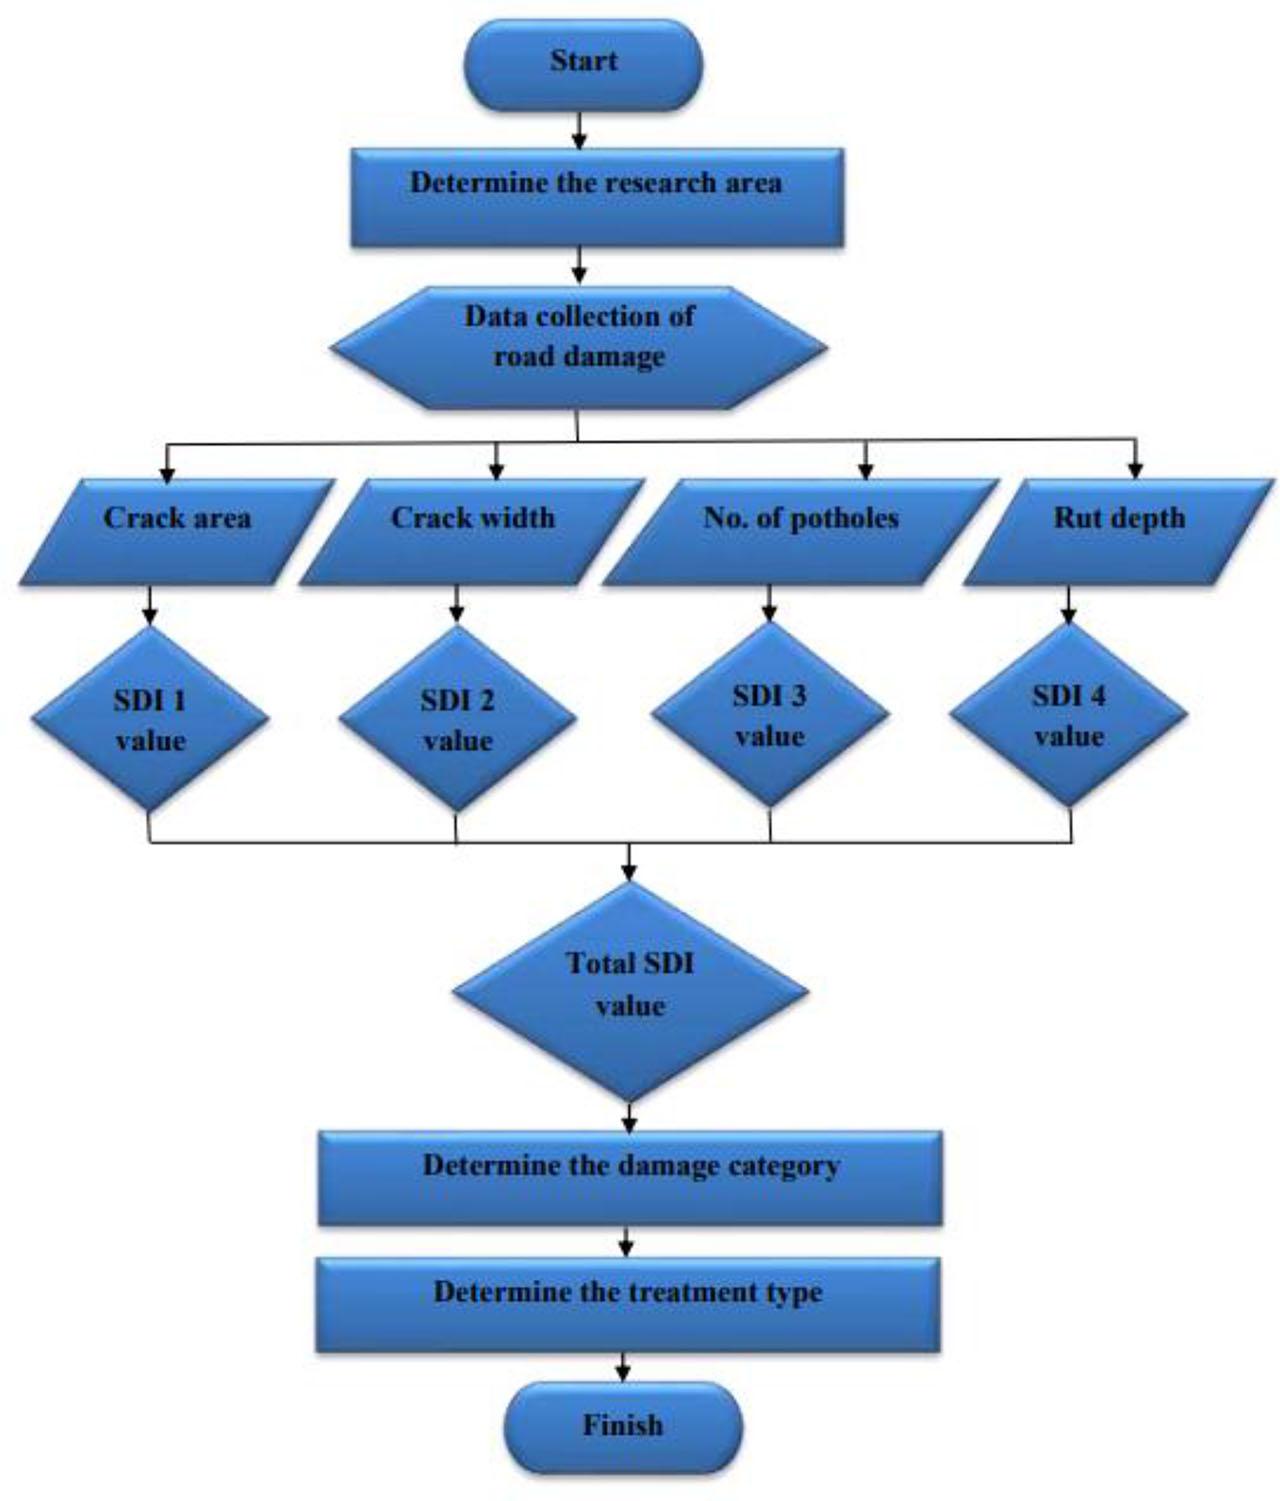
Research flow chart.
However, SDI has its limitations as well. SDI might not be as thorough or complete in identifying distress as the PCI, which uses defined methods to classify severity and contains more specific distress kinds. Furthermore, unlike mechanical techniques like the Falling Weight Deflectometer (FWD), SDI does not measure structural capacity or subsurface conditions. Additionally, it does not quantify ride quality or rider comfort, unlike the International Roughness Index (IRI) (Al-Neami et al., 2018). The SDI is nonetheless a useful tool for initial evaluations and decision-making despite these drawbacks, particularly when paired with additional metrics in a multi-criteria pavement management framework.
Any pavement management system (PMS) must incorporate information about the condition of the pavement. To determine the immediate need for pavement repair and to set up for future objectives, the major goal of collecting and evaluating pavement condition data is to evaluate the state of the pavement at the time of inspection (Al-Mansour & Al-Swailem, 1999; Setiadji & Purwanto, 2019).
The number of holes, the size of the holes, the area of the cracks, the width of the cracks, and the damage to vehicle ruts are all included in the collection of information on road conditions. Figure (4) depicts descriptions of certain road situations. The cracked area, crack width, potholes, and ruts generated by vehicle wheels are all quantitative measurements of road damage based on the findings of surveys and investigations. To assess this quantitative data, the SDI approach was used.
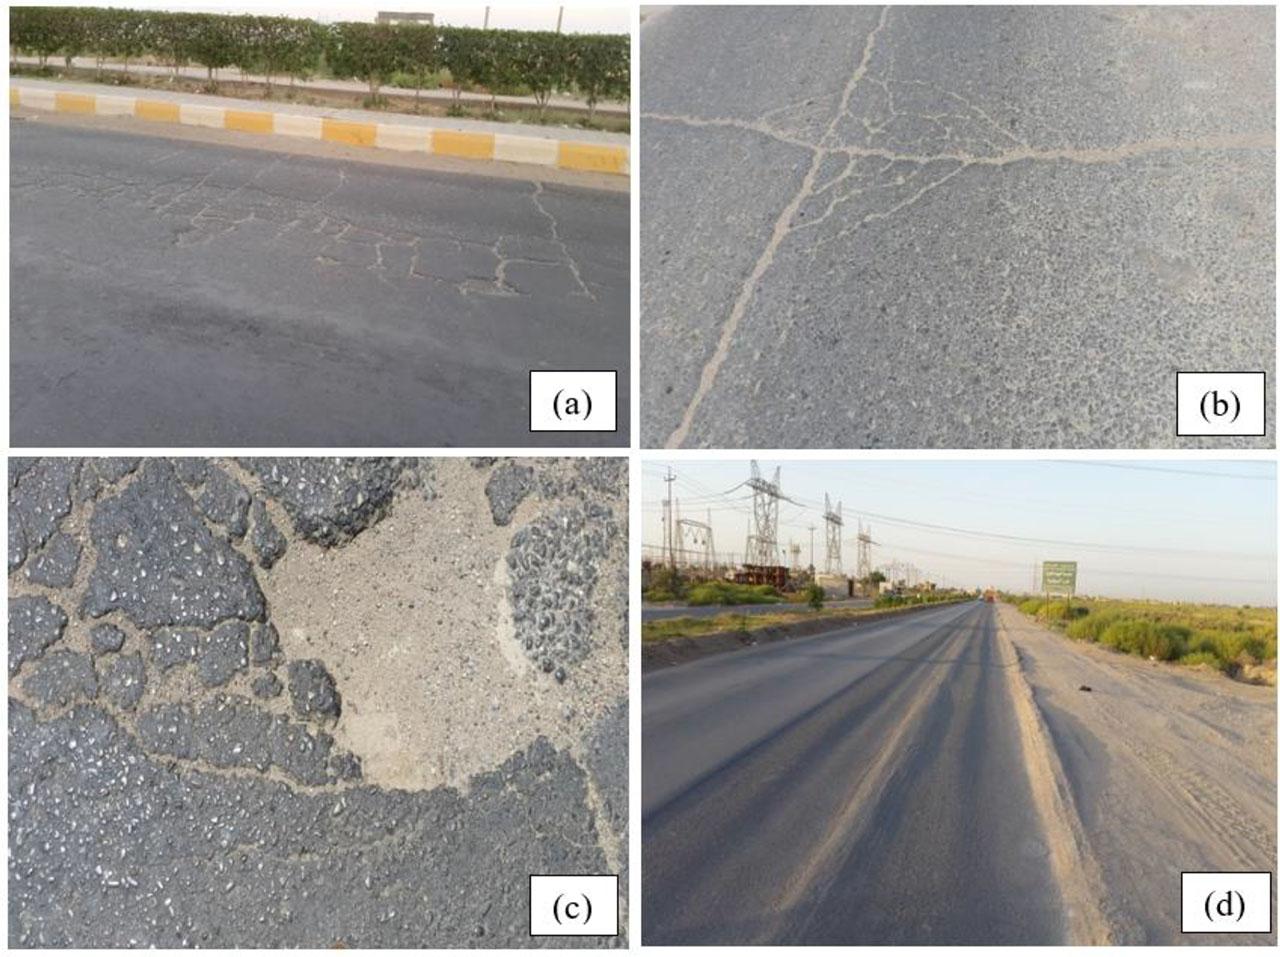
Description of Some Road Damage for the Case Study: (a) Fatigue crack, (b) Transverse crack, (c) Pothole, (d) Rutting.
Finding the road area for each segment is the first stage in the SDI technique data analysis. The length of the road in each segment has been calculated to be 200 m. Since the road width varies depending on the section, an average of 10 m was used to calculate the area of each segment. The road crack length is then multiplied by the road crack width divided by the segment area to calculate the percentage of the cracked area for each segment. Table 2 displays the damage information that was obtained for an examined 25 segments.
Road damage data for each segment.
| Segment No. | Crack area [%] | Crack width [mm] | No. of potholes [per 200 meters] | Rut depth [mm] |
|---|---|---|---|---|
| 1 | 21.25 | 4 | 15 | 4 |
| 2 | 17.22 | 3 | 12 | 3.5 |
| 3 | 5.80 | 2 | 3 | 3.5 |
| 4 | 27.30 | 3 | 11 | 5.5 |
| 5 | 8.00 | 1 | 12 | 3.5 |
| 6 | 9.80 | 2 | 5 | 1 |
| 7 | 8.13 | 2 | 7 | 0.5 |
| 8 | 11.55 | 2 | 9 | 1 |
| 9 | 20.24 | 3 | 11 | 1 |
| 10 | 6.00 | 1 | 3 | 0.5 |
| 11 | 3.52 | 1 | 5 | 0 |
| 12 | 8.84 | 2 | 4 | 0.5 |
| 13 | 4.90 | 2 | 6 | 0.8 |
| 14 | 1.50 | 1 | 5 | 0 |
| 15 | 2.03 | 2 | 3 | 0.3 |
| 16 | 1.95 | 2 | 4 | 3.2 |
| 17 | 3.50 | 1 | 7 | 3.5 |
| 18 | 6.72 | 2 | 3 | 4 |
| 19 | 13.00 | 3 | 5 | 3.5 |
| 20 | 3.60 | 2 | 6 | 3.5 |
| 21 | 11.20 | 3 | 4 | 4 |
| 22 | 22.80 | 4 | 11 | 5.5 |
| 23 | 31.20 | 4 | 8 | 7 |
| 24 | 17.85 | 3 | 12 | 6 |
| 25 | 20.70 | 3 | 14 | 6.5 |
The SDI value for each segment has then been determined using Figure 1 and Table 1, in which all study segments were assessed in the same manner when deciding the type of damage based on the calculated SDI value. Figure 5 illustrates the calculated SDI value for the road segments. Following that, recommendations for road maintenance can be made for each segment to determine the type of treatment based on the damage category that results. Table 3 presents the analysis of the SDI values, damage categories, and type of treatment.
Obtained Total SDI Value for Each Segment.
| Segment No. | SDI 1 (Crack area) | SDI 2 (Crack width) | SDI 3 (No. of potholes) | SDI 4 (Rut depth) | Total SDI value | Damage category | Type of treatment |
|---|---|---|---|---|---|---|---|
| 1 | 20 | 40 | 225 | 20 | 305 | Poor damage | Reconstruction |
| 2 | 20 | 20 | 225 | 20 | 285 | Poor damage | Reconstruction |
| 3 | 5 | 5 | 75 | 20 | 105 | Bad damage | Rehabilitation |
| 4 | 20 | 20 | 225 | 20 | 285 | Poor damage | Reconstruction |
| 5 | 5 | 5 | 225 | 20 | 255 | Poor damage | Reconstruction |
| 6 | 5 | 5 | 75 | 10 | 95 | Fair damage | Periodical maintenance |
| 7 | 5 | 5 | 75 | 2.5 | 87.5 | Fair damage | Periodical maintenance |
| 8 | 20 | 20 | 75 | 10 | 125 | Bad damage | Rehabilitation |
| 9 | 20 | 20 | 225 | 10 | 275 | Poor damage | Reconstruction |
| 10 | 5 | 5 | 75 | 2.5 | 87.5 | Fair damage | Periodical maintenance |
| 11 | 5 | 5 | 75 | 0 | 85 | Fair damage | Periodical maintenance |
| 12 | 5 | 5 | 75 | 2.5 | 87.5 | Fair damage | Periodical maintenance |
| 13 | 5 | 5 | 75 | 2.5 | 87.5 | Fair damage | Periodical maintenance |
| 14 | 5 | 5 | 75 | 0 | 85 | Fair damage | Periodical maintenance |
| 15 | 5 | 5 | 75 | 2.5 | 87.5 | Fair damage | Periodical maintenance |
| 16 | 5 | 5 | 75 | 20 | 105 | Bad damage | Rehabilitation |
| 17 | 5 | 5 | 75 | 20 | 105 | Bad damage | Rehabilitation |
| 18 | 5 | 5 | 75 | 20 | 105 | Bad damage | Rehabilitation |
| 19 | 20 | 20 | 75 | 20 | 135 | Bad damage | Rehabilitation |
| 20 | 5 | 5 | 75 | 20 | 105 | Bad damage | Rehabilitation |
| 21 | 20 | 20 | 75 | 20 | 135 | Bad damage | Rehabilitation |
| 22 | 20 | 40 | 225 | 20 | 305 | Poor damage | Reconstruction |
| 23 | 40 | 80 | 75 | 20 | 215 | Poor damage | Reconstruction |
| 24 | 20 | 20 | 225 | 20 | 285 | Poor damage | Reconstruction |
| 25 | 20 | 20 | 225 | 20 | 285 | Poor damage | Reconstruction |
The damage caused by potholes and rutting accounts for 36% of the selected roads (9 segments) are in poor condition (SDI value >150), according to the SDI ranges given in Table 1. Additionally, 8 segment parts (or 32% of the chosen road) are in bad condition, while only 8 segment parts have moderate damage. Moreover, there is no section in good condition (SDI <50). To avoid overlapping, SDI values are assigned to the highest category (worse case) within their defined range. For example, an SDI of 100 is categorized as “Bad”. As shown in Table (3), policymakers and managers can use the ideas and recommendations for road damage treatment based on the SDI technique as a basis for decision-making to implement adequate and effective road handling and estimate the necessary budget. In total, 36% of the roads need reconstruction, 32% needs rehabilitation, and 32% need normal and periodic maintenance. Figure 6 serves as a guide for gathering research data for each segment, making it easier to explain how the results of the SDI study should be interpreted, and identifying areas where the condition of the road needs maintenance, rehabilitation, and reconstruction.
The Obtained SDI Values for the Road Segments.
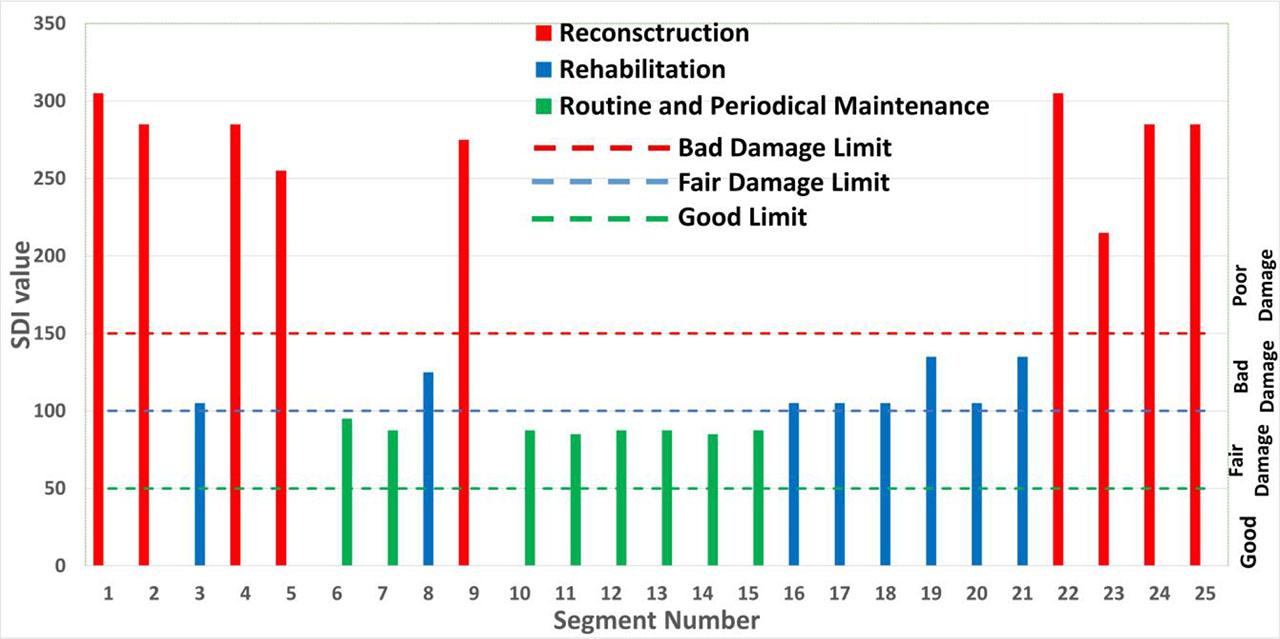
The obtained damage category and treatment type for the road segments.
This study applied the Surface Distress Index (SDI) methodology to evaluate pavement conditions across 25 segments of the Al-Rabea Highway in Diwaniya City, southern Iraq. The SDI framework enabled a systematic assessment of surface damage, categorizing each segment based on the severity and extent of visible distresses. A total of 5 km of roadway was analyzed, with pavement conditions classified into three categories: poor, bad, and fair.
Quantitative analysis revealed that 36% of the surveyed segments (9 out of 25) were in poor condition (SDI value >150) corresponding to SDI ranges, exhibiting severe distresses such as potholes and rutting that necessitate full reconstruction. An additional 32% (8 segments) were in bad condition (SDI value 100–150) and required structural rehabilitation. The remaining 32% of segments were rated as fair (SDI value 50–100), indicating moderate deterioration suitable for routine or periodic maintenance. While there is no segment in good condition (SDI <50).
While the findings are specific to the Al-Rabea Highway, the methodology is generalizable and can be applied to other urban or interurban road networks with similar climatic and traffic conditions. From a policy standpoint, the results offer data-driven guidance for prioritizing maintenance interventions, optimizing resource allocation, and improving long-term pavement performance in infrastructure planning at the municipal and regional levels. The scientific contribution of this research lies in the standardized integration of SDI scoring with empirical field data, enabling a more objective, data-driven classification of pavement condition. This approach enhances the precision of distress diagnosis and supports more defensible infrastructure decisions.
Road policymakers and managers can utilize the data gathering, analysis, and strategies conducted in this research as a basis for decision-making when it comes to road treatment as it helps to ensure that limited resources are used efficiently and that repairs address the most urgent and impactful needs first. This ensures that the most critical repairs, those that impact safety, traffic flow, or economic activity, are addressed first, while less urgent maintenance is scheduled as funding becomes available.