
Figure 1.
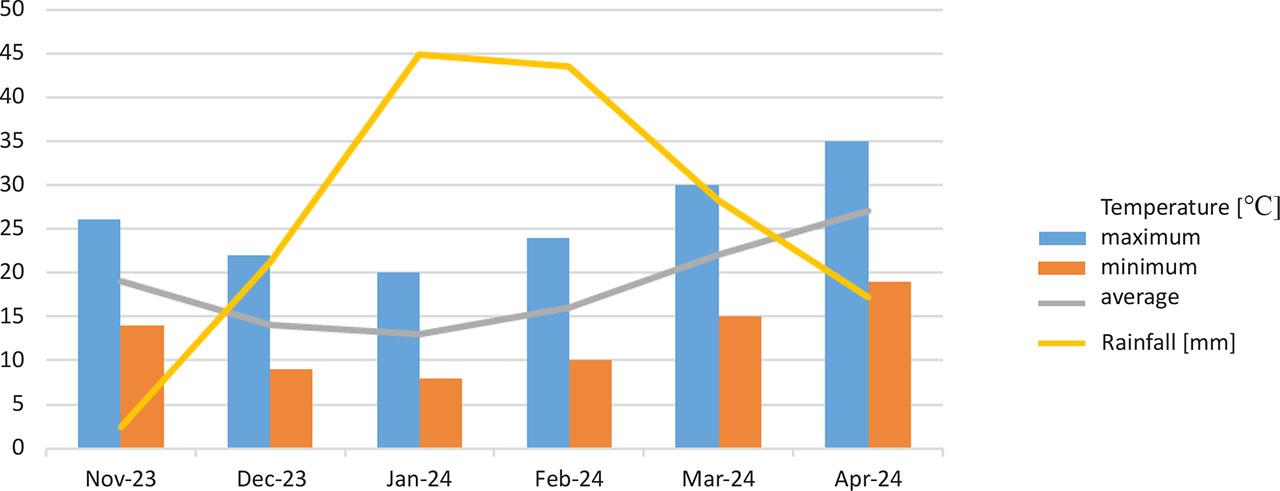
Figure 2.
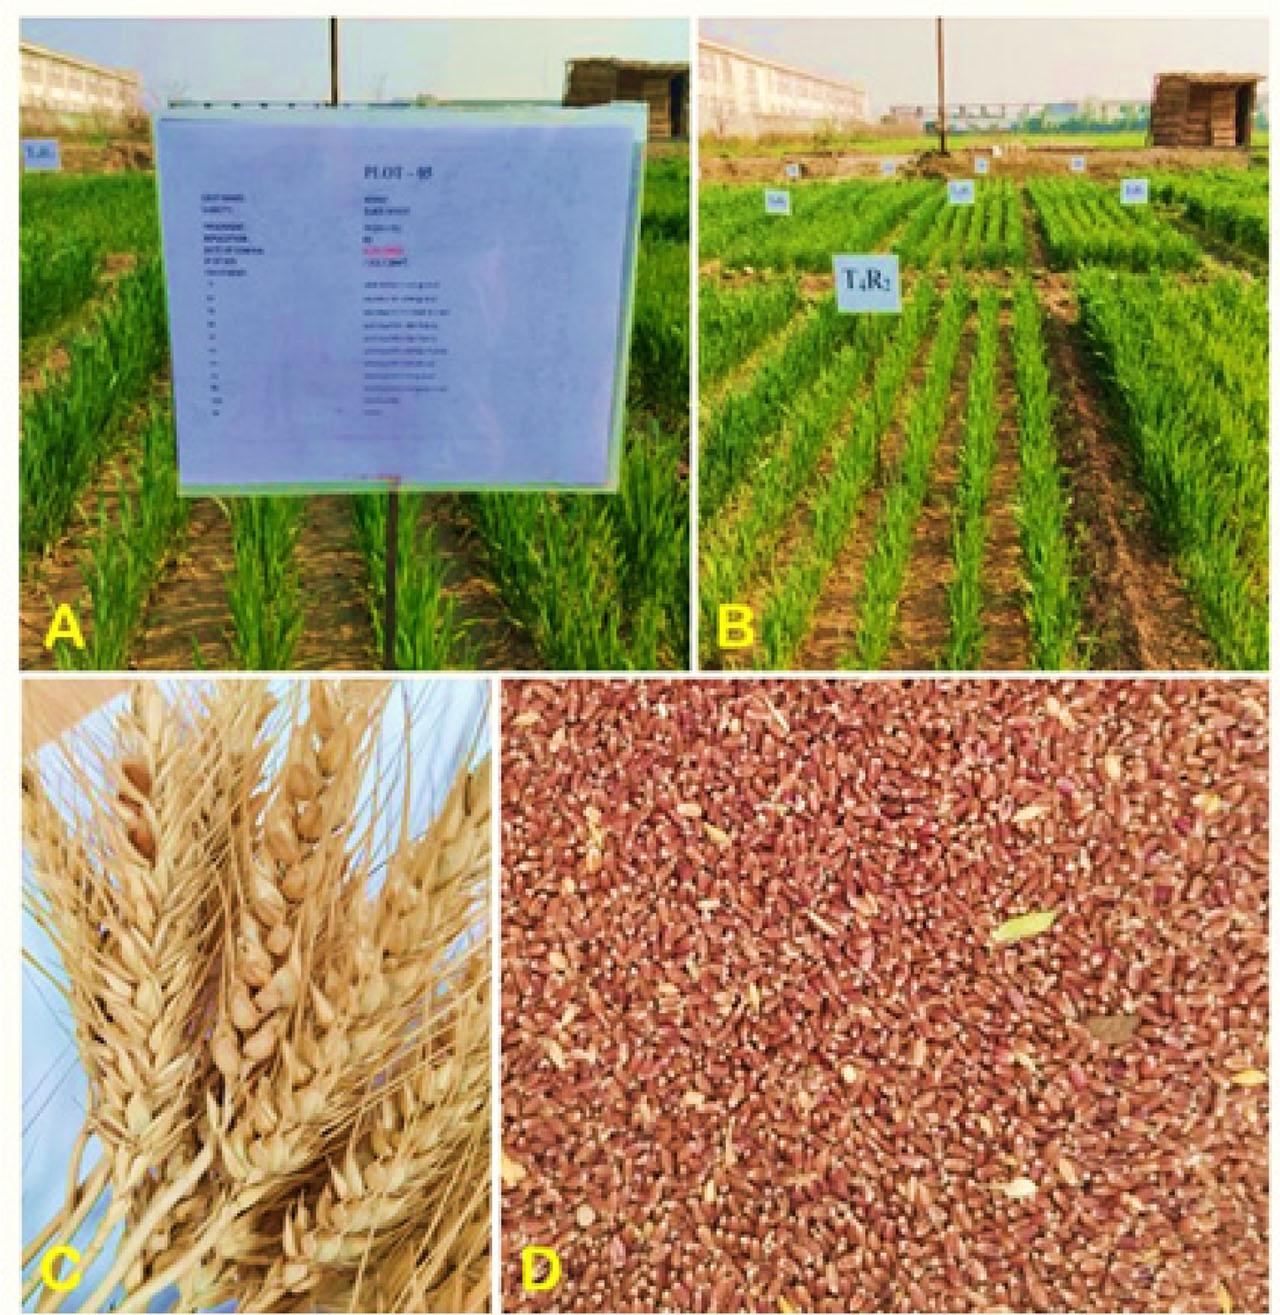
Figure 3.
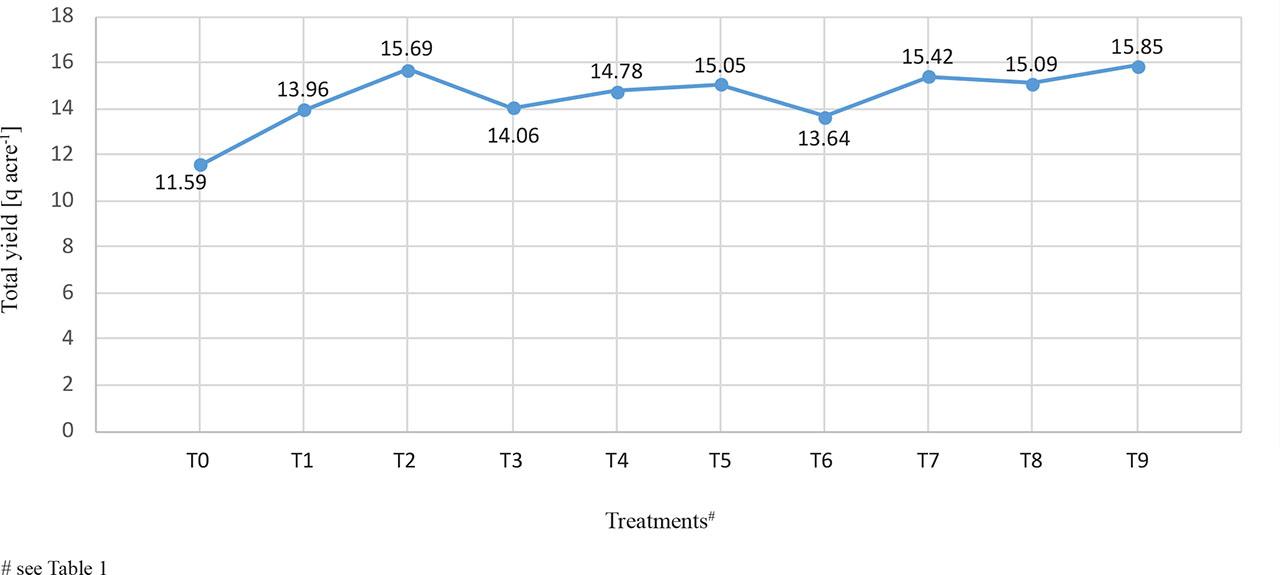
Figure 4.
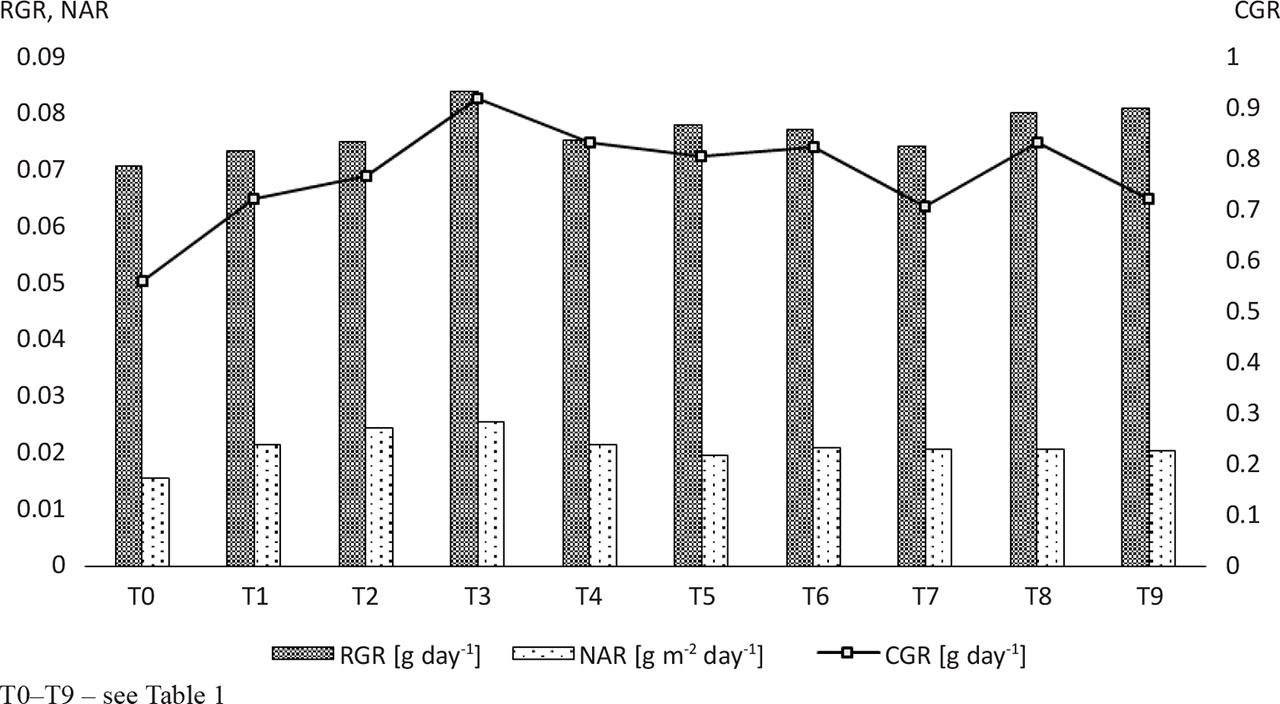
Figure 5.
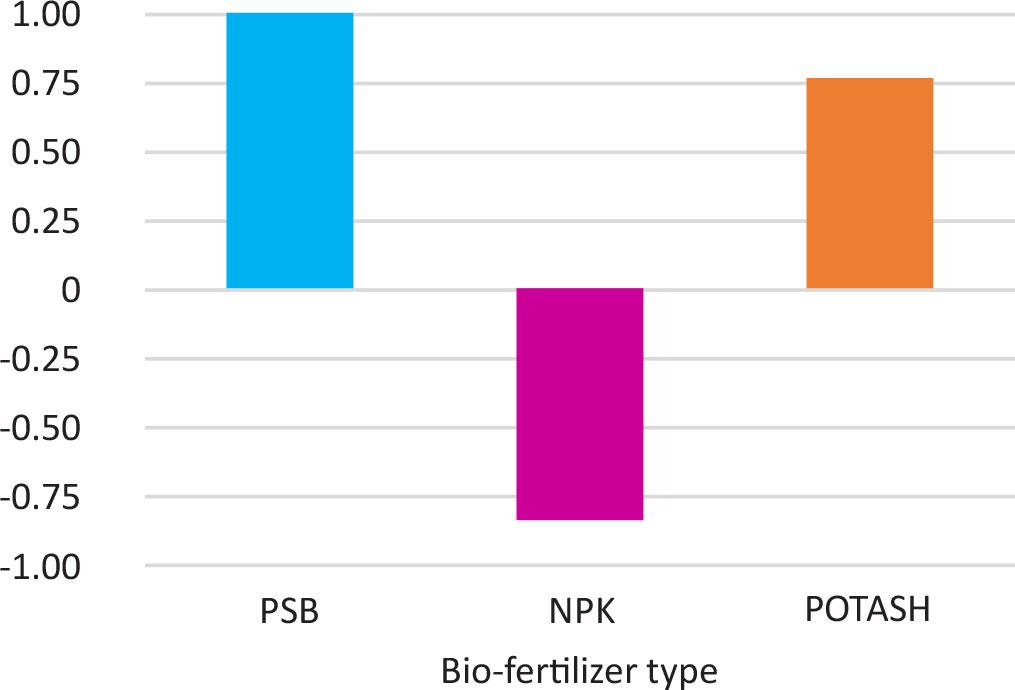
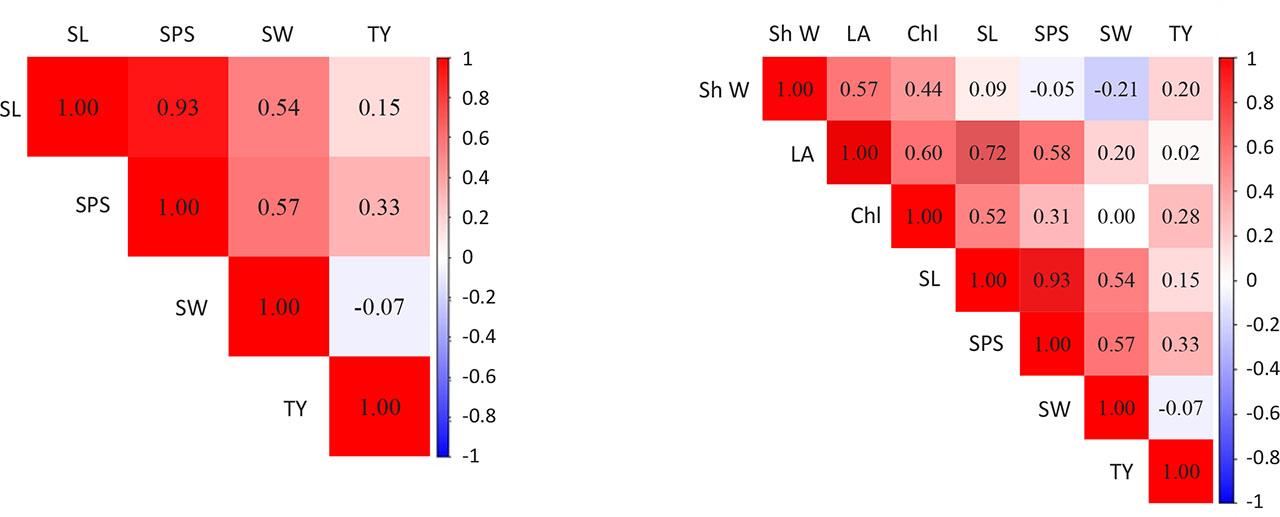
Figure 6.
Physicochemical properties of the field soil samples_
| Physicals elements | Results (Value in range) |
|---|---|
| pH | 7.83 ±0.06 |
| EC [dS m−1] | 0.19 ±0.03 |
| Organic Carbon [%w] | 0.23 ±0.00 |
| Organic Matter [%w] | 0.39 ±0.01 |
| Nitrogen [kg ha−1] | 145.93 ±4.75 |
| Phosphorus (P2O5) [kg ha−1] | 14.84 ±6.21 |
| Potassium (K2O) [kg ha−1] | 55.18 ±8.46 |
| Sulfur [ppm] | 4.51 ±0.98 |
| Zn [ppm] | 0.81 ±0.13 |
| Iron [ppm] | 9.17 ±5.92 |
| Mn [ppm] | 1.13 ±0.11 |
| Cu [ppm] | 0.69 ±0.12 |
Different treatments used during the present study_
| Treatment no. | Treatments Details |
|---|---|
| T0 | Control (No Fertilizers) |
| T1 | Jaivik Khad (100%) + PSB (2 ml l−1) |
| T2 | Jaivik Khad (100%) + NPK (2 ml l−1) |
| T3 | Jaivik Khad (100%) + POTASH (2 ml l−1) |
| T4 | Jaivik Khad (100%) + PSB (3 ml l−1) |
| T5 | Jaivik Khad (100%) + NPK (3 ml l−1) |
| T6 | Jaivik Khad (100%) + POTASH (3 ml l−1) |
| T7 | Jaivik Khad (100%) + PSB (4 ml l−1) |
| T8 | Jaivik Khad (100%) + NPK (4 ml l−1) |
| T9 | Jaivik Khad (100%) + POTASH (4 ml l−1) |
Growth and development parameters of black wheat under different treatment conditions after 60 days of sowing (DAS)_
| Treatments# | Shoot biomass (g) | Root biomass [g] | Plant length [cm] | Leaf area [cm2] | Chlorophyll | No. of tillers | |
|---|---|---|---|---|---|---|---|
| Shoot | Root | ||||||
| T0 | 6.274 ±0.493 | 1.071 ±0.649 | 72.444 ±4.194 | 12.556 ±1.347 | 41.380 ±8.364 | 45.889 ±2.329 | 3.778 ±0.509 |
| T1 | 9.544 ±2.011 | 1.349 ±0.494 | 77.444 ±2.795 | 13.333 ±0.882 | 47.823 ±3.766 | 47.778 ±8.688 | 4.000 ±0.882 |
| T2 | 10.292 ±1.348 | 1.209 ±0.046 | 81.556 ±4.914 | 13.778 ±1.347 | 49.747 ±2.222 | 52.489 ±5.709 | 4.333 ±0.667 |
| T3 | 11.713 ±2.434 | 1.792 ±0.193 | 78.000 ±5.044 | 13.778 ±1.072 | 53.533 ±2.890 | 49.911 ±4.002 | 5.333 ±0.667 |
| T4 | 10.388 ±4.068 | 1.539 ±0.579 | 77.000 ±6.083 | 14.222 ±0.192 | 54.620 ±9.984 | 52.878 ±2.260 | 4.556 ±0.839 |
| T5 | 9.393 ±1.292 | 1.538 ±0.211 | 75.111 ±2.502 | 14.333 ±0.882 | 52.590 ±4.485 | 53.544 ±1.291 | 4.000 ±0.577 |
| T6 | 9.938 ±1.408 | 1.332 ±0.116 | 76.333 ±3.786 | 13.000 ±0.667 | 55.223 ±10.149 | 52.144 ±3.866 | 4.111 ±0.192 |
| T7 | 9.558 ±0.450 | 1.427 ±0.094 | 73.333 ±2.848 | 14.444 ±1.388 | 50.687 ±3.728 | 48.144 ±1.021 | 3.889 ±0.192 |
| T8 | 9.938 ±1.408 | 1.332 ±0.116 | 76.333 ±3.786 | 13.000 ±0.667 | 55.223 ±10.149 | 52.144 ±3.866 | 4.111 ±0.192 |
| T9 | 9.558 ±0.450 | 1.427 ±0.094 | 73.333 ±2.848 | 14.444 ±1.388 | 50.687 ±3.728 | 48.144 ±1.021 | 3.889 ±0.192 |
Yield parameters of black wheat in response to different treatment conditions after 120 days of sowing (DAS)_
| Treatments# | Spike length [cm] | No. of seeds per spike | 100 seeds weight [g] | Total yield per plot [g] |
|---|---|---|---|---|
| T0 | 7.433 ±0.581 | 40.889 ±7.198 | 4.030 ±0.056 | 2290.333 ±341.951 |
| T1 | 8.533 ±0.186 | 51.444 ±2.835 | 4.810 ±0.156 | 2759.000 ±169.608 |
| T2 | 8.467 ±0.578 | 46.667 ±3.844 | 4.320 ±0.139 | 3102.333 ±267.562 |
| T3 | 8.556 ±0.353 | 49.778 ±2.269 | 4.540 ±0.408 | 2779.333 ±179.737 |
| T4 | 8.989 ±0.510 | 51.667 ±6.110 | 4.240 ±0.056 | 2922.333 ±145.225 |
| T5 | 9.356 ±0.521 | 55.444 ±1.262 | 4.773 ±0.246 | 2975.000 ±333.078 |
| T6 | 9.433 ±0.481 | 56.667 ±6.506 | 4.880 ±0.445 | 2697.000 ±158.357 |
| T7 | 8.656 ±1.006 | 51.667 ±7.506 | 4.560 ±0.164 | 3048.667 ±241.504 |
| T8 | 8.833 ±0.549 | 53.333 ±5.925 | 4.340 ±0.295 | 2983.667 ±258.411 |
| T9 | 9.067 ±0.176 | 57.000 ±7.550 | 4.557 ±0.564 | 3132.333 ±303.846 |