
Figure 1.
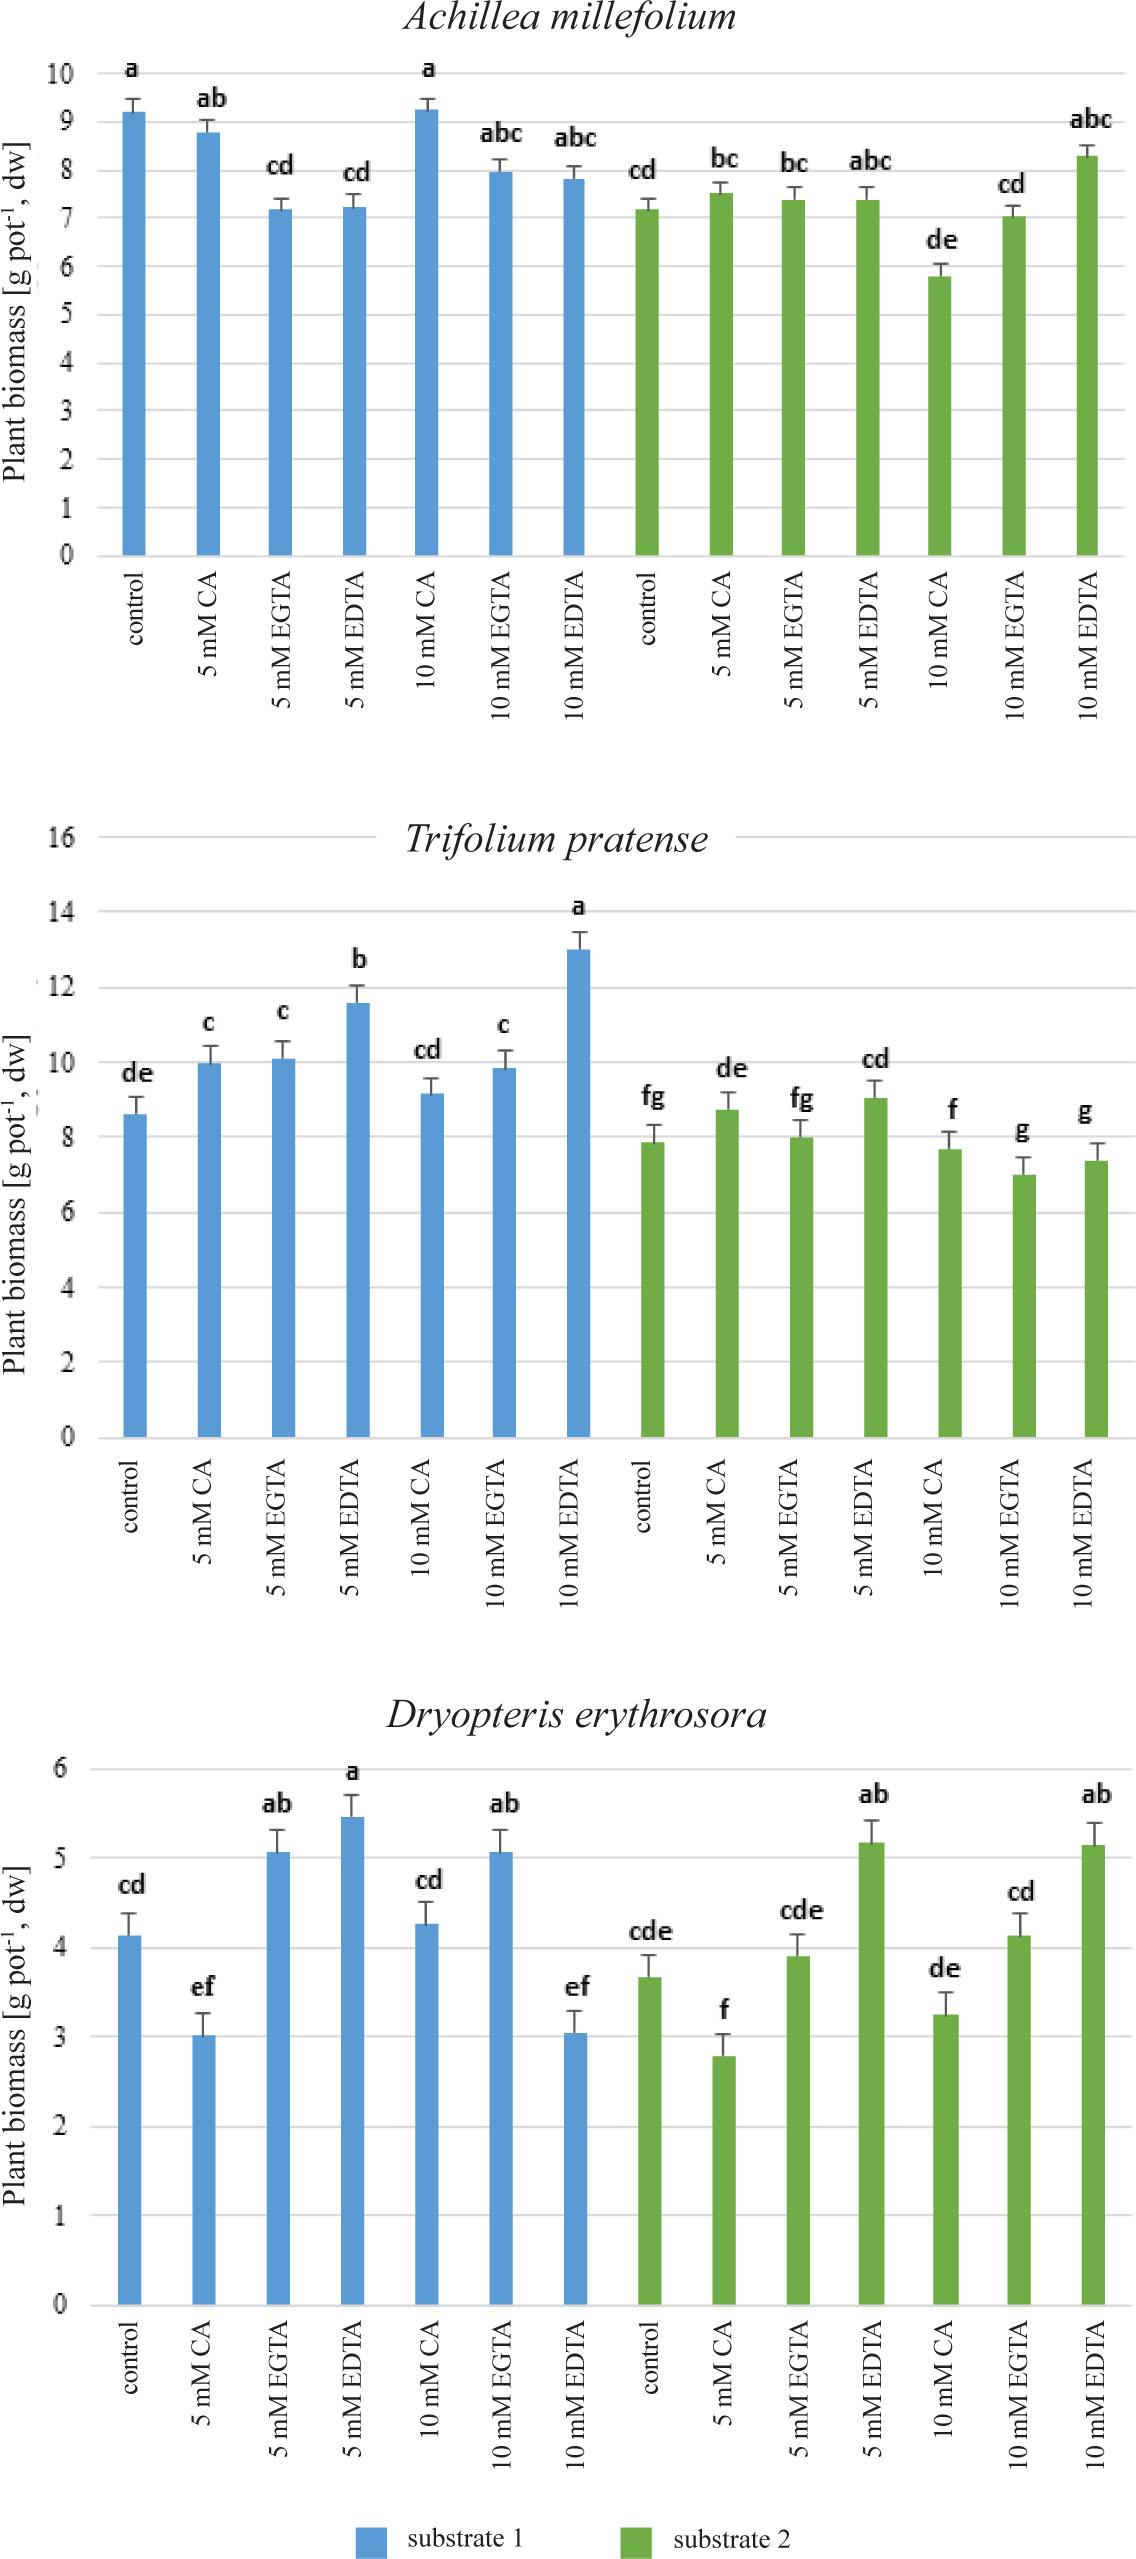
Figure 2.
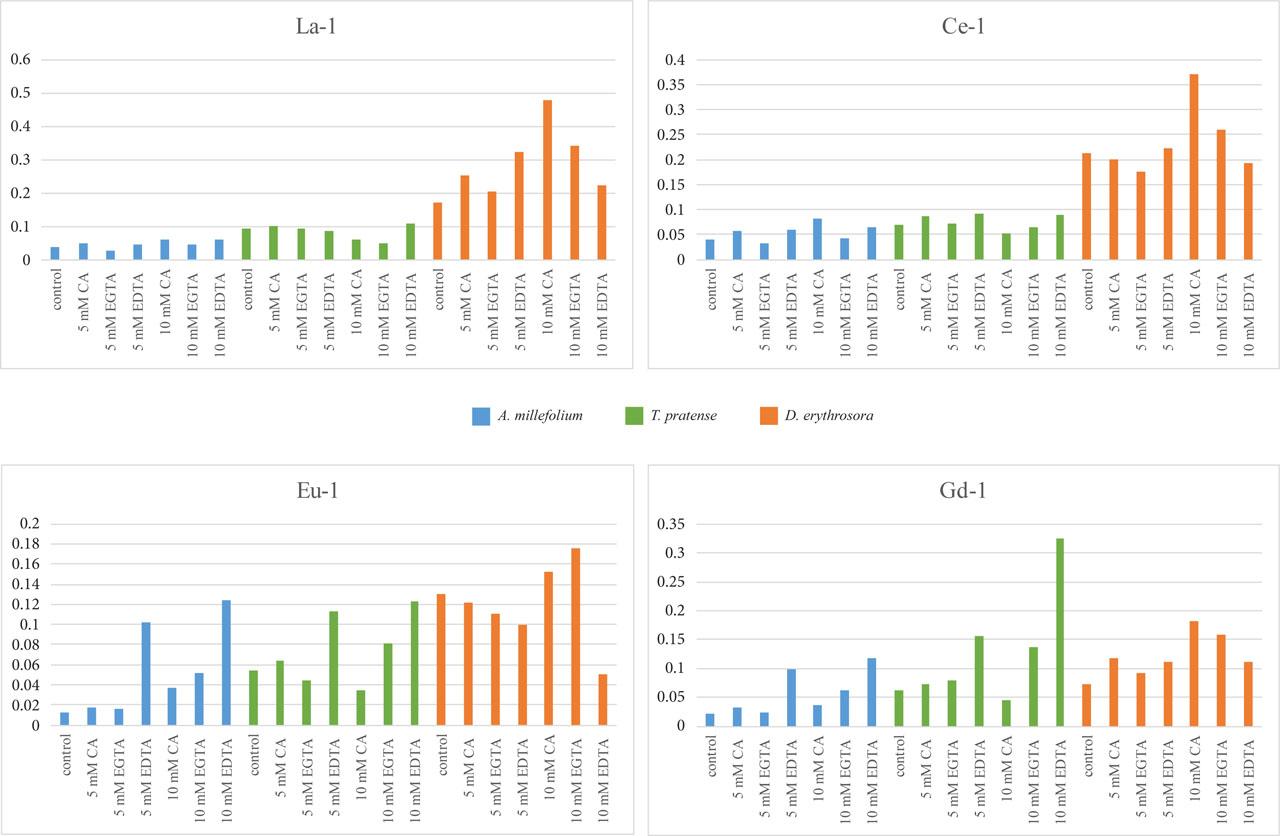
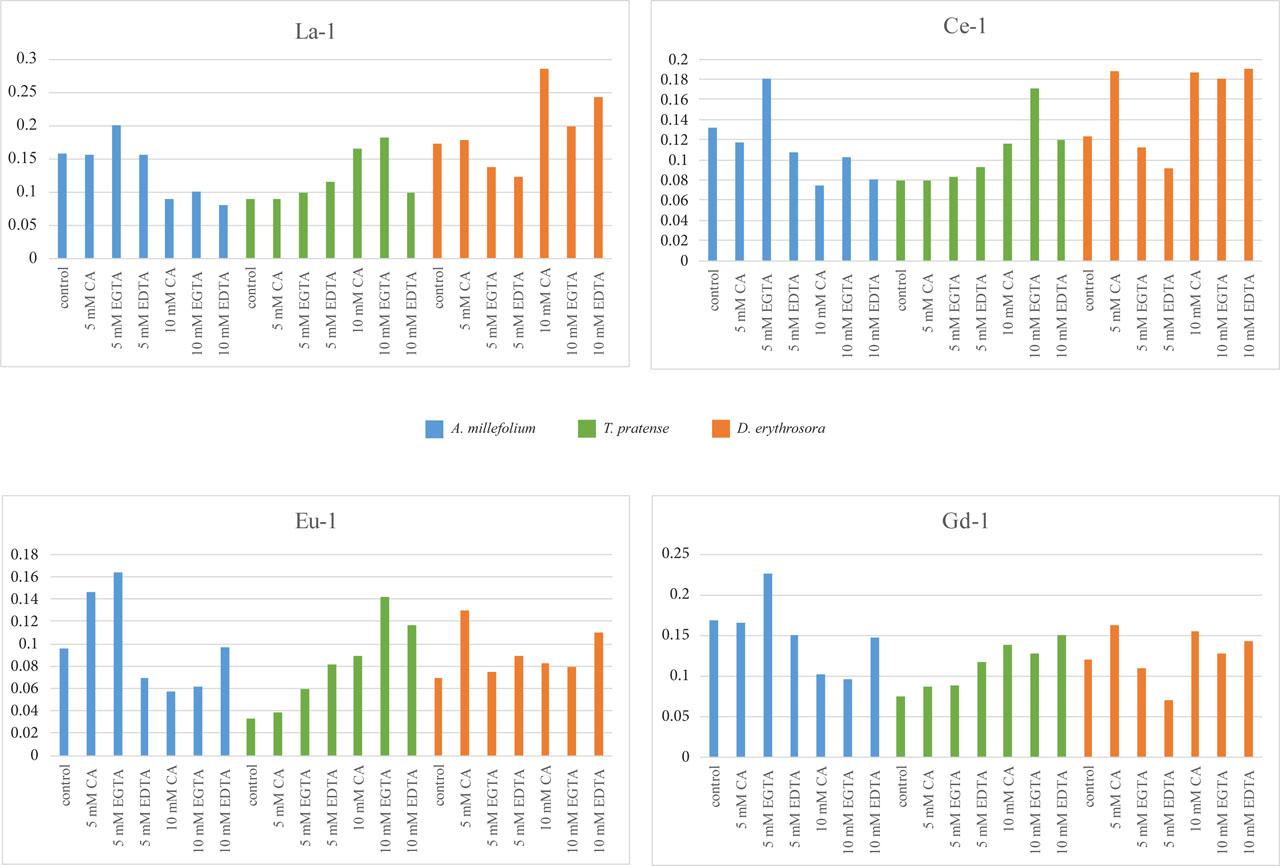
Figure 3.
Values of pH of the substrates used in the experiment after the plant harvest (pH in H2O, mean± SD, n=3) in substrate 2 (30% ash from a power plant, 20% compost, 50% peat)_
| Chelate | Achillea millefolium | Trifolium pratense | Dryopteris erythrosora |
|---|---|---|---|
| Control | 7.3 ± 0.19 | 7.4 ±0.02 | 7.4 ± 0.03 |
| 5 mM CA | 7.3 ± 0.08 | 7.3 ± 0.04 | 7.4 ± 0.06 |
| 5 mM EGTA | 7.5 ± 0.196 | 7.4 ± 0.04 | 7.6 ± 0.04 |
| 5 mM EDTA | 7.3 ± 0.06 | 7.3 ± 0.06 | 7.4 ± 0.13 |
| 10 mM CA | 7.2 ± 0.02 | 7.3 ± 0.06 | 7.3 ± 0.04 |
| 10 mM EGTA | 7.3 ± 0.03 | 7.3 ± 0.03 | 7.3 ± 0.08 |
| 10 mM EDTA | 7.4 ± 0.04 | 7.3 ± 0.18 | 7.3 ± 0.10 |
Contents of the tested REE: La, Ce, Eu and Gd [mg kg−1] in the substrates used in the experiment_
| Substrate | La | Ce | Eu | Gd |
|---|---|---|---|---|
| 1 | 103.55 | 107.52 | 90.01 | 100.54 |
| 95% soil, 5% compost | ||||
| 2 | 3.21 | 6.35 | 0.21 | 0.68 |
| 30% ash, 20% compost, 50% peat |
Concentrations of La, Ce, Eu, and Gd in aboveground parts and underground parts ofDryopteris erythrosorawhen grown on two substrates (mg kg −1, mean± SD, n= 3)_ The substrates used were as follows: substrate 1 (95% soil, 5% compost), substrate 2 (30% ash from a power plant, 20% compost, 50% peat)_
| Substrate | Chelator | Aboveground parts | Underground part | ||||||
|---|---|---|---|---|---|---|---|---|---|
| La | Ce | Eu | Gd | La | Ce | Eu | Gd | ||
| 1 | Control | 8.73 ±0.09 d | 7.48 ±0.79 d | 2.61 ±0.09 b | 3.29 ±0.10 e | 51.61 ±0.41 a | 35.15 ±2.72 c | 20.15 ±1.28 b | 44.77 ±2.37 a |
| 1 | 5 mM CA | 9.67 ±1.99 c | 9.08 ±1.20 c | 3.60 ±0.10 a | 4.99 ±0.33 c | 38.36 ±1.79 b | 45.11 ±3.90 a | 29.74 ±2.09 a | 42.00 ±0.75 ab |
| 1 | 5 mM EGTA | 7.98 ±0.25 de | 5.99 ±0.21 d | 2.53 ±0.08 b | 3.42 ±0.30 e | 39.37 ±5.85 b | 34.24 ±0.44 c | 22.87 ±1.11 b | 37.36 ±1.82 b |
| 1 | 5 mM EDTA | 9.11 ±0.47 c | 6.02 ±0.28 d | 3.00 ±0.64 ab | 2.82 ±0.03 f | 28.35 ±6.006 c | 27.00 ±5.23 d | 30.30 ±1.46 a | 25.40 ±2.11 c |
| 1 | 10 mM CA | 23.54 ±2.61 a | 15.24 ±2.86 a | 3.24 ±0.36 ab | 7.71 ±0.98 a | 49.15 ±1.64 a | 40.98 ±1.83 b | 21.28 ±0.55 b | 42.40 ±2.99 a |
| 1 | 10 mM EGTA | 14.66 ±0.19 b | 12.30 ±0.26 b | 3.57 ±0.14 a | 6.13 ±0.53 b | 43.04 ±1.18 b | 47.33 ±1.00 a | 20.40 ±3.17 b | 38.99 ±0.67 b |
| 1 | 10 mM EDTA | 12.08 ±1.21 bc | 9.00 ±0.38 c | 1.47 ±0.26 c | 4.17 ±0.19 c | 54.56 ±1.67 a | 46.56 ±0.46 a | 28.94 ±4.01 a | 37.27 ±2.05 b |
| 2 | Control | 0.14 ±0.02 f | 0.22 ±0.04 e | 0.01 ±0.01 d | 0.03 ±0.01 g | 0.25 ±0.03 d | 0.47 ±0.01 e | 0.03 ±0.01 c | 0.11 ±0.03 d |
| 2 | 5 mM CA | 0.30 ±0.05 f | 0.31 ±0.04 e | 0.16 ±0.06 d | 0.18 ±0.06 g | 0.18 ±0.06 d | 0.28 ±0.01 e | 0.04 ±0.01 c | 0.07 ±0.001 d |
| 2 | 5 mM EGTA | 0.25 ±0.03 f | 0.24 ±0.04 e | 0.03 ±0.01 d | 0.09 ±0.07 g | 0.13 ±0.02 d | 0.32 ±0.01 e | 0.02 ±0.01 c | 0.05 ±0.01 d |
| 2 | 5 mM EDTA | 0.50 ±0.13 f | 0.68 ±0.10 e | 0.02 ±0.01 d | 0.04 ±0.01 g | 0.13 ±0.03 d | 0.22 ±0.02 e | 0.03 ±0.01 c | 0.03 ±0.001 d |
| 2 | 10 mM CA | 0.81 ±0.31 f | 0.94 ±0.22 e | 0.14 ±0.10 d | 0.33 ±0.04 g | 0.15 ±0.02 d | 0.32 ±0.02 e | 0.06 ±0.02 c | 0.07 ±0.01 d |
| 2 | 10 mM EGTA | 0.21 ±0.05 f | 0.39 ±0.01 e | 0.03 ±0.01 d | 0.09 ±0.01 g | 0.12 ±0.01 d | 0.30 ±0.01 e | 0.02 ±0.01 c | 0.05 ±0.01 d |
| 2 | 10 mM EDTA | 0.36 ±0.05 f | 0.55 ±0.07 e | 0.04 ±0.01 d | 0.07 ±0.02 g | 0.18 ±0.02 d | 0.36 ±0.07 e | 0.06 ±0.03 c | 0.11 ±0.03 d |
Content of elements [mg kg−1] and other chemical properties of the soil (before adding REE solutions) and the power plant ash_
| Element | Soil | Power plant ash |
|---|---|---|
| Li | 3.25 | 11.31 |
| Be | 0.19 | 0.83 |
| Al | 4967.47 | 15669.29 |
| V | 14.19 | 35.53 |
| Cr | 10.59 | 46.60 |
| Mn | 225.16 | 6313.97 |
| Fe | 7244.23 | 14030.51 |
| Co | 3.20 | 15.05 |
| Ni | 7.58 | 53.49 |
| Cu | 6.75 | 498.03 |
| Zn | 48.39 | 892.71 |
| As | 2.71 | 9.30 |
| Se | 0.19 | 1.08 |
| Sr | 1.08 | 36.12 |
| Mo | 0.24 | 3.69 |
| Ag | 0.14 | 4.77 |
| Cd | 0.24 | 11.17 |
| Sn | 0.04 | 22.68 |
| Sb | 0.04 | 16.48 |
| Ba | 31.73 | 797.73 |
| La | 8.42 | 8.90 |
| Ce | 18.52 | 18.65 |
| Eu | 0.24 | 0.54 |
| Gd | 1.47 | 1.91 |
| Tl | 0.04 | 0.39 |
| Pb | 12.91 | 117.42 |
| Bi | 0.09 | 6.29 |
| Na | 40.31 | 8769.68 |
| Mg | 941.25 | 10300.19 |
| K | 1768.18 | 18454.72 |
| Ca | 1167.80 | 130492.47 |
| pH in H2O | 7.13 | 8.55 |
| EC [µS cm−1] | 99 | 11080 |
| Total nitrogen [%N] | 0.09 | 0.12 |
| Total carbon [%C] | 1.19 | 20.60 |
Concentrations of La, Ce, Eu, and Gd in above ground parts and underground parts of Achillea millefoliumwhen grown on two substrates (mg kg−1, mean± SD, n= 3)_ The substrates used were as follows: substrate 1 (95% soil, 5% compost), substrate 2 (30% ash from a power plant, 20% compost, 50% peat)_
| Substrate | Chelator | Aboveground parts | Underground parts | ||||||
|---|---|---|---|---|---|---|---|---|---|
| La | Ce | Eu | Gd | La | Ce | Eu | Gd | ||
| 1 | Control | 1.68 ±0.24 ab | 1.46 ±0.36 b | 0.31 ±0.03 e | 0.95 ±0.26 b | 43.59 ±0.92 b | 37.40 ±0.75 b | 23.76 ±0.33 cd | 45.74 ±2.82 b |
| 1 | 5 mM CA | 1.81 ±0.15 ab | 1.67 ±0.16 b | 0.57 ±0.02 de | 1.28 ±0.12 ab | 37.78 ±5.39 cd | 29.29 ±5.76 c | 32.41 ±4.17 b | 40.15 ±2.18 bc |
| 1 | 5 mM EGTA | 1.58 ±0.26 c | 1.78 ±0.23 b | 0.67 ±0.17 cd | 1.46 ±0.19 ab | 57.63 ±0.26 a | 53.15 ±0.68 a | 41.84 ±2.65 a | 63.60 ±3.43 a |
| 1 | 5 mM EDTA | 1.81 ±0.15 ab | 1.69 ±0.09 b | 1.50 ±0.22 b | 3.50 ±0.54 a | 41.40 ±0.82 bc | 28.53 ±2.58 cd | 14.76 ±1.47 e | 35.61 ±0.85 d |
| 1 | 10 mM CA | 2.04 ±0.03 a | 2.26 ±0.36 b | 0.72 ±0.29 cd | 1.43 ±0.69 ab | 33.68 ±0.56 d | 27.23 ±2.83 cd | 19.76 ±0.08 d | 39.70 ±1.27 c |
| 1 | 10 mM EGTA | 1.71 ±0.09 ab | 1.74 ±1.06 b | 1.05 ±0.21 c | 2.12 ±0.10 a | 39.11 ±0.63 bc | 41.90 ±0.52 b | 20.53 ±0.51 cd | 34.59 ±5.09 d |
| 1 | 10 mM EDTA | 2.00 ±0.09 a | 2.82 ±1.06 a | 4.00 ±0.21 a | 3.70 ±0.10 a | 32.56 ±0.63 e | 43.16 ±0.52 b | 32.38 ±0.51 c | 31.37 ±5.09 d |
| 2 | Control | 0.04 ±0.02 d | 0.10 ±0.03 c | 0.02 ±0.01 f | 0.06 ±0.03 c | 0.36 ±0.01 f | 0.58 ±0.0352 e | 0.23 ±0.06 f | 0.40 ±0.04 e |
| 2 | 5 mM CA | 0.05 ±0.02 d | 0.11 ±0.02 c | 0.03 ±0.01 f | 0.06 ±0.01 c | 0.19 ±0.01 f | 0.12 ±0.01 e | 0.12 ±0.01 f | 0.21 ±0.01 e |
| 2 | 5 mM EGTA | 0.08 ±0.02 d | 0.15 ±0.03 c | 0.05 ±0.01 f | 0.13 ±0.03 c | 0.31 ±0.08 f | 0.18 ±0.039 e | 0.05 ±0.01 f | 0.32 ±0.34 e |
| 2 | 5 mM EDTA | 0.09 ±0.03 d | 0.13 ±0.05 c | 0.03 ±0.02 f | 0.08 ±0.05 c | 0.24 ±0.03 f | 0.14 ±0.05 e | 0.05 ±0.01 f | 0.08 ±0.01 e |
| 2 | 10 mM CA | 0.07 ±0.01 d | 0.12 ±0.02 c | 0.04 ±0.01 f | 0.06 ±0.01 c | 0.11 ±0.01 f | 0.14 ±0.01 e | 0.04 ±0.01 f | 0.08 ±0.01 e |
| 2 | 10 mM EGTA | 0.04 ±0.01 d | 0.08 ±0.01 c | 0.01 ±0.0001 f | 0.05 ±0.005 c | 0.25 ±0.02 f | 0.27 ±0.01 e | 0.07 ±0.02 f | 0.25 ±0.03 e |
| 2 | 10 mM EDTA | 0.05 ±0.01 d | 0.12 ±0.03 c | 0.02 ±0.01 f | 0.07 ±0.02 c | 0.32 ±0.03 f | 0.34 ±0.04 e | 0.17 ±0.03 f | 0.28 ±0.08 e |
Concentrations of La, Ce, Eu, and Gd in above ground parts and underground parts of Trifolium pratensewhen grown on two substrates (mg kg−1, mean± SD, n = 3)_ The substrates used were as follows: substrate 1 (95% soil, 5% compost), substrate 2 (30% ash from a power plant, 20% compost, 50% peat)_
| Substrate | Chelator | Aboveground parts | Underground part | ||||||
|---|---|---|---|---|---|---|---|---|---|
| La | Ce | Eu | Gd | La | Ce | Eu | Gd | ||
| 1 | Control | 3.98 ±0.69 a | 3.01 ±0.39 b | 0.88 ±0.16 c | 2.47 ±0.33 c | 42.12 ±1.77 b | 43.13 ±3.78 b | 16.16 ±1.37 d | 39.13 ±0.28 bc |
| 1 | 5 mM CA | 3.63 ±0.14 b | 2.96 ±0.04 c | 0.98 ±0.14 c | 2.71 ±0.18 c | 35.89 ±1.54 c | 34.18 ±1.43 c | 15.19 ±0.65 d | 37.56 ±2.00 cd |
| 1 | 5 mM EGTA | 3.47 ±0.25 b | 2.50 ±0.22 d | 1.01 ±0.17 c | 2.68 ±0.18 c | 37.45 ±0.25 bc | 35.15 ±0.68 c | 22.77 ±2.65 c | 34.07 ±3.42 de |
| 1 | 5 mM EDTA | 3.45 ±0.34 b | 3.03 ±0.23 b | 2.62 ±0.22 b | 5.28 ±0.39 b | 40.46 ±1.30 bc | 33.34 ±2.12 c | 23.11 ±0.30 c | 33.66 ±1.04 de |
| 1 | 10 mM CA | 3.56 ±0.32 b | 2.29 ±0.19 d | 1.05 ±0.12 c | 2.26 ±0.26 c | 60.20 ±2.18 a | 44.84 ±1.65 b | 30.13 ±1.05 b | 51.15 ±3.45 a |
| 1 | 10 mM EGTA | 2.88 ±0.05 c | 4.01 ±0.15 a | 3.70 ±0.18 a | 5.94 ±0.01 b | 60.16 ±4.72 a | 62.22 ±5.15 a | 45.91 ±6.40 a | 43.19 ±2.76 b |
| 1 | 10 mM EDTA | 3.55 ±0.20 b | 3.82 ±0.36 a | 3.98 ±0.70 a | 10.20 ±0.53 a | 32.56 ±0.86 c | 43.16 ±0.42 b | 32.38 ±1.57 b | 31.37 ±1.54 d |
| 2 | Control | 0.04 ±0.01 d | 0.07 ±0.01 e | 0.02 ±0.01 d | 0.05 ±0.02 d | 0.42 ±0.03 d | 0.53 ±0.02 d | 0.23 ±0.03 e | 0.39 ±0.04 e |
| 2 | 5 mM CA | 0.06 ±0.02 d | 0.09 ±0.01 e | 0.02 ±0.01 d | 0.07 ±0.03 d | 0.48 ±0.18 d | 0.29 ±0.06 d | 0.40 ±0.18 e | 0.39 ±0.06 e |
| 2 | 5 mM EGTA | 0.04 ±0.02 d | 0.10 ±0.01 e | 0.02 ±0.01 d | 0.04 ±0.01 d | 0.25 ±0.05 d | 0.34 ±0.06 d | 0.16 ±0.06 e | 0.19 ±0.05 e |
| 2 | 5 mM EDTA | 0.02 ±0.01 d | 0.05 ±0.01 e | 0.01 ±0.01 d | 0.02 ±0.01 d | 0.24 ±0.10 d | 0.14 ±0.03 d | 0.05 ±0.01 e | 0.08 ±0.02 e |
| 2 | 10 mM CA | 0.03 ±0.03 d | 0.08 ±0.05 e | 0.06 ±0.07 d | 0.04 ±0.02 d | 0.62 ±0.13 d | 0.80 ±0.13 d | 0.43 ±0.03 e | 0.78 ±0.09 e |
| 2 | 10 mM EGTA | 0.04 ±0.01 d | 0.08 ±0.01 e | 0.01 ±0.01 d | 0.03 ±0.01 d | 0.29 ±0.06 d | 0.25 ±0.01 d | 0.10 ±0.02 e | 0.30 ±0.06 e |
| 2 | 10 mM EDTA | 0.02 ±0.01 d | 0.05 ±0.02 e | 0.01 ±0.01 d | 0.03 ±0.01 d | 0.32 ±0.05 d | 0.34 ±0.01 d | 0.17 ±0.03 e | 0.28 ±0.01 e |
Values of pH of the substrates used in the experiment after the plant harvest (pH in H2O, mean± SD, n=3) in substrate 1 (95% soil, 5% compost)_
| Chelate | Achillea millefolium | Trifolium pratense | Dryopteris erythrosora |
|---|---|---|---|
| Control | 6.6 ± 0.15 | 5.9 ± 0.10 | 6.2 ± 0.20 |
| 5 mM CA | 6.2 ± 0.10 | 5.9 ± 0.05 | 5.9 ± 0.17 |
| 5 mM EGTA | 5.9 ± 0.09 | 5.6 ± 0.10 | 5.9 ± 0.16 |
| 5 mM EDTA | 6.2 ± 0.14 | 5.6 ± 0.09 | 6.1 ± 0.03 |
| 10 mM CA | 5.5 ± 0.07 | 5.6 ± 0.17 | 5.7 ± 0.17 |
| 10 mM EGTA | 5.6 ± 0.13 | 6.1 ± 0.14 | 5.7 ± 0.16 |
| 10 mM EDTA | 5.6 ± 0.44 | 5.9 ± 0.06 | 5.9 ± 0.25 |