

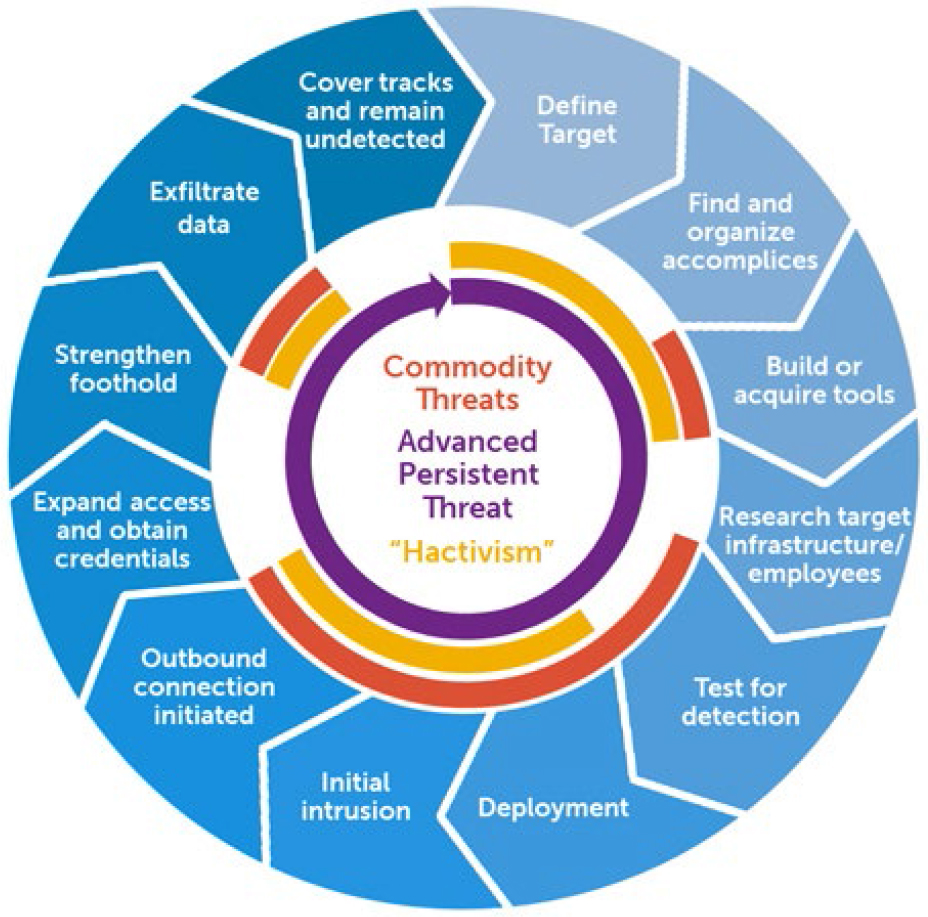
Figure no. 1
Advanced Persistent Threat Lifecycle
(Source: Adapted from Wikimedia Commons, 2024)
Table no. 1
Operational impact dimensions and associated assessment indicators
| Dimension | Description | Example Indicators | Measurement Approach |
|---|---|---|---|
| System Availability | Ability of systems to remain operational under attack | Downtime, service disruption rate | Time-based metrics |
| Data Integrity | Accuracy and consistency of operational data | Error rate, data corruption level | Statistical analysis |
| Confidentiality | Protection of sensitive information | Unauthorized access incidents | Incident frequency |
| Communication Reliability | Stability of data exchange and connectivity | Packet loss, latency | Network performance metrics |
| Decision-Making Efficiency | Ability to process information and respond effectively | Decision delay time, response latency | Operational performance analysis |
| System Interdependency | Degree of cascading effects across components | Number of affected subsystems | Dependency mapping |
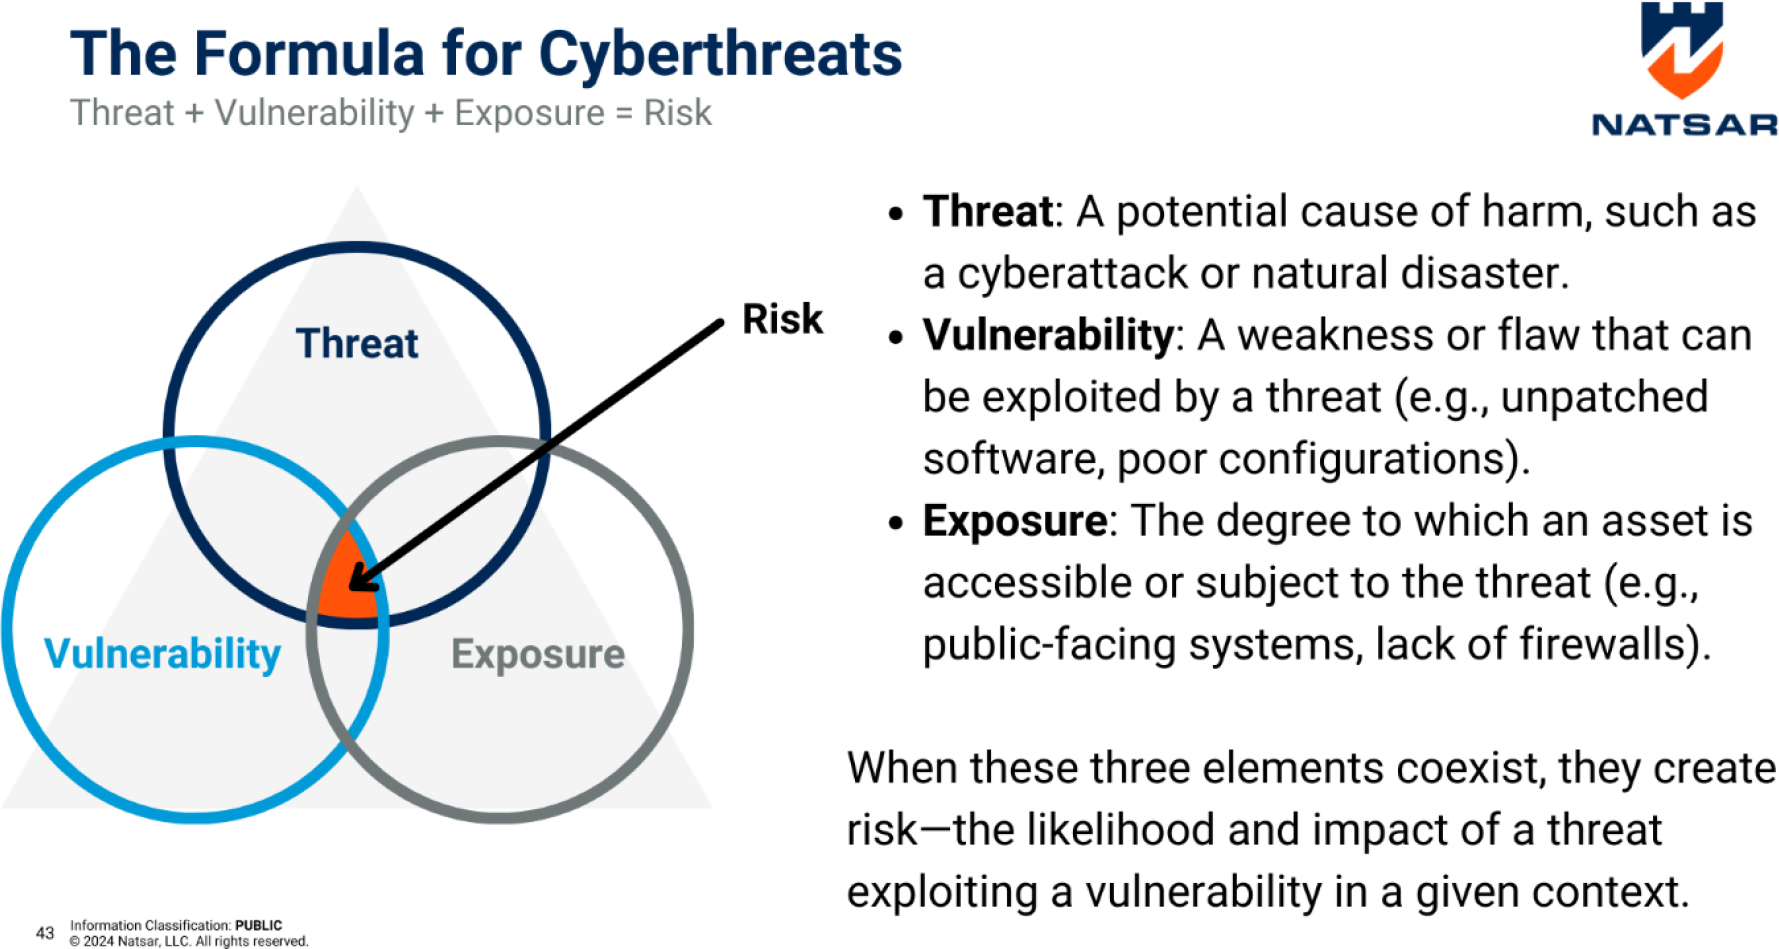
Figure no. 2
Conceptual model of cyber threat impact on operational capability
(Source: Adapted from Moulin, 2025)