

Figure no. 1:
Figure no. 2:
Figure no. 3:
Figure no. 4:
Figure no. 5:
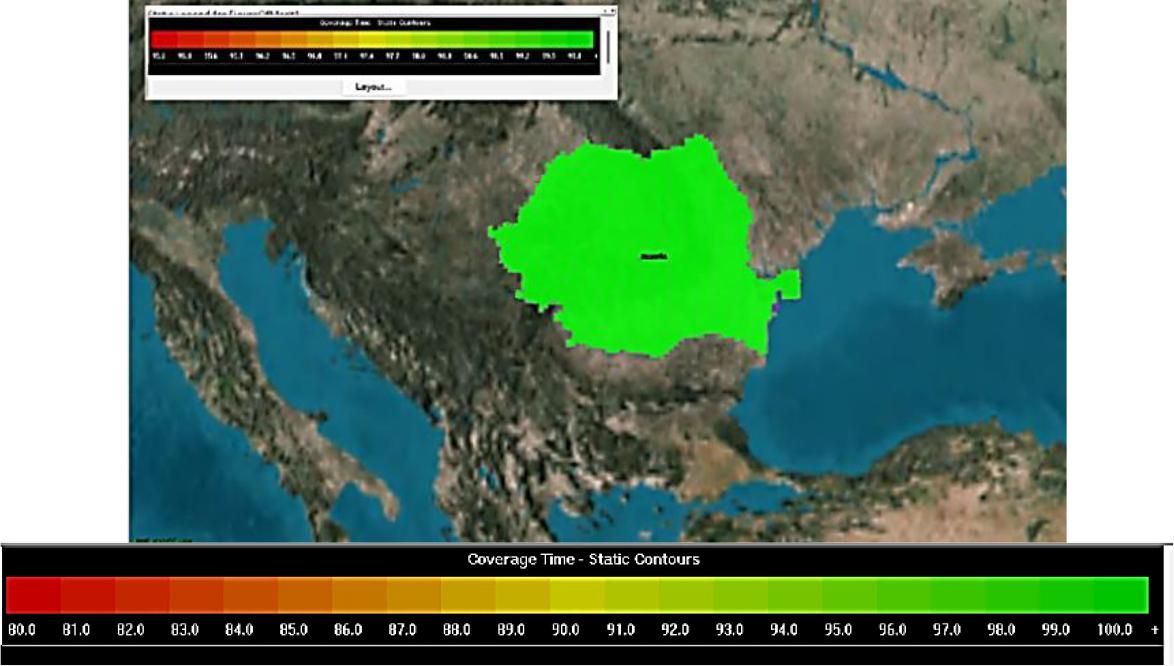
Figure no. 6:
Figure no. 7:
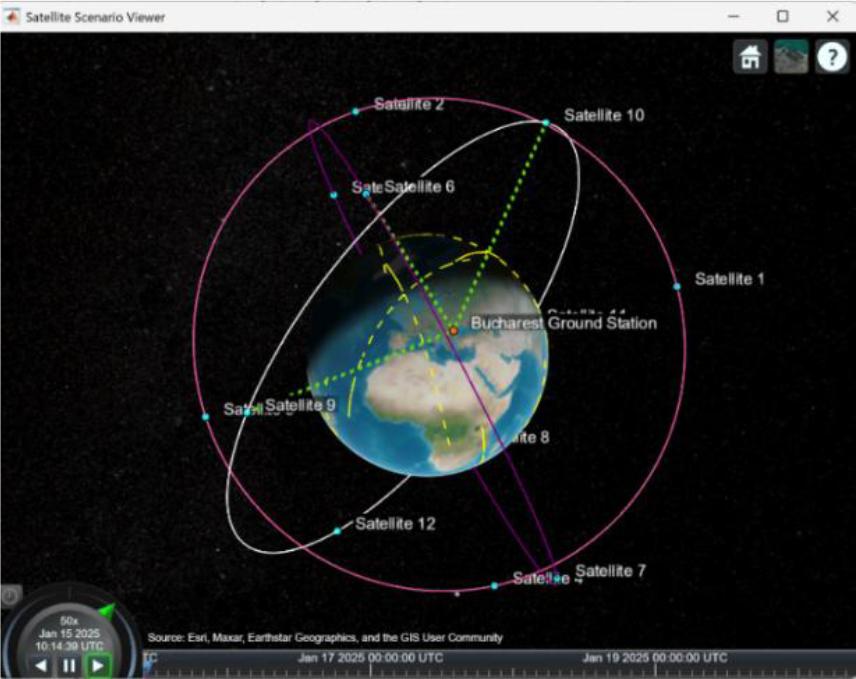
Figure no. 8:
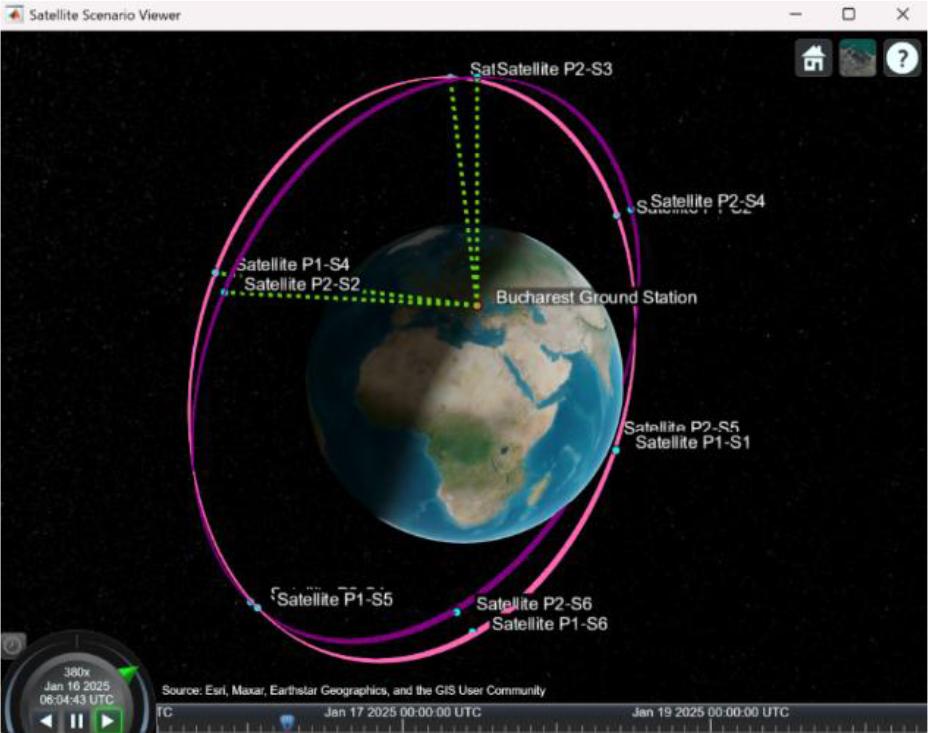
Figure no. 9:
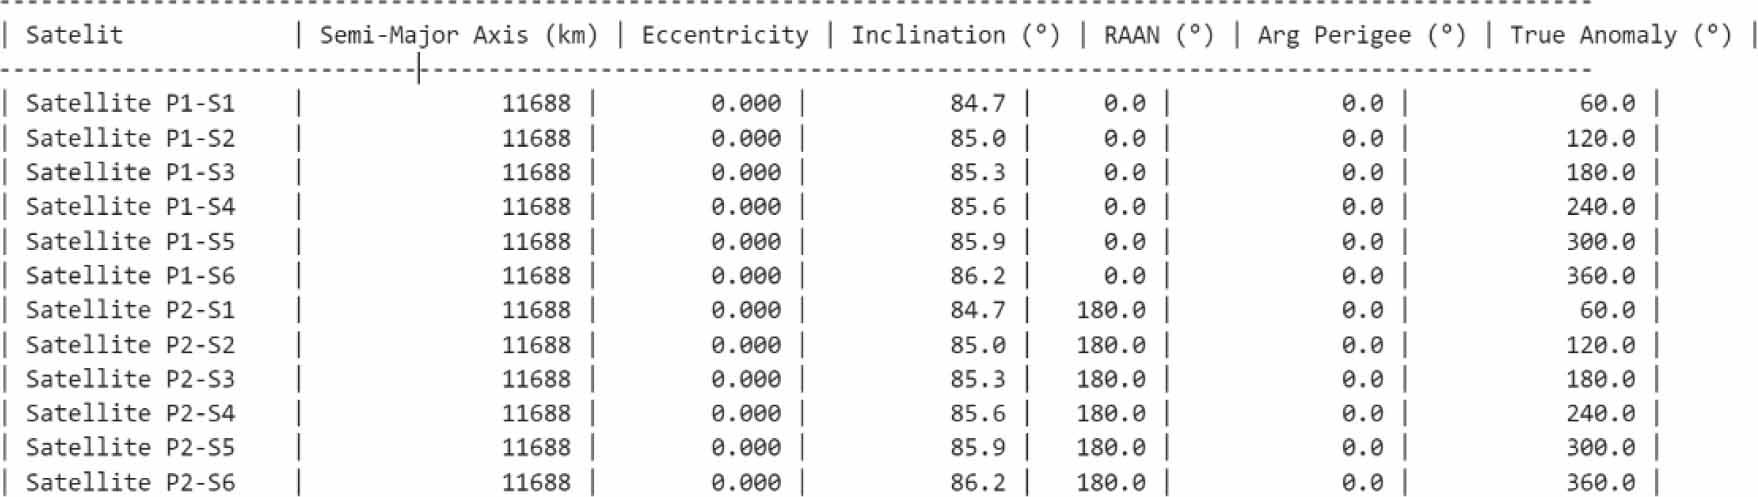
Comparison between the orbital parameters of the constellation simulated in STK and that of the constellation optimized in MATLAB
| Parameter | STK | MATLAB |
|---|---|---|
| Number of orbital planes | 3 (4 satellites per plane) | 2 (6 satellites per plane) |
| Semi-major axis | 13.256 km | 11.688 km |
| Orbital altitude | 6.878 km (MEO) | 5.317 km (LEO superior) |
| Eccentricity | 0° | 0° |
| Argument of perigee | 0° | 0° |
| RAAN | 0°, 120°, 240° | 0°, 180° |
| True anomaly | 0° – 270°, step of 90° | 60° – 360°, step of 60° |
The four scenarios used for analysis and performance evaluation of the satellites operating in the X frequency band at various altitudes
| Scenario Number | Inclination (°) | Altitude (km) | Orbital Planes | Percent Coverage (%) | Gap Duration (s) | Figure of Merit |
|---|---|---|---|---|---|---|
| 7 | Plane 1: 60° | 600 | 3 planes, 9 satellites | 70.37% avg | 17–2551.63 | Interrupted coverage |
| 8 | 60° | 1200 | 3 planes, 9 satellites | 79.39% avg | 36–557.56 | Inconsistent coverage |
| 9 | 60° | 35,786 | 1 plane, 4 satellites | 100% | 0 | Best, in case of GEO performance |
| 10 | 60° | 35,786 | 1 plane, 2 satellites | 85.57% | 625–13327 | Reduced coverage (fewer satellites) |
X-band frequency distribution for the constellation’s configuration
| Orbital Plane | Satellites | Uplink Frequency (GHz) | Downlink Frequency (GHz) |
|---|---|---|---|
| Orbital Plane 1 | Sat 1 – Sat 4 | 8.0 | 9.0 |
| Orbital Plane 2 | Sat 5 – Sat 8 | 8.1 | 9.1 |
| Orbital Plane 3 | Sat 9 – Sat 12 | 8.2 | 9.2 |
| Ground Station | — | 8.0 | 9.0 |
Comparative orbital parameters and performance metrics for Scenario 2 (reduced configuration) and Scenario 5 (enhanced MEO constellation)
| Orbital Parameter | Scenario 2 | Scenario 5 |
|---|---|---|
| Semi-major axis | 13,256 km | 13,256 km |
| Orbital altitude | 6,878 km (MEO) | 6,878 km (MEO) |
| Eccentricity | 0° | 0° |
| Argument of perigee | 0° | 0° |
| Total number of satellites | 6 (3 satellites per plane) | 12 (4 satellites per plane) |
| Number of orbital planes | 2 | 3 |
| Orbital inclinations | 57° (identical for both planes) | 63°, 70°, 75° (diversified per plane) |
| RAAN separation | 180° | 120° (0°, 120°, 240°) |
| True anomaly phasing | 0°, 120°, 240° | 0°, 90°, 180°, 270° |
| Percent coverage | 51.79–79.89% | 100% |
| Gap duration | 718–2700 s | 0 s |
| Figure of Merit (Coverage Time) | ~65% | 100% |
Configuration parameters of the multi-objective algorithm
| Parameter | Value | Description |
|---|---|---|
| Gmax (Max Generations) | 40 | Maximum number of generations |
| M (Pop. Size) | 20 | Population size |
| Crossover Fraction | 0.85 | Crossover rate |
| Mutation Rate | 0.2 | Mutation rate |
| Number of variables (nv) | 5 | [planes, sat/plane, h, i, η] |
| FOV max. | 90° | Set in simulation |
| Simulation time | 5 days | 8-13 September 2025 |
| Sampling time | 10 sec | For satellite–ground station access |
Optimization constraints for the X-band satellite constellation
| Altitude | Hmin ≤ h ≤ Hmax | Hmin = 500 km, Hmax = 7000 km |
|---|---|---|
| Inclination | θmin < θ < θmax | θmin = 60°, θmax = 98° |
| Number of planes | Pmin ≤ P ≤ Pmin | Pmin = 1, Pmax 3 |
| Satellites per plane | Smin ≤ S ≤ Smax | Smin = 2, Smax = 6 |
| Total number of satellites | N = P × S ≤ 12 | N is a positive integer |
| Field of view | ηmin ≤ n < ηmax | ηmin = 60°, ηmax = 90° |
The six scenarios used for analysis and performance evaluation of CubeSats used in the X-frequency band at various orbital inclinations
| Scenario Number | Inclination (°) | Orbital Planes | Percent Coverage (%) | Gap Duration (s) | Figure of Merit – Coverage Time |
|---|---|---|---|---|---|
| 1 | 57° | 2 planes – 4 satellites each | 100% | 0 | Complete coverage |
| 2 | 57° | 2 planes – 3 satellites each | 51.79% – | 718–2700 | Coverage gaps |
| 3 | 67° | 2 planes – 3 satellites each | More efficient than Scenario 2 | 922–2594 | Improved high-latitude coverage |
| 4 | Plane 1: 63°–65° | 2 planes – 3 satellites each | 100% | 0 | No coverage gaps |
| 5 | Plane1. 63° | 3 planes – 4 satellites each | 100% | 0 | High redundancy |
| 6 | 63° | 3 planes – 4 satellites each | 100% | 0 | Balanced performance |
Microwave link budget in the X frequency band
| Uplink | Downlink | |
|---|---|---|
| EIRP (dBW) | 40.029 – 41.406 | 37.883 – 40.084 |
| Received Frequency (GHz) | 8.000000 – 8.200000 | 9.000000– 9.200000 |
| Received Isotropic Power (dBW) | -149.240 – -147.589 | -151.681 – -149.256 |
| Flux Density (dBW/m2) | -108.69 – -107.04 | -111.044 – -108.61 |
| g/T (dB/K) | 23.4408 – 23.4407 | 23.536 – 23.5367 |
| C/No (dB*Hz) | 103.800 – 105.451 | 101.454 – 103.879 |
| Bandwidth (kHz) | 100000 | 100000 |
| C/N (dB) | 28.7489 – 30.3996 | 26.4033 – 28.8284 |
| Eb/No (dB) | 31.7592 – 33.4099 | 29.4136 – 31.8387 |
| BER | 1.000000e-30 | 1.000000e-30 |