

The demand for satellite communications has grown rapidly since Clarke’s 1945 proposal of the geostationary satellite and the launch of Sputnik 1 in 1957, which laid the foundation of modern space-based communications (Puig, 2019). Constellations such as Starlink, OneWeb, and Telesat highlight the importance of efficient orbital design for global connectivity. Yet many countries, including Romania, still depend on terrestrial infrastructure and foreign operators, which limits coverage in remote areas. Satellite constellations can address these gaps, but their performance relies heavily on orbital parameters and geometry.
Satellite constellation design has traditionally relied on orbital configurations such as Walker patterns, polar orbits, and the Street of Coverage (Elsayed et al., 2025; Jiang, Yan & Peng, 2018). With the rise of simulation tools, Systems Tool Kit (STK), developed by Analytical Graphics, Inc. and now part of Ansys, has become central for constellation analysis (Dai et al., 2022), being applied in the fifth generation of Low Earth Orbit -LEO (5G LEO) design (Dai et al., 2022), inter-satellite link evaluation (Yue, Yunxin & Jiacai, 2019), and continuous observation studies (Takahashi & Yamazaki, 2023). Advanced uses include the integration with MATLAB for regional optimization (Jiang et al., 2018). While these applications show STK’s versatility, they focus on broadband, interlink, or regional coverage. Present research instead applies STK to link orbital geometry directly with microwave performance at a national scale, addressing Romania’s sovereignty needs.
Optimization has become a central approach in constellation design, moving beyond purely geometric models to multi-objective methods that balance coverage, capacity, and cost. Evolutionary algorithms such as Genetic Algorithm – Sequential Quadratic Programming (GA – SQP) have been implemented in MATLAB to optimize telecommunications signal coverage in Lisbon (Fathi, Adami & Jafari, 2024), while Multi-Objective Genetic Algorithms (MOGA) have been applied in MATLAB to improve terrestrial-satellite networks (Meziane-Tani et al., 2016). Heuristic methods like Particle Swarm Optimization (PSO) have also been executed in MATLAB for the 5G mobile communications in LEO systems (Wei et al., 2021), and Nondominated Sorting Genetic Algorithm (NSGA)-II has been integrated with MATLAB and STK to design regional constellations based on user requirements (Jiang, Yan & Peng, 2018).
Distinct from prior approaches, present research uses a STK-MATLAB workflow to design a national constellation for Romania, optimizing satellites number, orbital planes, altitude, inclination, and the field of view to ensure balanced coverage, defense capacity, and cost efficiency.
Application-oriented studies expand constellation design perspective. Axelsson (2022) investigated cost-effective Geostationary Earth Orbit – Non-Geostationary Orbit (GEO–NGSO) hybrids for small user terminals, and Puig (2019) studied nanosatellite inter-satellite links to enhance connectivity. These works stress technical feasibility but not national independence. At a larger scale, mega-constellations such as Starlink (Bhattacherjee et al., 2020), OneWeb (Chen et al., 2025), and Telesat (del Portillo, Cameron & Crawley, 2019), have been compared in terms of throughput, scalability, and architecture (del Portillo, Cameron & Crawley, 2019), though such systems remain impractical for smaller nations.
Building on these combinations, the present research introduces a national-scale satellites constellation design for Romania, where no independent communication satellites currently exist. The novelty lies in the combined use of STK and MATLAB for both orbital configuration and communication performance optimization, targeting balanced nationwide coverage, robust capacity for government and defense needs, and optimized orbital efficiency with minimal number of satellites deployment.
In this context, the paper sets out three key objectives. First, the constellation must ensure complete and uniform microwave signal coverage across the Romanian territory, guaranteeing continuous connectivity with high-quality service. Second, it should provide sufficient communication capacity to address national demands, with particular emphasis on governmental and defense requirements. Finally, the system must be designed with orbital efficiency in mind, achieving a balanced satellite distribution that minimizes the total number of spacecraft while maintaining reliability and reducing deployment and operational costs.
The research methodology followed a structured simulation-optimization workflow combining STK and MATLAB environments. The aim was to design and optimize a Medium Earth Orbit (MEO) CubeSat constellation capable of ensuring continuous nationwide X-band communications over Romanian territory.
All orbital and communication simulations were performed in STK and the study assumed standard atmospheric and propagation conditions according to ITU-R P.618-13 and ITU-R P.676-12 for gaseous attenuation in the X band (8-12 GHz). The Earth model used was WGS-84, with a minimum elevation angle of 22° to ensure realistic ground visibility constraints and for more accurate modelling of the satellites’ orbital motion, the J4 perturbator propagator was employed, accounting for higher-order gravitational harmonics of the Earth’s field. The field of view (FOV) of each CubeSat was limited at 28°, consistent with typical horn antenna patterns providing a main-lobe gain of ~36.9 dBi, beamwidth of 2.29°, and transmit power of 30 dBW. Each satellite was modelled using the default CubeSat (Figure no.1) platform in STK, with bilateral deployable solar panels and X-band transceivers configured for 8 GHz uplink and 9 GHz downlink. The ground segment was defined as a single high-gain parabolic antenna located in Bucharest (44.43° N, 26.10° E), used a high-gain parabolic antenna (gain ≈ 48 dBi, transmit power = 30 dBW, beamwidth of 0.73°). Each scenario was simulated over a 24-hour window (8 September 2025 10:00 UTC – 9 September 2025 10:00 UTC) to ensure temporal consistency. The coverage grid was defined at a 0.1° spatial resolution (⁓4400 grid points), corresponding to an average separation of 11 km north-south and 8 km east-west.
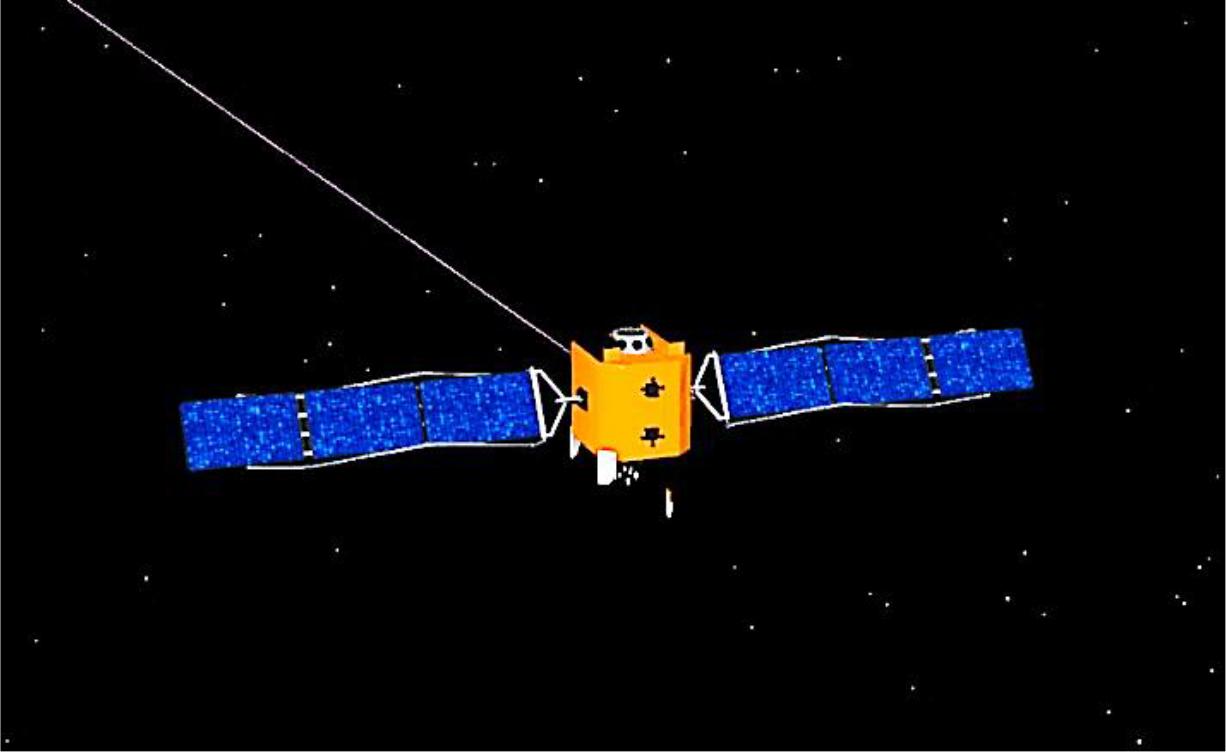
Generic CubeSat satellite used in the present STK simulations
(Source: Author, simulation generated in ANSYS Systems Tool Kit (STK))
Each scenario was simulated with varying orbital altitude (500-7000 km), inclination (57°-75°), number of orbital planes (1-3), and number of satellites per plane (2-6). STK automatically computed coverage intervals and communication access for each ground grid point, generating several reports used for post-processing and optimization. The orbital data were exported in *.csv format files using the STK “Report & Graph Manager” function for subsequent MATLAB. The exported datasets included Altitude Quaternions, Classical Orbit Elements, and Ephemeris reports, which together provided essential information on satellite attitude and orientation, orbital parameters, and time-stamped position and velocity.
The exported CSV data was imported into MATLAB R2025a and processed using the Satellite Communications Toolbox. Satellites orbits were reconstructed via the “satelliteScenario()” and “satellite()” functions, enabling access interval re-computation and consistency verification with STK outputs. For optimization, a Multi-Objective Genetic Algorithm (MOGA) was used. The algorithm simultaneously maximized territorial coverage and minimized both the number of satellites and the cumulative gap duration. The decision variables and constraints were defined in Table no. 1 and Table no. 2.
Optimization constraints for the X-band satellite constellation
| Altitude | Hmin ≤ h ≤ Hmax | Hmin = 500 km, Hmax = 7000 km |
|---|---|---|
| Inclination | θmin < θ < θmax | θmin = 60°, θmax = 98° |
| Number of planes | Pmin ≤ P ≤ Pmin | Pmin = 1, Pmax 3 |
| Satellites per plane | Smin ≤ S ≤ Smax | Smin = 2, Smax = 6 |
| Total number of satellites | N = P × S ≤ 12 | N is a positive integer |
| Field of view | ηmin ≤ n < ηmax | ηmin = 60°, ηmax = 90° |
Configuration parameters of the multi-objective algorithm
| Parameter | Value | Description |
|---|---|---|
| Gmax (Max Generations) | 40 | Maximum number of generations |
| M (Pop. Size) | 20 | Population size |
| Crossover Fraction | 0.85 | Crossover rate |
| Mutation Rate | 0.2 | Mutation rate |
| Number of variables (nv) | 5 | [planes, sat/plane, h, i, η] |
| FOV max. | 90° | Set in simulation |
| Simulation time | 5 days | 8-13 September 2025 |
| Sampling time | 10 sec | For satellite–ground station access |
The development of satellite network for Romania must account for the country’s specific geography and topographical diversity to ensure efficient X-band (8-12 GHz) coverage. Romania spans an area of 238,397 km2, located between latitudes 43°37′-48°15′ N and longitudes 20°15′-29°45′ E, corresponding to mid-latitudes where orbital inclination and altitude strongly affect communication performance.
The working scenarios were defined to cover the full range of orbital configurations capable of achieving nationwide coverage with minimum number of satellites. Inclinations between 57° and 75° were selected to provide repeated passes over Romanian latitudes and improve the trade-off between coverage uniformity, revisit time, and constellation redundancy. A MEO altitude of 6878 km (semi-major axis of 13256 km) was used as the baseline case, representative of typical X-band communication systems that balance signal footprint, latency, and launch cost, with an eccentricity of 0° and an argument of perigee of 0°. The specific inclination and altitude ranges were selected to represent realistic operational configurations used in communication constellations and to enable direct comparison across the main orbital regimes (LEO, MEO, and GEO).
Under these standardized conditions, six inclination-based scenarios (Table no. 3) were first simulated at a fixed MEO altitude to analyze how orbital plane distribution and inclination affect coverage percentage, signal gaps, and overall constellation performance. In addition, four altitude-variation scenarios (Table no. 4) were simulated to evaluate how changes in orbital height influence the spatial footprint of microwave signal. For completeness, two GEO reference cases were also introduced within the altitude set. They served as performance benchmarks for ideal continuous visibility, allowing a direct comparison between non-geostationary (LEO/MEO) and geostationary configurations.
The six scenarios used for analysis and performance evaluation of CubeSats used in the X-frequency band at various orbital inclinations
| Scenario Number | Inclination (°) | Orbital Planes | Percent Coverage (%) | Gap Duration (s) | Figure of Merit – Coverage Time |
|---|---|---|---|---|---|
| 1 | 57° | 2 planes – 4 satellites each | 100% | 0 | Complete coverage |
| 2 | 57° | 2 planes – 3 satellites each | 51.79% – | 718–2700 | Coverage gaps |
| 3 | 67° | 2 planes – 3 satellites each | More efficient than Scenario 2 | 922–2594 | Improved high-latitude coverage |
| 4 | Plane 1: 63°–65° | 2 planes – 3 satellites each | 100% | 0 | No coverage gaps |
| 5 | Plane1. 63° | 3 planes – 4 satellites each | 100% | 0 | High redundancy |
| 6 | 63° | 3 planes – 4 satellites each | 100% | 0 | Balanced performance |
The four scenarios used for analysis and performance evaluation of the satellites operating in the X frequency band at various altitudes
| Scenario Number | Inclination (°) | Altitude (km) | Orbital Planes | Percent Coverage (%) | Gap Duration (s) | Figure of Merit |
|---|---|---|---|---|---|---|
| 7 | Plane 1: 60° | 600 | 3 planes, 9 satellites | 70.37% avg | 17–2551.63 | Interrupted coverage |
| 8 | 60° | 1200 | 3 planes, 9 satellites | 79.39% avg | 36–557.56 | Inconsistent coverage |
| 9 | 60° | 35,786 | 1 plane, 4 satellites | 100% | 0 | Best, in case of GEO performance |
| 10 | 60° | 35,786 | 1 plane, 2 satellites | 85.57% | 625–13327 | Reduced coverage (fewer satellites) |
The simulation outcomes summarized in Tables no. 3 and no. 4 are evaluated using three key performance indicators: a) Percent Coverage - it measures the proportion of grid points within the target area successfully covered by the constellation signa; b) Gap Duration - it indicates the time intervals during which a specific location experiences a lack of microwave signal coverage; c) Figure of Merit – which quantifies overall performance in terms of Coverage Time, which evaluates how long the grid points remain continuously covered by microwave signal.
The number of satellites and orbital planes was varied to identify the most efficient configuration ensuring continuous nationwide communication with minimal resource usage. The results of these comparative simulations are further discussed in the following subsections, highlighting the performance trade-offs among LEO, MEO, and GEO configurations.
After analyzing all simulated scenarios and comparing the obtained key-parameters (Percent Coverage, Gap Duration, and Figure of Merit), significant differences were observed among the tested configurations. The performance of the constellation was found to depend directly on the number of satellites, their distribution across orbital planes, and the selected inclinations and altitudes. Among the ten tested configurations, Scenario 2 and Scenario 5 were selected for a detailed analysis, as they represent the opposite ends for constellation performance. Scenario 2 reflects the minimal configuration able to sustain partial national coverage, while Scenario 5 indicates the efficient MEO geometry achieving continuous coverage and full redundancy. The purpose of this comparison is to emphasize how constellation geometry directly affects national communication reliability.
Scenario 2 consisted of a constellation of six satellites distributed across two orbital planes, each with an inclination of 57°. The results showed a variable signal coverage between (51.79-79.89) %, with signal outage intervals, between (718-2700) seconds. These values highlight that the reduced number of satellites and the lack of diversity in inclinations cannot guarantee continuous coverage of Romania territory, leading to uncovered areas and unacceptable outage times for critical communication applications. The configuration of this scenario is illustrated in Figure no. 2, where the left image shows the satellites coverage footprint, while the right illustrates the distribution of satellites in two orbital planes around Earth and the 2D image highlighting coverage gaps over Romania.
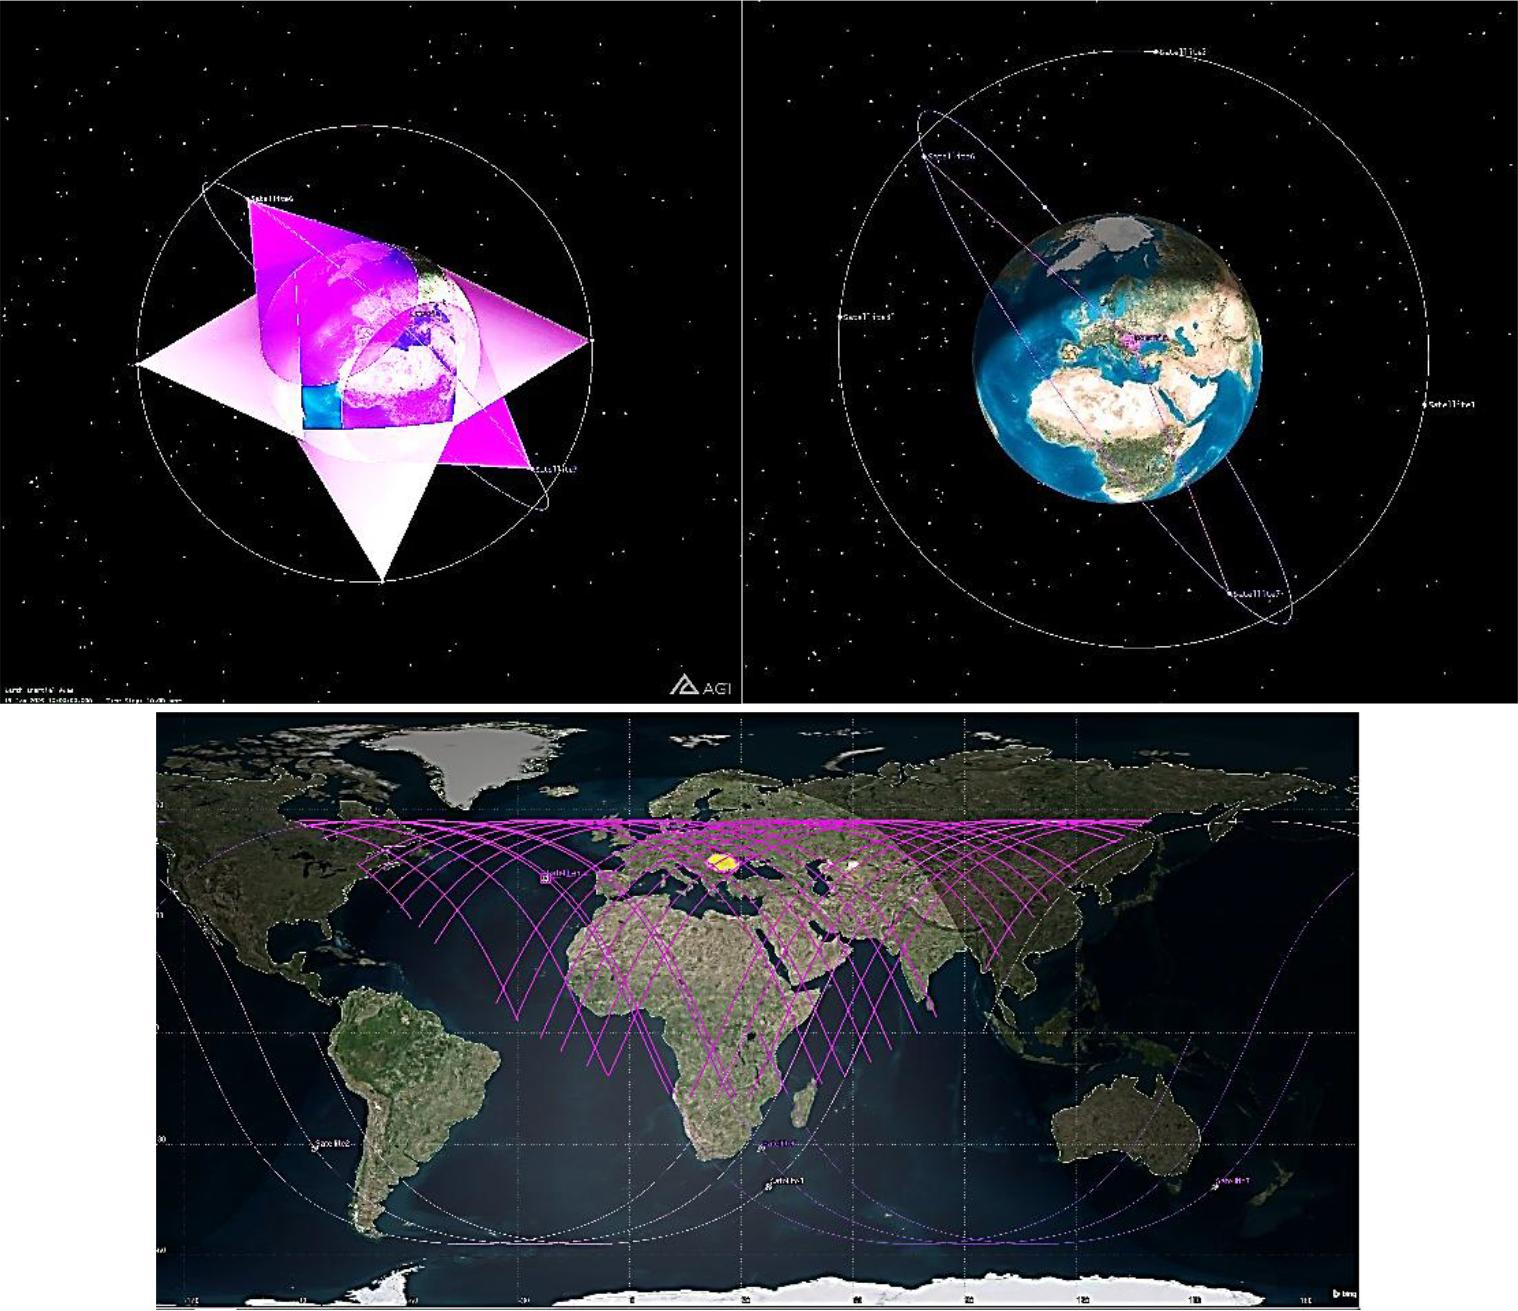
Satellite constellation visualization for Romania’s coverage in the X-band frequency range, in 3D and 2D (Scenario 2)
(Source: Author, simulation generated in ANSYS Systems Tool Kit (STK))
For a more detailed visualization of the coverage result, Figure no. 3 illustrates the Figure of Merit (Coverage Time) for Scenario 2. The Figure of Merit maps quantify the temporal availability of the satellite constellation over Romania, with the color scale ranging from red (low availability) to green (near-continuous coverage). Scenario 2 highlights reduced coverage uniformity, with extended yellow regions and an average coverage of about 65%.
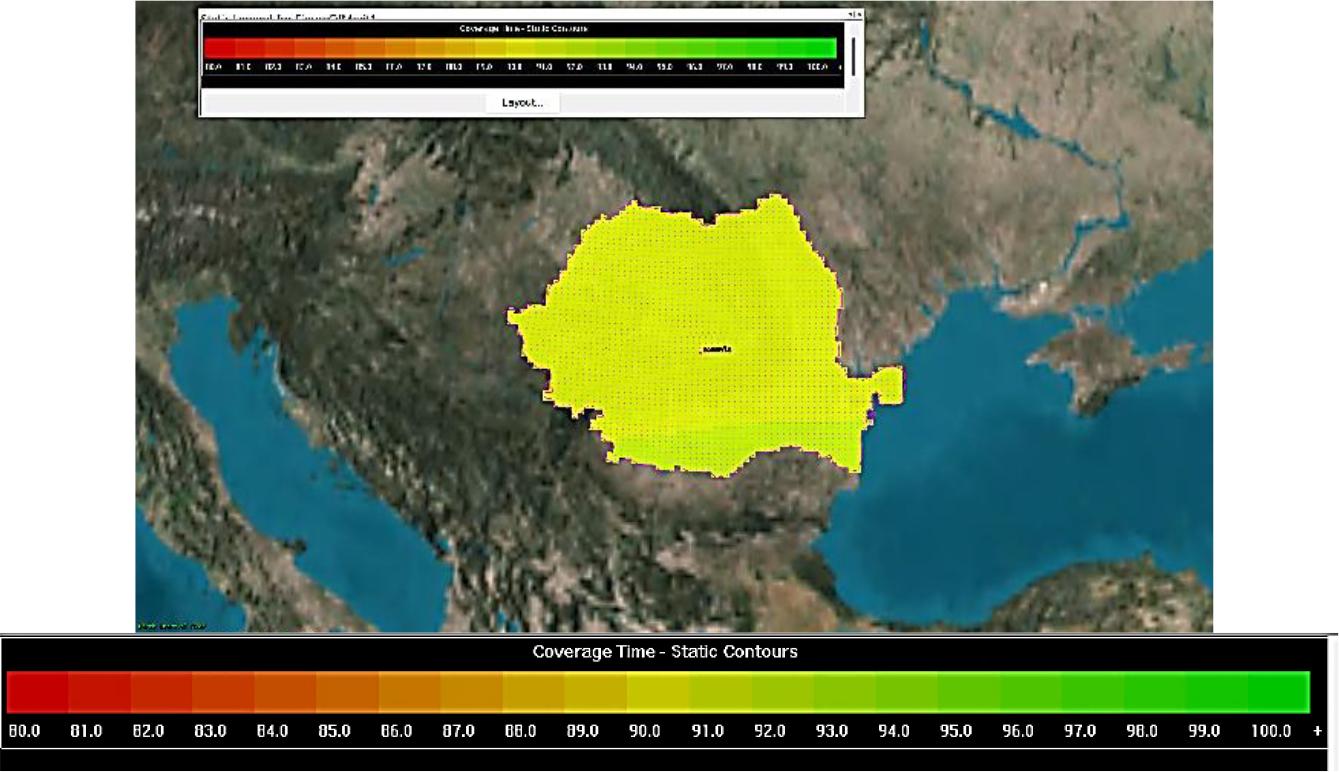
Figure of Merit (Coverage Time) analysis for Scenario 2
(Source: Author, simulation generated in ANSYS Systems Tool Kit (STK))
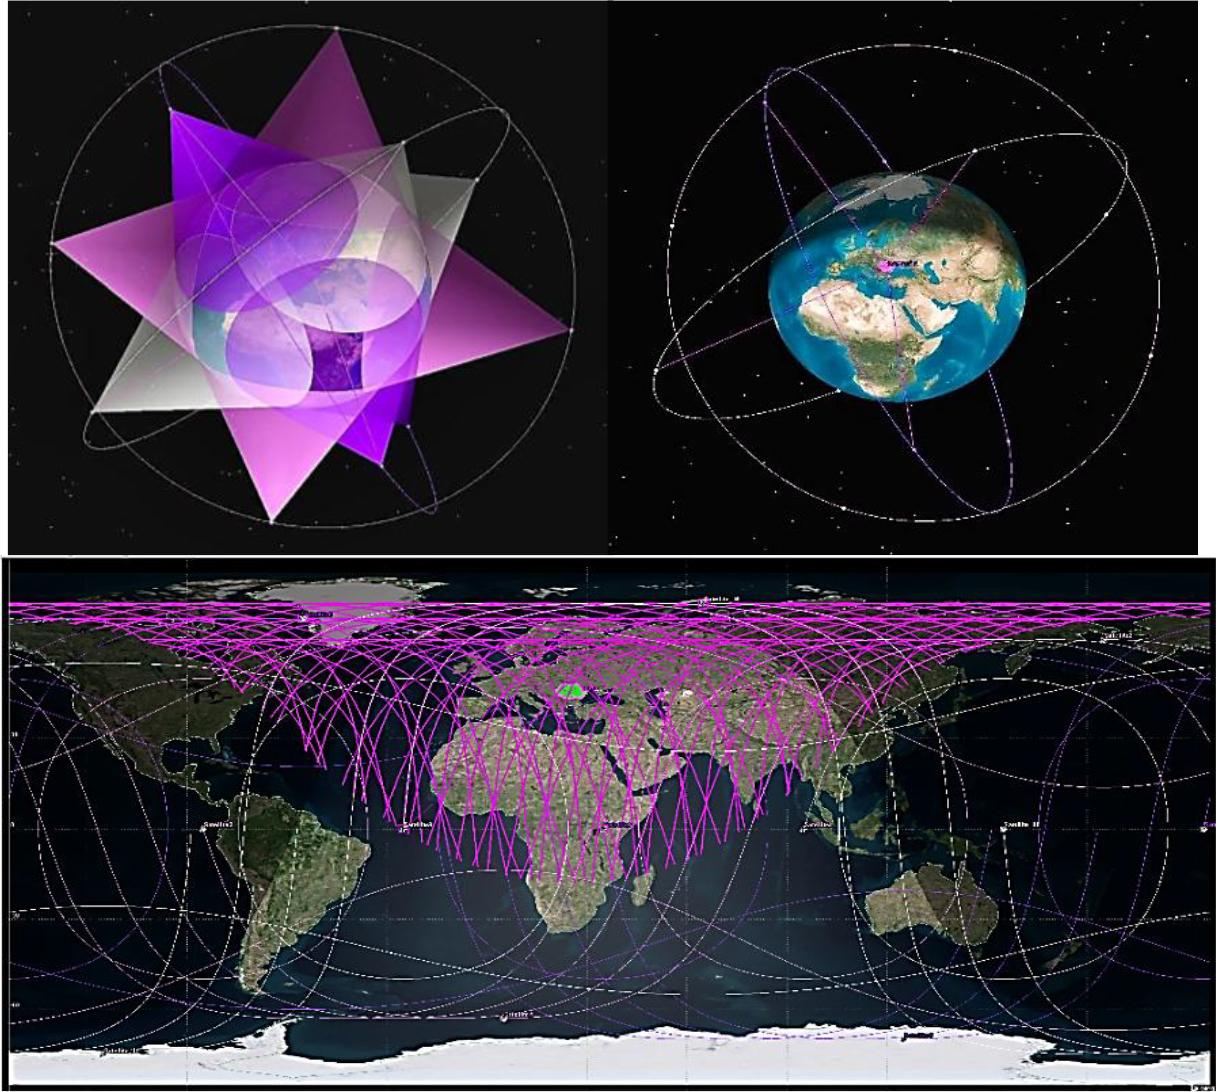
Satellite constellation visualization for Romania’s X-band microwave coverage, in 3D and 2D (Scenario 5)
(Source: Author, simulation generated in ANSYS Systems Tool Kit (STK))
By contrast, Scenario 5 was selected as the final and best-performing configuration, as it provides an optimal balance between radio coverage, redundancy, and constellation design complexity. The configuration consists of twelve satellites deployed in three orbital planes at MEO altitude of 6878 km, corresponding to a semi-major axis of 13256 km. The orbital inclinations of the planes are set at 63°, 70°, and 75°, ensuring robust signal coverage of Romanian territory. Within each plane, four satellites are uniformly phased at true anomalies of 0°, 90°, 180°, and 270°, while RAAN values are separated by 120° (0°, 120°, and 240° for the three planes, respectively).
This delta-type orbital geometry improves the spatial distribution of satellite footprints and eliminates service discontinuities, resulting in continuous 100% signal availability across the entire Romanian territory. The coverage performance is further depicted in Figure no. 5, which presents the Figure of Merit (Coverage Time) map.
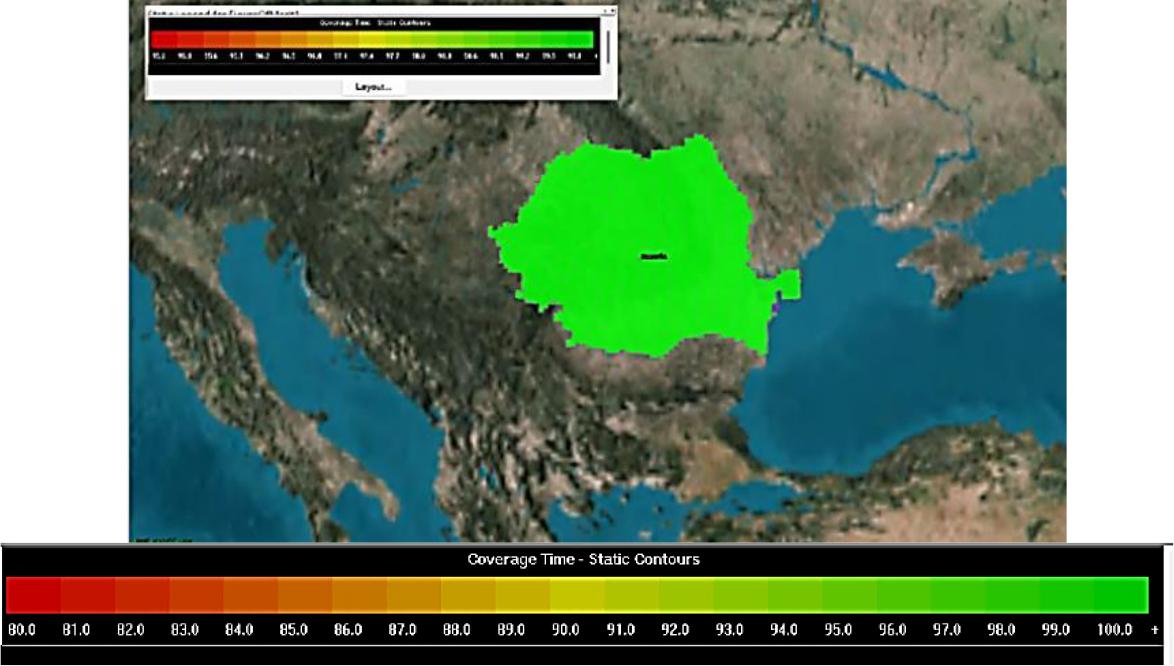
Figure of Merit (Coverage Time) analysis for Scenario 5
(Source: Author, simulation generated in ANSYS Systems Tool Kit (STK))
By comparing the two scenarios, it becomes evident that performance is strongly influenced by the number of satellites, their distribution across orbital planes, and the chosen inclinations. Scenario 2 exhibits significant microwave coverage gaps and long outage periods, making it unsuitable for continuous communication services. In contrast, Scenario 5 achieves complete coverage and eliminates signal interruptions through a denser and more diverse orbital configuration. These results highlight the importance of constellation geometry in ensuring reliable national coverage. To quantitatively illustrate these differences, Table no. 5 presents a comparative summary of the main orbital parameters and performance metrics for both configurations.
Comparative orbital parameters and performance metrics for Scenario 2 (reduced configuration) and Scenario 5 (enhanced MEO constellation)
| Orbital Parameter | Scenario 2 | Scenario 5 |
|---|---|---|
| Semi-major axis | 13,256 km | 13,256 km |
| Orbital altitude | 6,878 km (MEO) | 6,878 km (MEO) |
| Eccentricity | 0° | 0° |
| Argument of perigee | 0° | 0° |
| Total number of satellites | 6 (3 satellites per plane) | 12 (4 satellites per plane) |
| Number of orbital planes | 2 | 3 |
| Orbital inclinations | 57° (identical for both planes) | 63°, 70°, 75° (diversified per plane) |
| RAAN separation | 180° | 120° (0°, 120°, 240°) |
| True anomaly phasing | 0°, 120°, 240° | 0°, 90°, 180°, 270° |
| Percent coverage | 51.79–79.89% | 100% |
| Gap duration | 718–2700 s | 0 s |
| Figure of Merit (Coverage Time) | ~65% | 100% |
The communication scenario investigated in this study corresponds to a MEO CubeSat constellation specifically optimized to ensure nationwide X-band (8-12 GHz) connectivity over Romania. The selected configuration, hereafter referred to as Scenario 5, represents the best-performing case derived from the simulation campaign. Each CubeSat is equipped with an X-band transceiver and high-directivity square horn antenna with a main-lobe gain of ≈ 36.9 dB and a half-power beamwidth of ≈ 2.29°. These antennas were selected for their compact geometry, stable phase center, and efficiency in fixed-beam configurations, ensuring a high-gain parabolic antenna located in Bucharest, characterized by a gain of ≈ 48 dB, transmit power of 30 dBW, and a 0.73° beamwidth, suitable for both transmission and reception with precise beam pointing. The interaction between the spaceborne and ground antennas, including the bidirectional radiation exchange beamforming geometry, is illustrated in Figure no. 6. The 3D beam pattern confirms the alignment of the horn and parabolic antennas, highlighting the narrow main lobe and high directivity that minimal spillover losses and effective power concentration toward the target footprint.
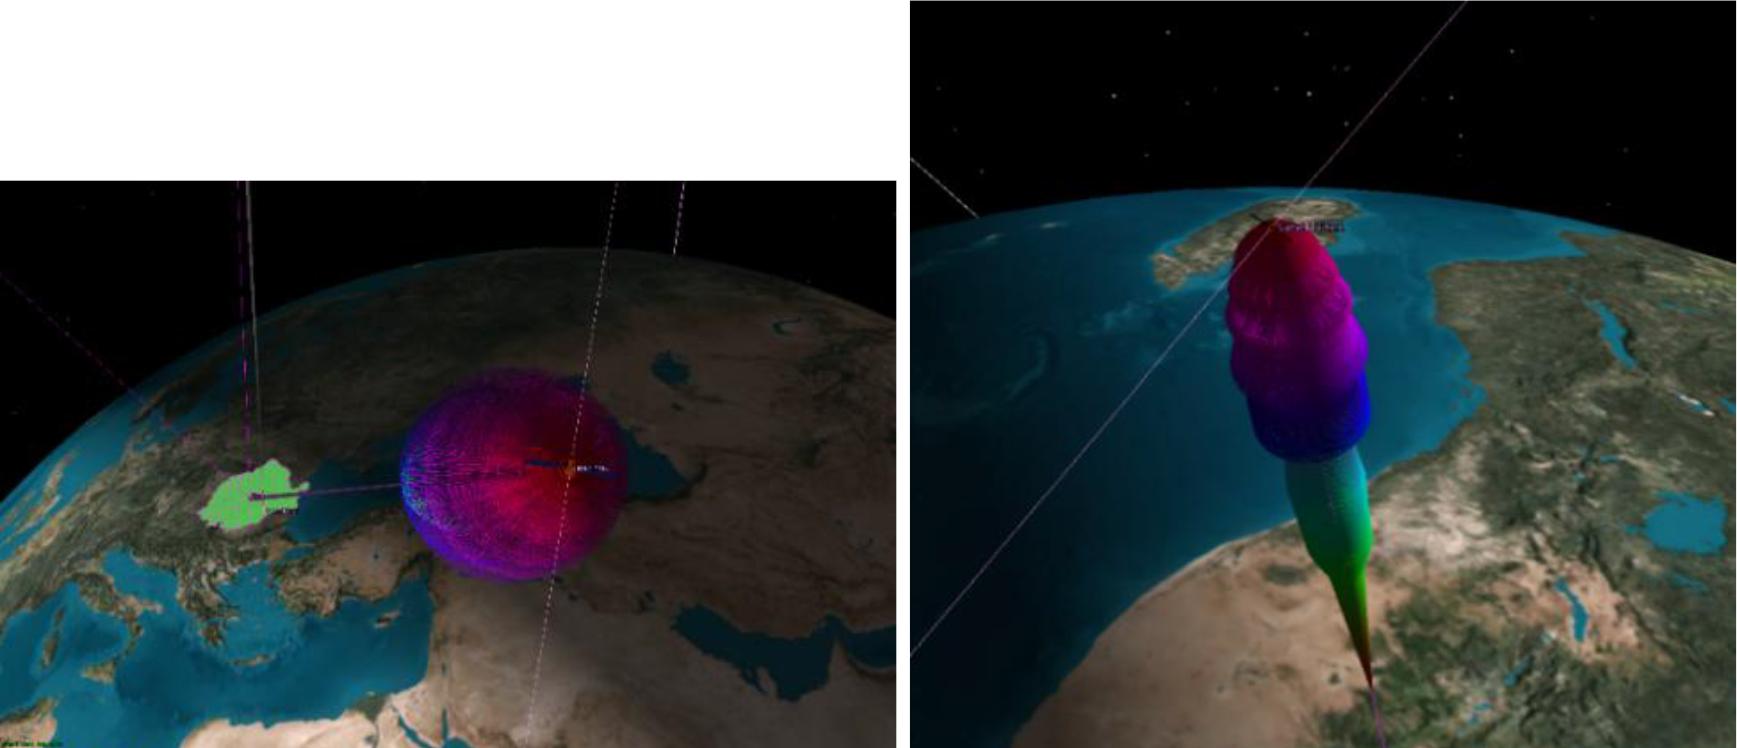
Satellite-ground station interaction and bidirectional beamforming
(Source: Author, simulation generated in ANSYS Systems Tool Kit (STK))
To prevent intra-constellation interference and to improve frequency reuse, a frequency allocation scheme was applied across the three orbital planes, as shown in Table no. 6.
X-band frequency distribution for the constellation’s configuration
| Orbital Plane | Satellites | Uplink Frequency (GHz) | Downlink Frequency (GHz) |
|---|---|---|---|
| Orbital Plane 1 | Sat 1 – Sat 4 | 8.0 | 9.0 |
| Orbital Plane 2 | Sat 5 – Sat 8 | 8.1 | 9.1 |
| Orbital Plane 3 | Sat 9 – Sat 12 | 8.2 | 9.2 |
| Ground Station | — | 8.0 | 9.0 |
The link budget quantifies the power balance of the communication system, according to transmission power, antenna gain, path losses, and receiver sensitivity (Table no. 7). The calculation considered free-space path loss, atmospheric attenuation (based on ITU-R P.618-13 and P.676-12 models), polarization mismatch, and system noise temperature. The resulting equivalent isotopically radiated power (EIRP) ranges from 40.03 to 41.41 dBW on the uplink and 37.88 to 40.08 dBW on the downlink, indicating higher transmission requirements for the ground-to-satellite path due to greater atmospheric absorption. Correspondingly, the received power is lower on the downlink (-151.681 to -149.256) dBW compared to the uplink (-149.240 to -147.589) dBW, confirming greater propagation losses in the satellite-to-ground path. The obtained carrier-to-noise ratio (C/N) values are higher in the uplink (28.7-30.4) dB than in the downlink (26.4-28.8) dB, while energy per bit to noise power spectral density ratio (Eb/No) remains high in both directions, and the bit error rate (BER) is negligible (≈10−30), confirming highly reliable communication and minimal data loss.
Microwave link budget in the X frequency band
| Uplink | Downlink | |
|---|---|---|
| EIRP (dBW) | 40.029 – 41.406 | 37.883 – 40.084 |
| Received Frequency (GHz) | 8.000000 – 8.200000 | 9.000000– 9.200000 |
| Received Isotropic Power (dBW) | -149.240 – -147.589 | -151.681 – -149.256 |
| Flux Density (dBW/m2) | -108.69 – -107.04 | -111.044 – -108.61 |
| g/T (dB/K) | 23.4408 – 23.4407 | 23.536 – 23.5367 |
| C/No (dB*Hz) | 103.800 – 105.451 | 101.454 – 103.879 |
| Bandwidth (kHz) | 100000 | 100000 |
| C/N (dB) | 28.7489 – 30.3996 | 26.4033 – 28.8284 |
| Eb/No (dB) | 31.7592 – 33.4099 | 29.4136 – 31.8387 |
| BER | 1.000000e-30 | 1.000000e-30 |
After completing the simulation campaign in STK, the next stage focused on refining the orbital configuration through multi-objective optimization in MATLAB. The orbital and coverage datasets exported from STK were imported into the Satellite Communications Toolbox, where the constellation was reconstructed and reevaluated using identical performance – territorial coverage, access intervals, and cumulative gap duration. This reconstruction ensured the consistency of data between STK and MATLAB environments and provided the basis for algorithmic optimization (Figure no. 7).
Visualization of the CubeSat constellation in MATLAB
(Source: Author, generated in MATLAB R2025a, The MathWorks Inc.)
To enhance constellation modeled in STK, a MOGA algorithm was applied to maximize territorial coverage while minimizing the number of satellites and gap duration, under constraints on orbital altitude, inclination, and orbital planes. Genetic algorithms, inspired by natural evolutionary processes at the DNA level, employ operators such as mutation and crossover to efficiently explore the solution space in complex optimization problems. Their multi-objective variants enable simultaneous optimization of conflicting objectives and provide a Pareto front of non-dominated solutions, supporting balanced trade-off between performance and cost. The main configuration parameters of the optimization algorithm and the orbital characteristics considered are summarized in the Table no. 1 and Table no. 2.
Once defined the optimization parameters, MOGA automatically generates an initial population of candidate configurations, each representing a unique combination of the decision variables. These solutions are then evaluated though the “fitnessFunction()”, which simultaneously considers three conflicting objectives: minimizing the total number of satellites, maximizing coverage, and minimizing the cumulative duration of coverage gaps. The outcome of this evaluation is the construction of a Pareto front of non-dominated solutions, which captures the trade-offs between objectives and provides a set of balanced alternatives rather than a single optimal point.
Based on the scores obtained, the higher-performing solutions are selected to participate in the reproduction process. The step selection, analogous to natural selection, ensures that the fittest individuals are chosen to pass on their characteristics to the next generation. The crossover operator acts as the genetic recombination between two parents, exchanging segments of their decision variables to produce offspring that inherit traits from both. In turn, the mutation operator introduces random alterations in the genetic code of the offspring, ensuring genetic diversity within the population and preventing premature convergence.
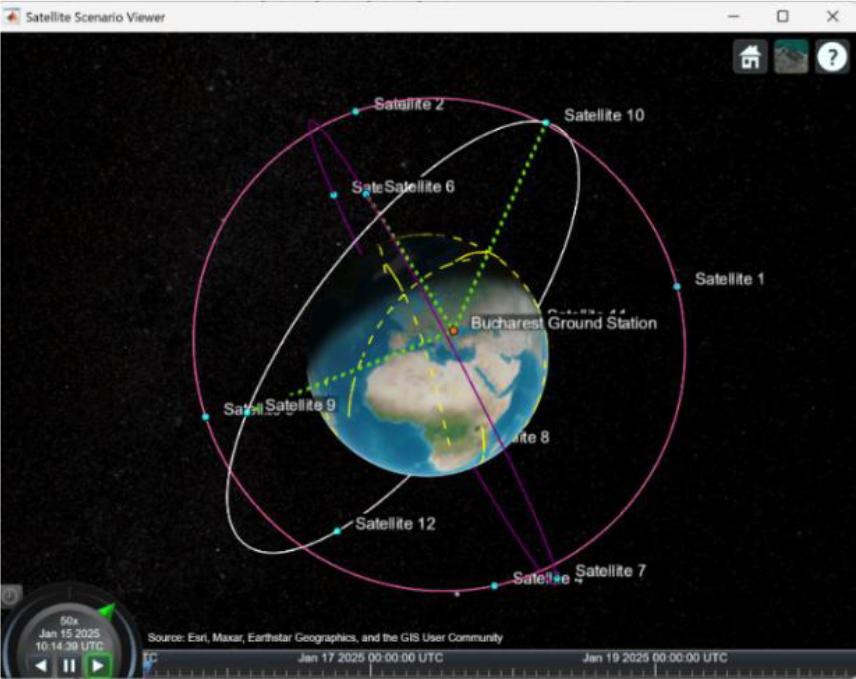
The process continues until the stopping condition is reached, after which a set of optimal solutions is obtained. From this set, the configuration that best satisfies the imposed constraints (e.g., maximum 12 satellites) is selected. After the evolution of all generations, the optimized constellation is constructed (Figure no. 8), where the trajectories of the satellite can be visualized, representing the orbits they follow around the Earth. The results related to orbital parameters of the configuration are presented in Figure no. 9.
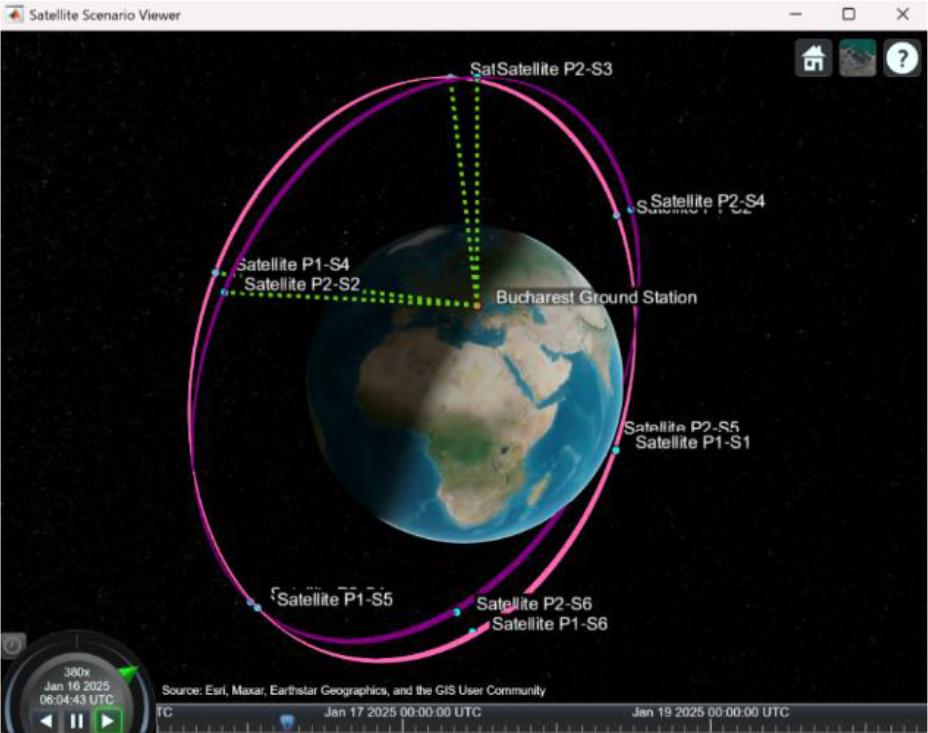
Visualization of the optimized satellite constellation and the access link between satellites and the Bucharest ground station in the Satellite Scenario Viewer environment (Source: Author, generated in MATLAB R2025a, The MathWorks Inc.)
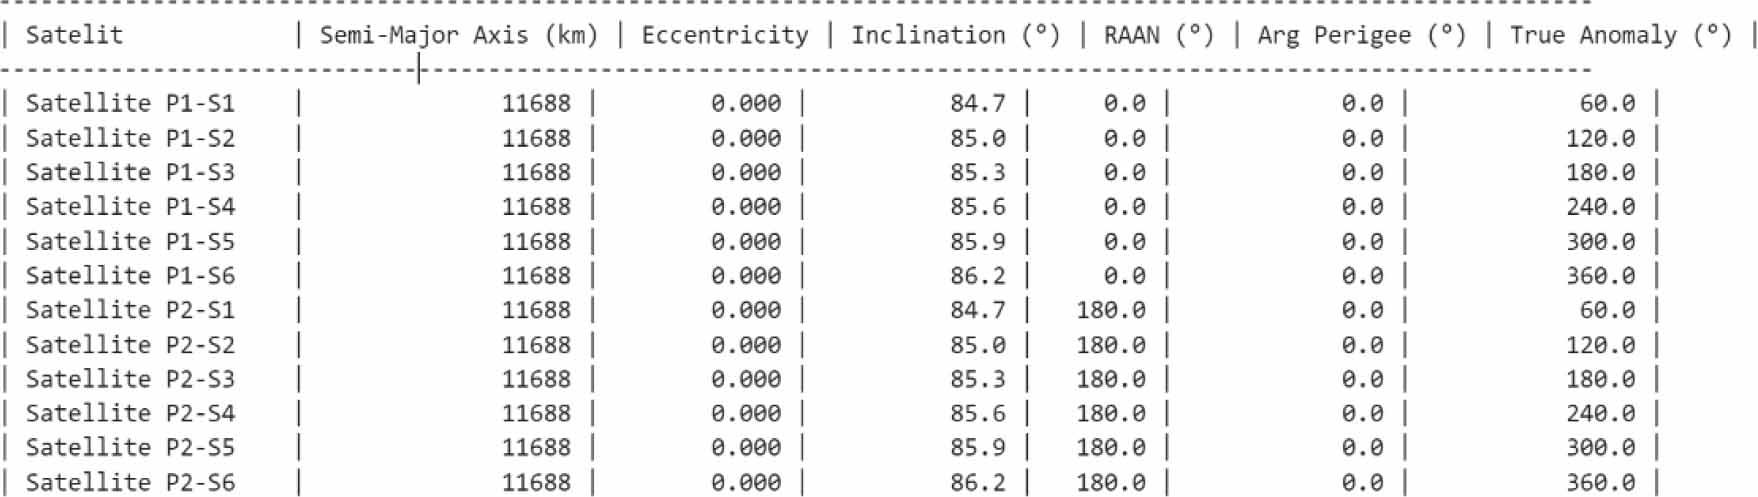
The orbital parameters of the optimized X-band constellation
The simulations performed in STK and MATLAB illustrate two complementary approaches for CubeSat constellation design. STK provides a high fidelity, visually oriented environment for simulating satellite trajectories, ground station interactions, and orbital events, where orbital parameters are manually defined and the dynamic behavior is automatically generated. MATLAB, by contrast, adopts a programmatic approach, enabling constellation construction and optimization through scripts, functions, and algorithmic control structures.
The difference between the two platforms is evident in the results. STK, using realistic propagation models and precise elevation constraints, reported a gap duration of 0 minutes. MATLAB, which relies on a simplified representation of access intervals, produced a gap duration of 60 minutes for the same configuration. Following optimization with MOGA, the gap was reduced to 35.17 minutes, demonstrating the efficiency of the evolutionary approach in refining constellation geometry. Beyond the numerical results, the optimized constellation has clear implications for nationwide communications. The lower orbital altitude improves coverage consistency and reduces latency, while the algorithm ensures a balanced trade-off between satellite count and performance (Table no. 8).
Comparison between the orbital parameters of the constellation simulated in STK and that of the constellation optimized in MATLAB
| Parameter | STK | MATLAB |
|---|---|---|
| Number of orbital planes | 3 (4 satellites per plane) | 2 (6 satellites per plane) |
| Semi-major axis | 13.256 km | 11.688 km |
| Orbital altitude | 6.878 km (MEO) | 5.317 km (LEO superior) |
| Eccentricity | 0° | 0° |
| Argument of perigee | 0° | 0° |
| RAAN | 0°, 120°, 240° | 0°, 180° |
| True anomaly | 0° – 270°, step of 90° | 60° – 360°, step of 60° |
Current study highlights the importance of implementing satellite constellations simulation as a key approach not only for enhancing the performance of national communication networks but also for strengthening Romania’s technological autonomy in the field of communications. By adopting this design solution, Romania could reduce its dependence on external infrastructures and develop a resilient, independent, and adaptable communication network, capable meeting both current and future technological challenges. Future work will focus on re-implementing the optimized constellation in STK, extending the analysis to multiple ground stations, incorporating inter-satellite links, and evaluating resilience to failure. These steps are essential to confirm that the optimized design can support continuous and reliable Romanian nationwide communication.