

Figure no. 1:
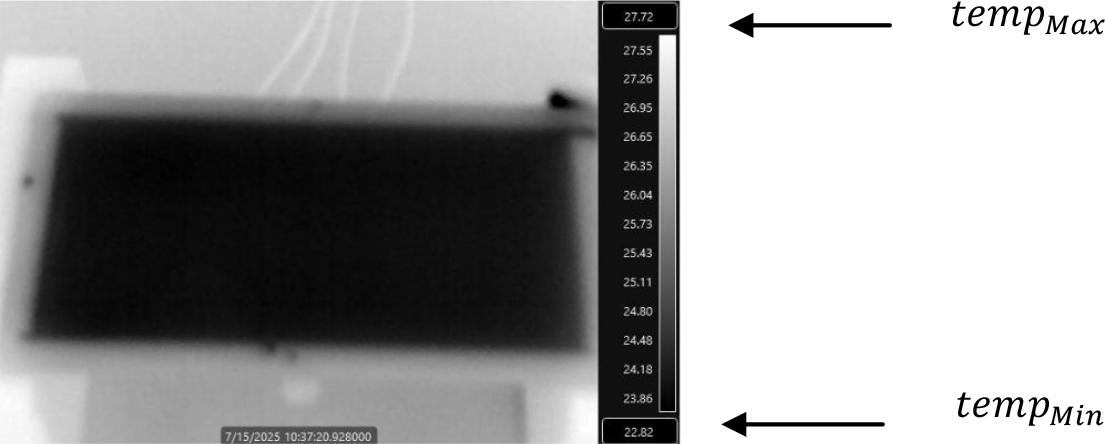
Figure no. 2.a:
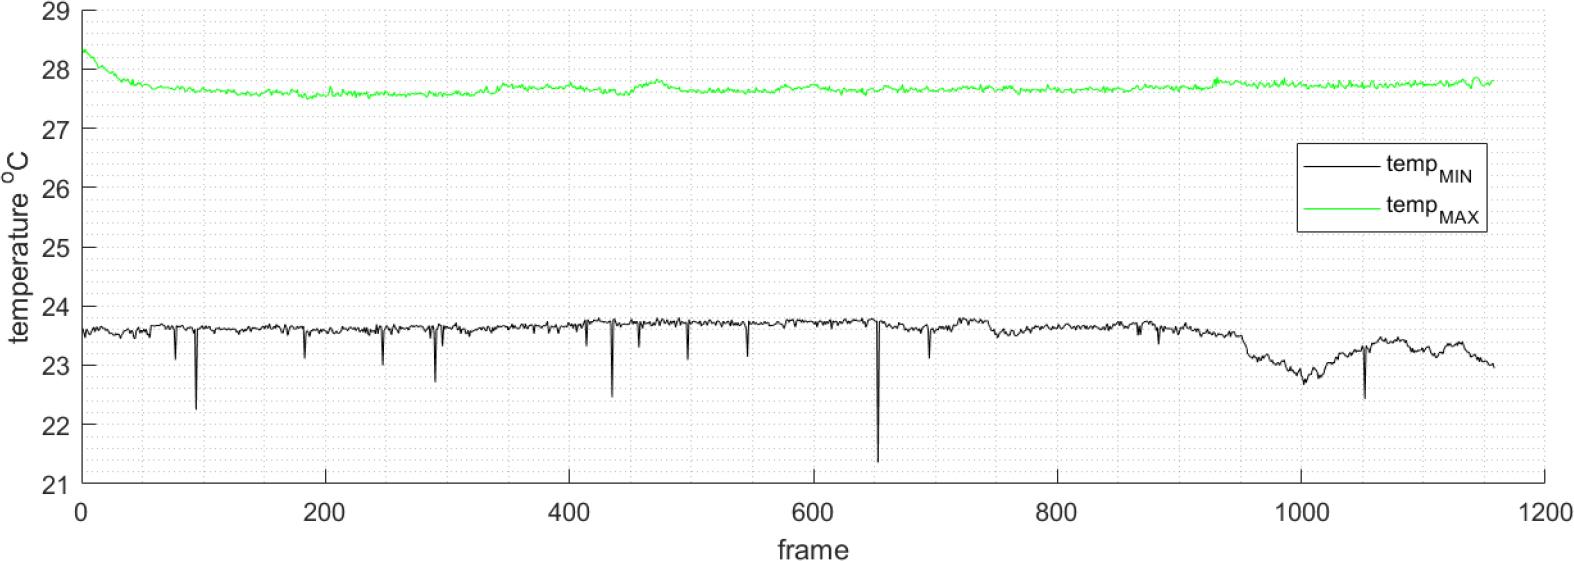
Figure no. 2.b:
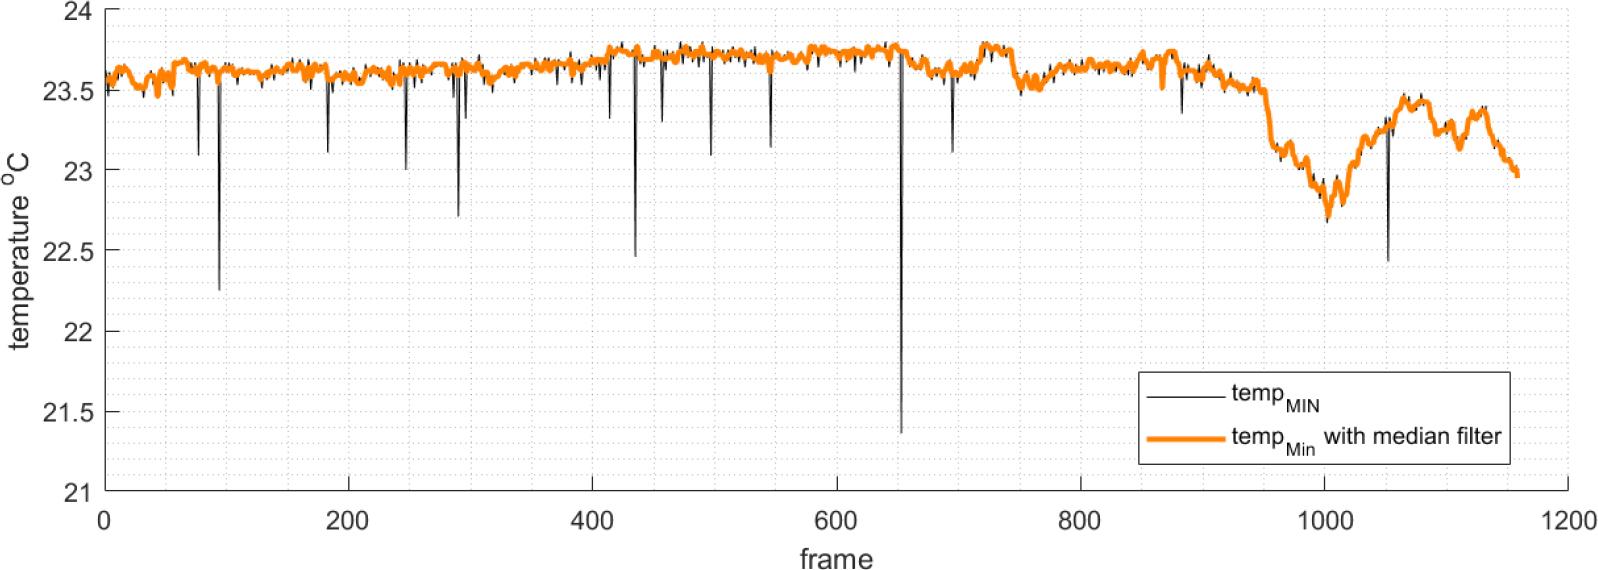
Figure no. 3:
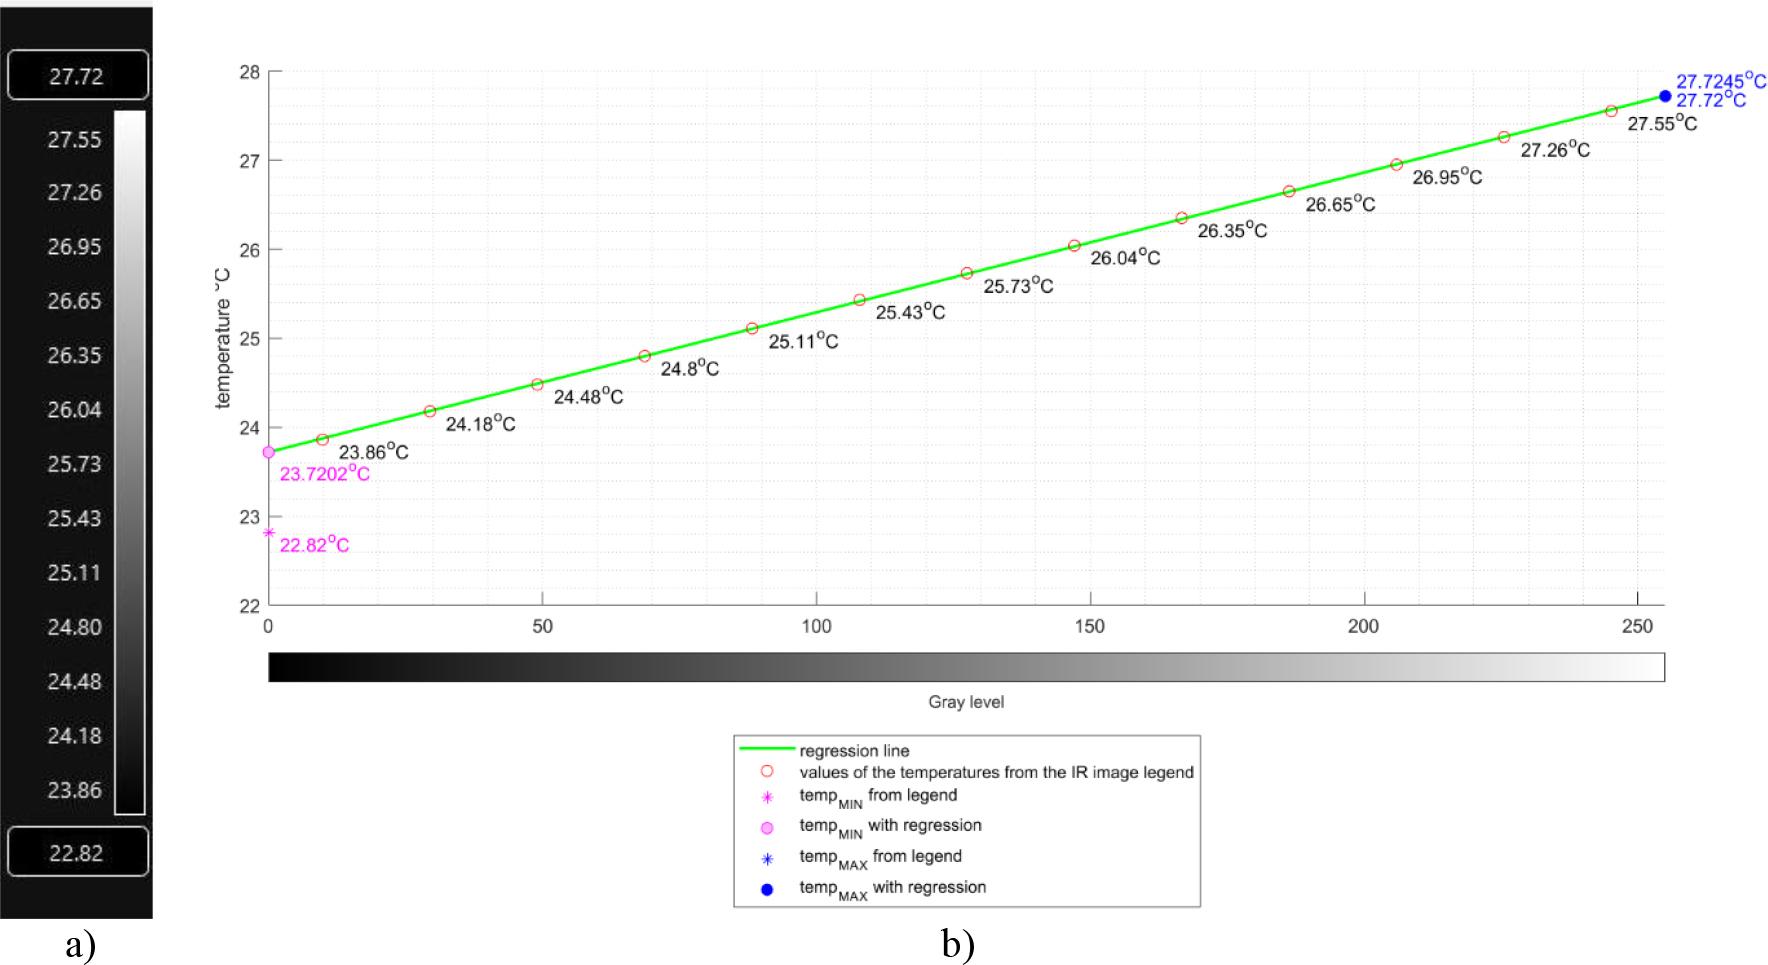
Figure no. 4:
Figure no. 5:
Figure no. 6:
Figure no. 7:
Figure no. 8:
Figure no. 9:
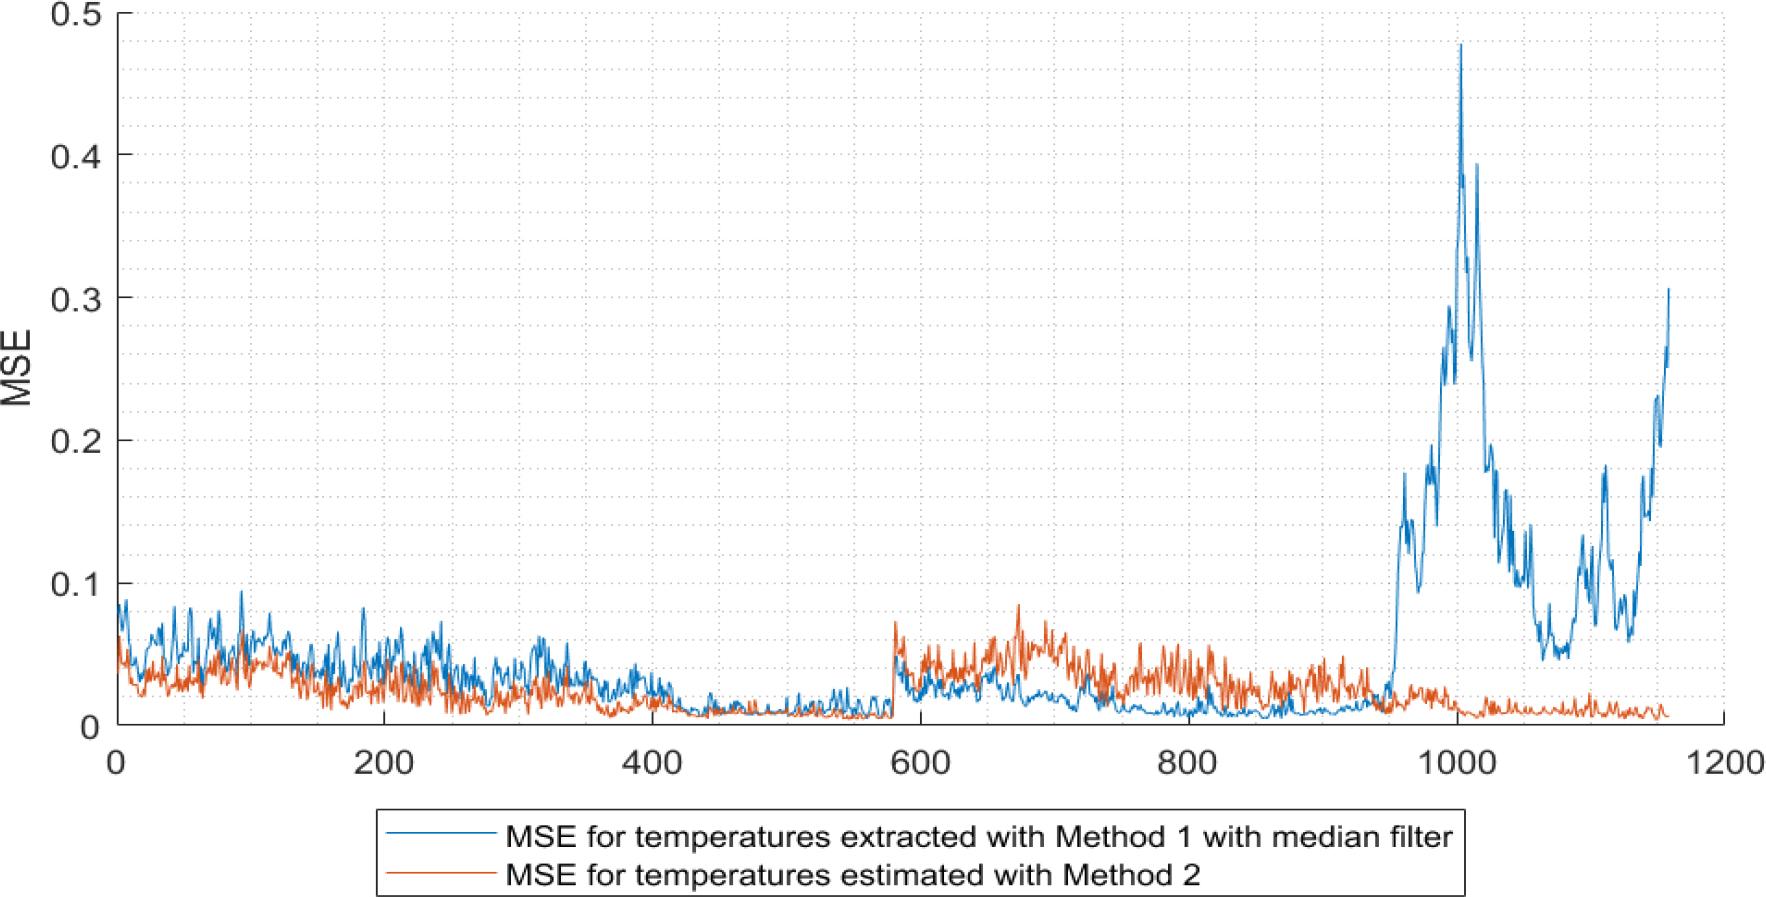
The mean values for MSE and R2
| Method to determine the tempMin and tempMax | MSEvideo | |
|---|---|---|
| Method 1 (ch. 3.1.a) without median filter | 0.0562 | 0.9668 |
| Method 1 (ch. 3.1.a) with median filter | 0.0490 | 0.9710 |
| Method 2 (ch. 3.1.b) | 0.0238 | 0.9861 |