

Figure no. 1:
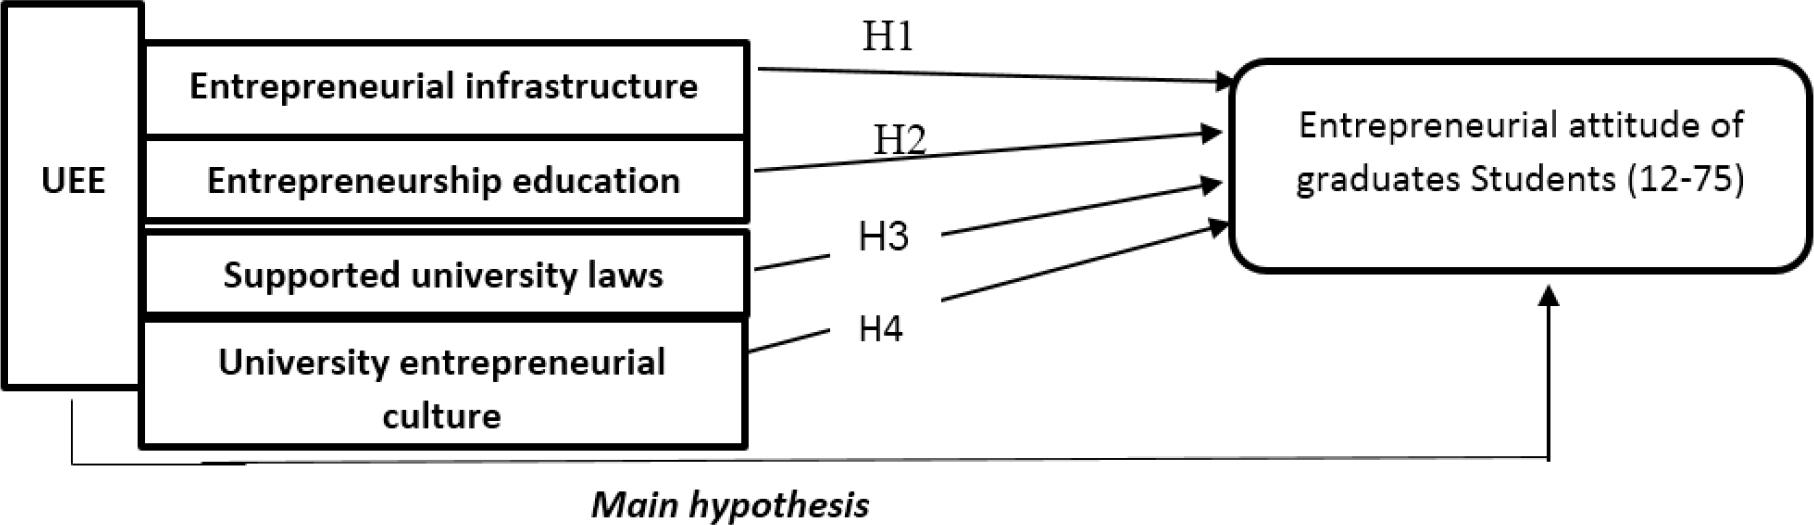
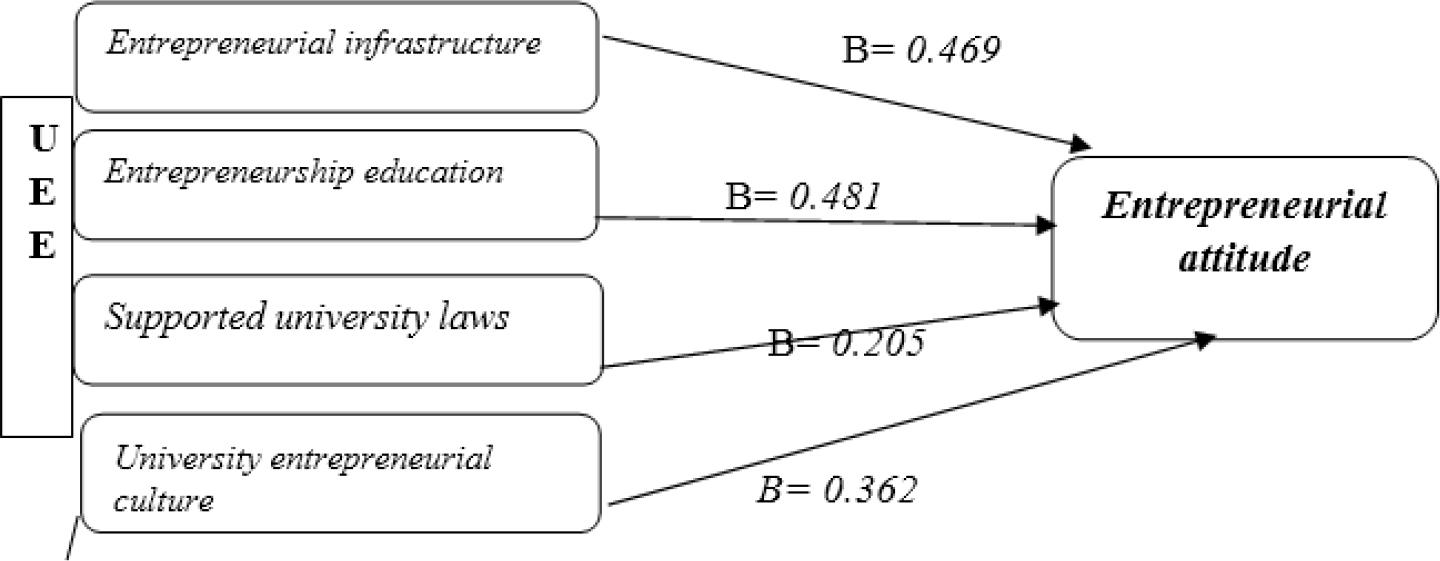
Figure no. 2:
Coefficient of Cronbach’s alpha
| Variables | Items | The Cronbach’s alpha value |
|---|---|---|
| University entrepreneurial ecosystem | 12 | 0.796 |
| Entrepreneurial attitude | 9 | 0.754 |
| All variables | 21 | 0.843 |
Descriptive Statistics for Axes
| Dimensions | Average | Std. Dev | Ranking | Arrangement |
|---|---|---|---|---|
| Entrepreneurial infrastructure | 3.700 | 0.562 | 2 | high |
| Entrepreneurship education | 3.610 | 0.644 | 4 | high |
| Supported university laws | 3.460 | 0.600 | 5 | high |
| University entrepreneurial culture | 3.680 | 0.568 | 3 | high |
| Entrepreneurial Attitude | 3.780 | 0.468 | 1 | high |
A multiple regression analysis to investigate how entrepreneurial attitude is affected by university Entrepreneurial ecosystem
| University entrepreneurial ecosystem | B value | Sig | constant | R | R2 | F value | Sig |
|---|---|---|---|---|---|---|---|
| Entrepreneurial infrastructure | 0.469 | 0.000 | |||||
| Entrepreneurship education | 0.481 | 0.001 | |||||
| Supported university laws | 0.205 | 0.001 | 2.527 | 0.600 | 0.360 | 22.510 | 0.000 |
| University entrepreneurial culture | 0.362 | 0.000 | |||||
Pearson correlation coefficient
| Variables | Correlation coefficient | Sig |
|---|---|---|
| University entrepreneurial ecosystem | 0.675** | 0.000 |
| Entrepreneurial attitude | 0,662** | 0.000 |