

Figure no. 1:
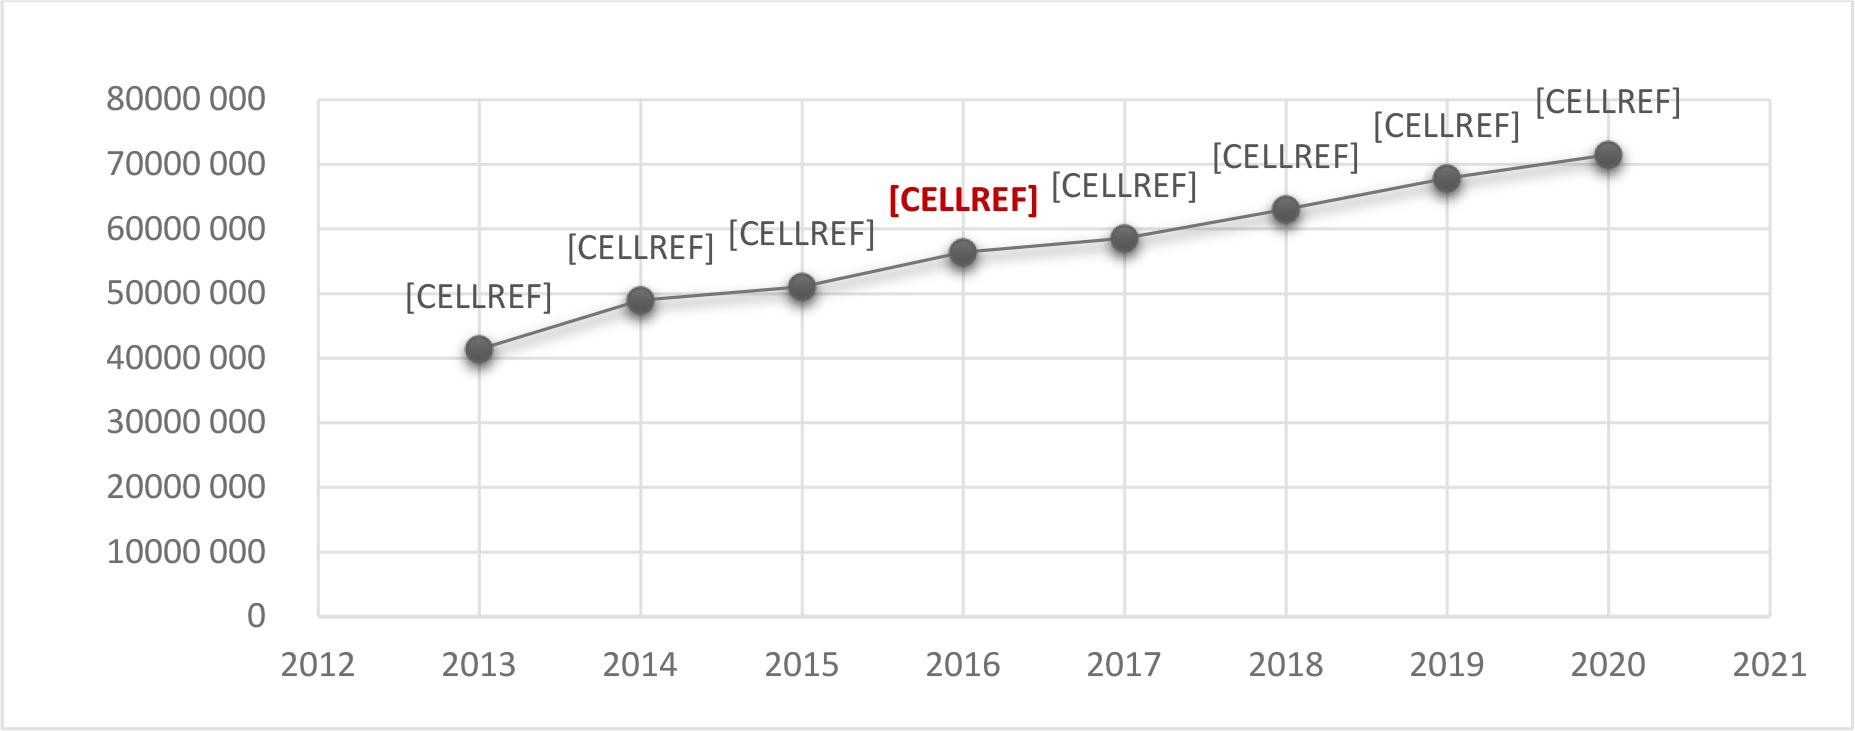
Figure no. 2:
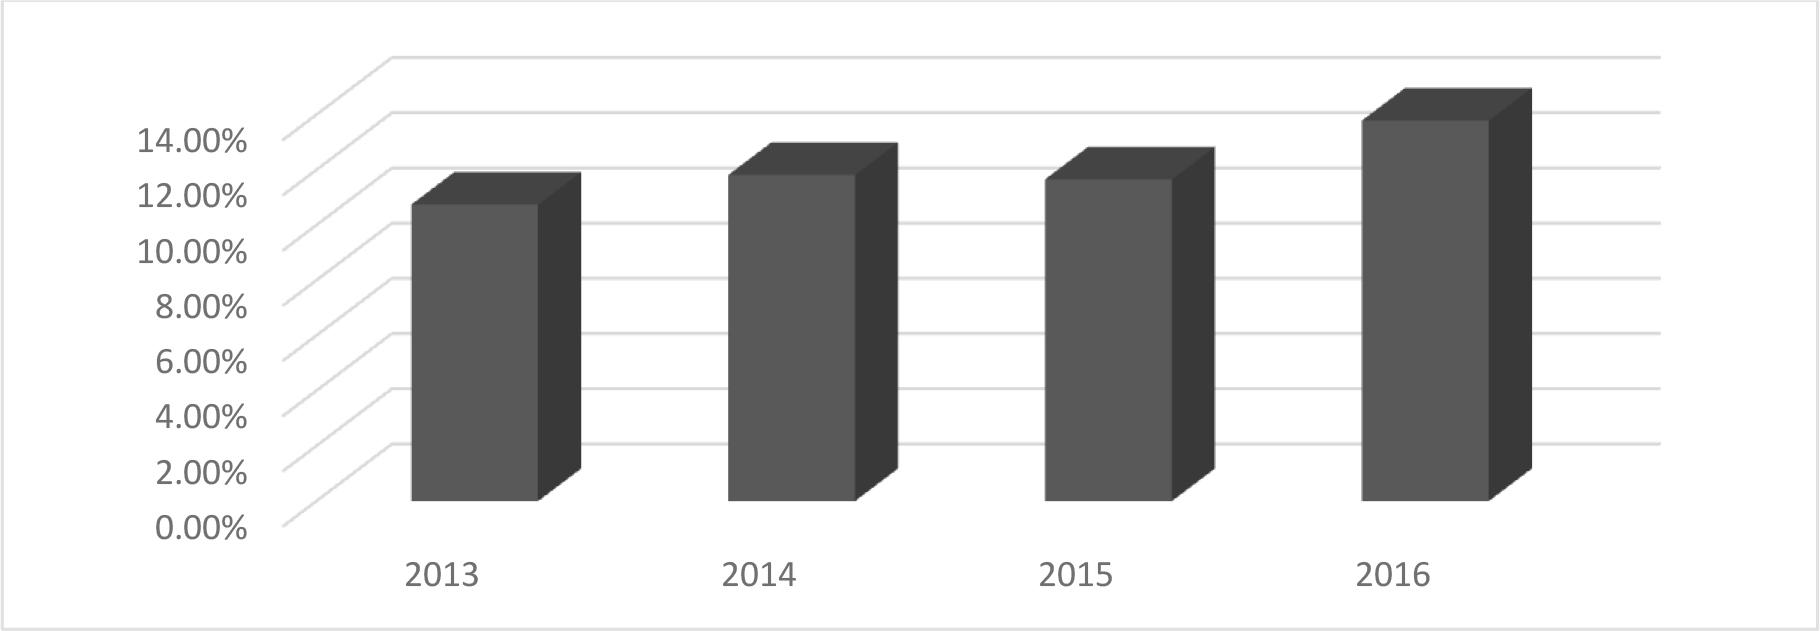
Figure no. 3:
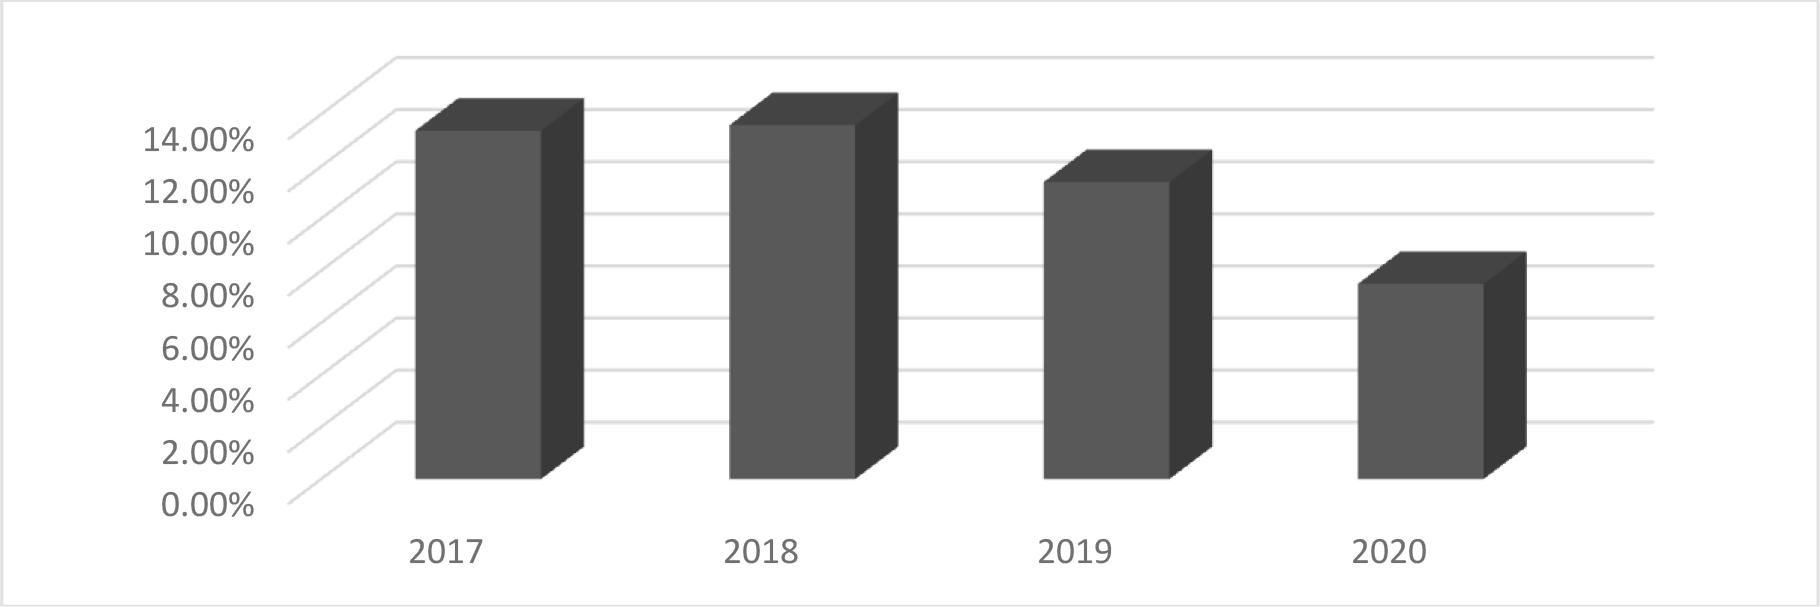
Figure no. 4:
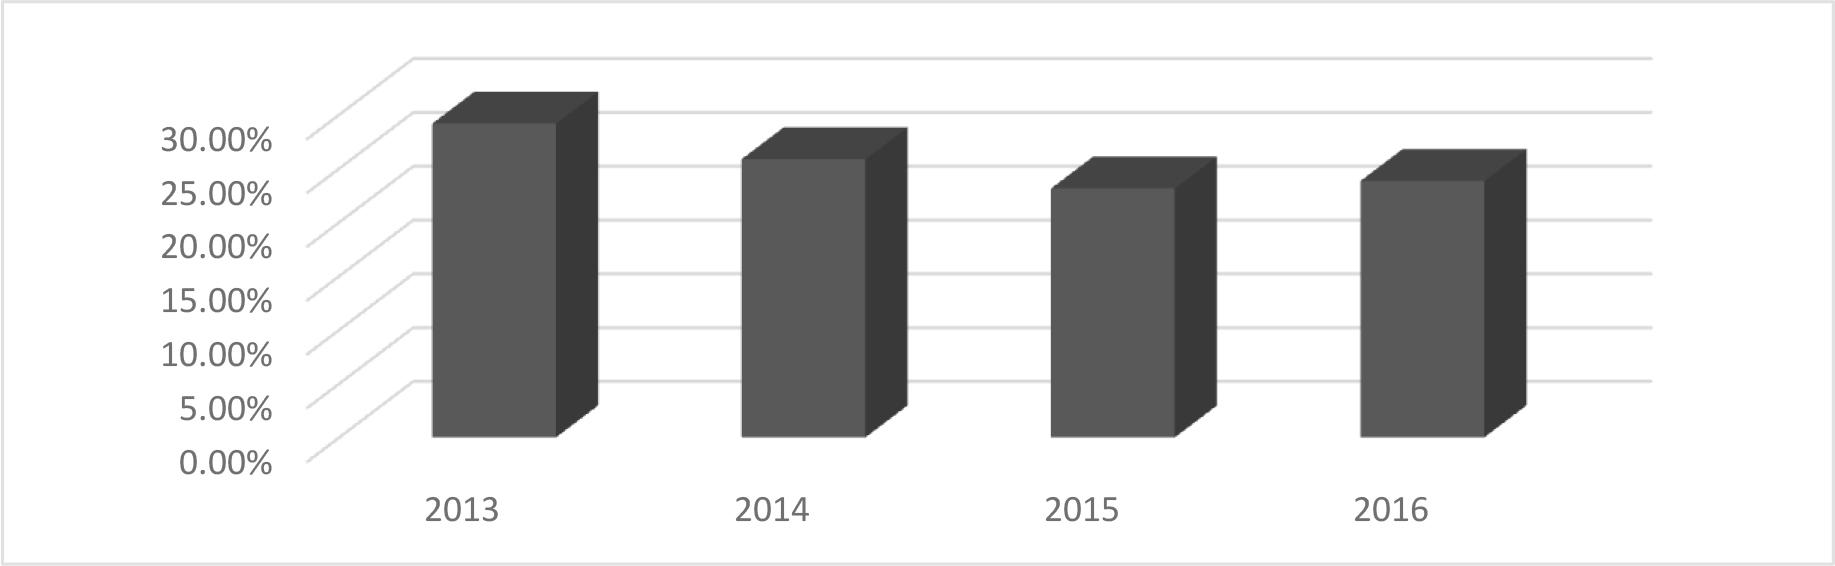
Figure no. 5:
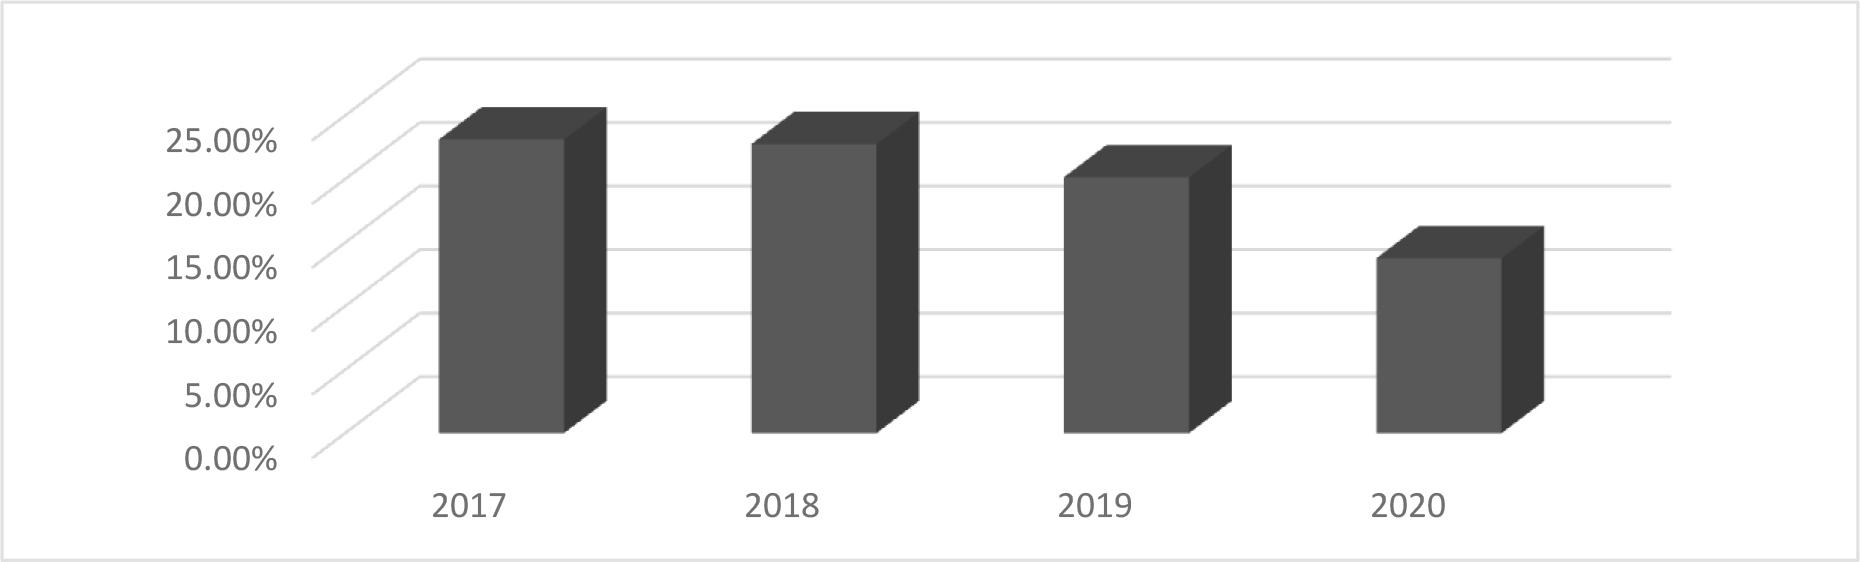
Figure no. 6:
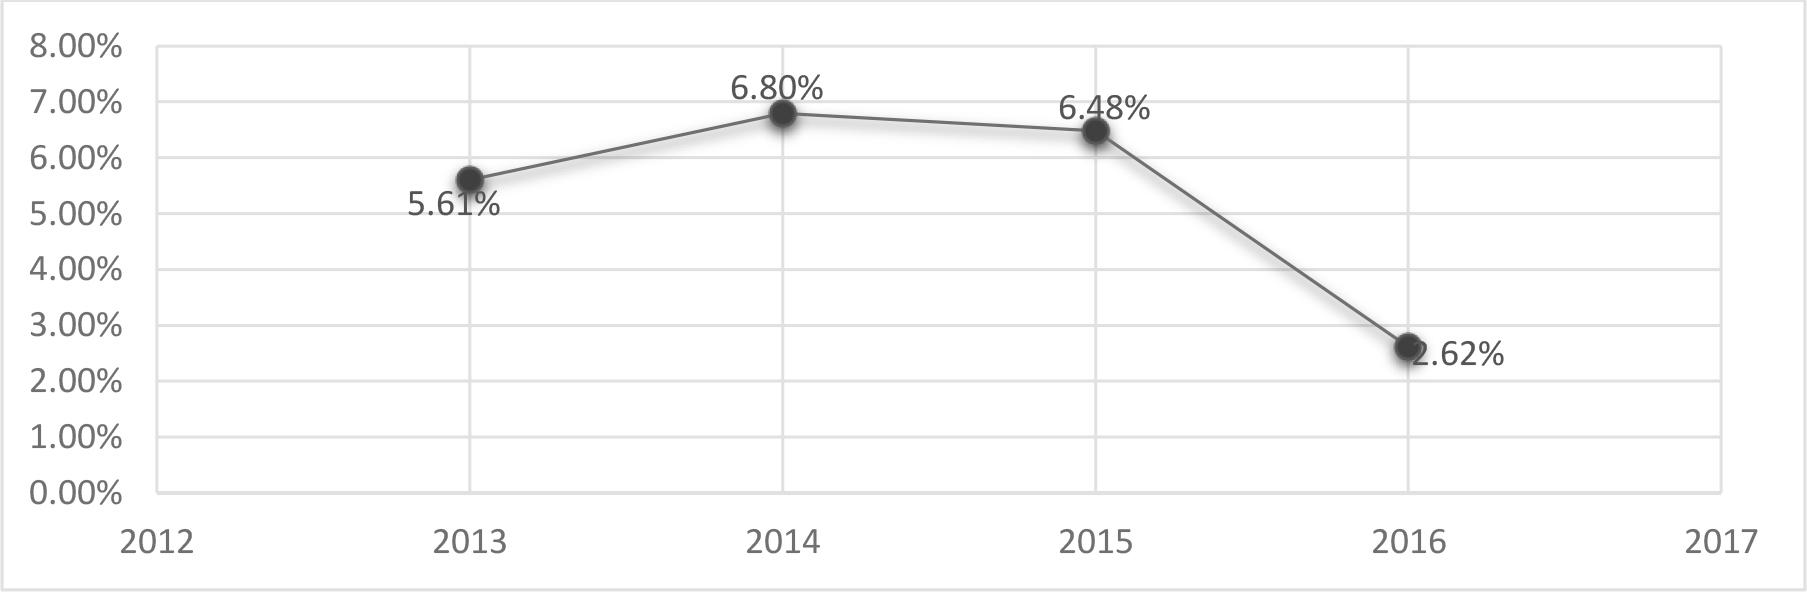
Figure no. 7:
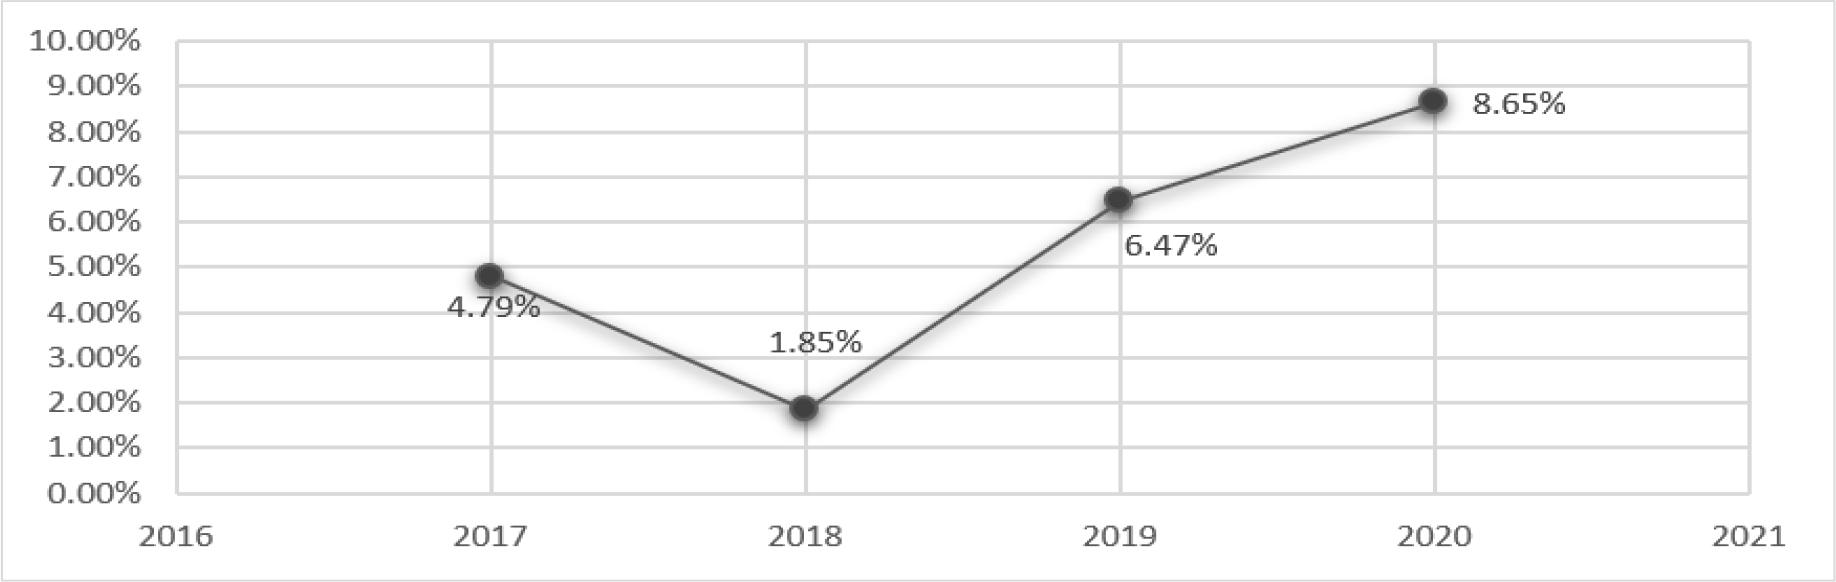
Figure no. 8:
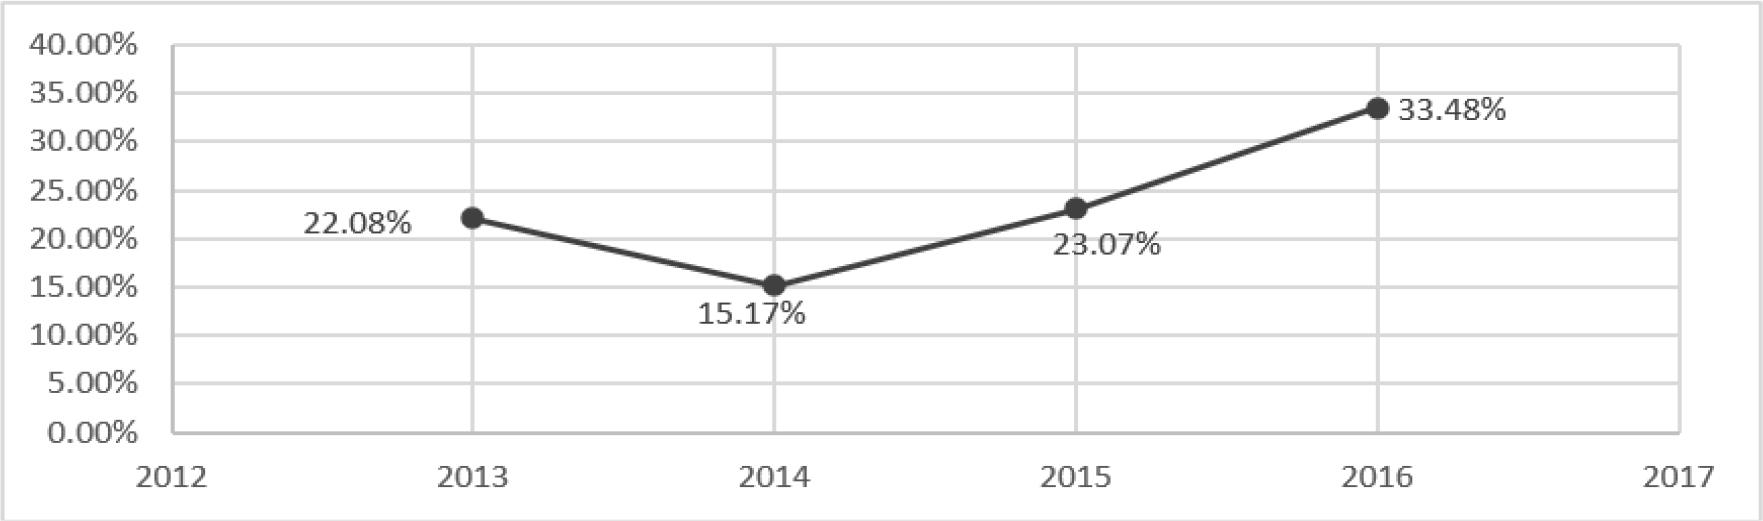
Figure no. 9:
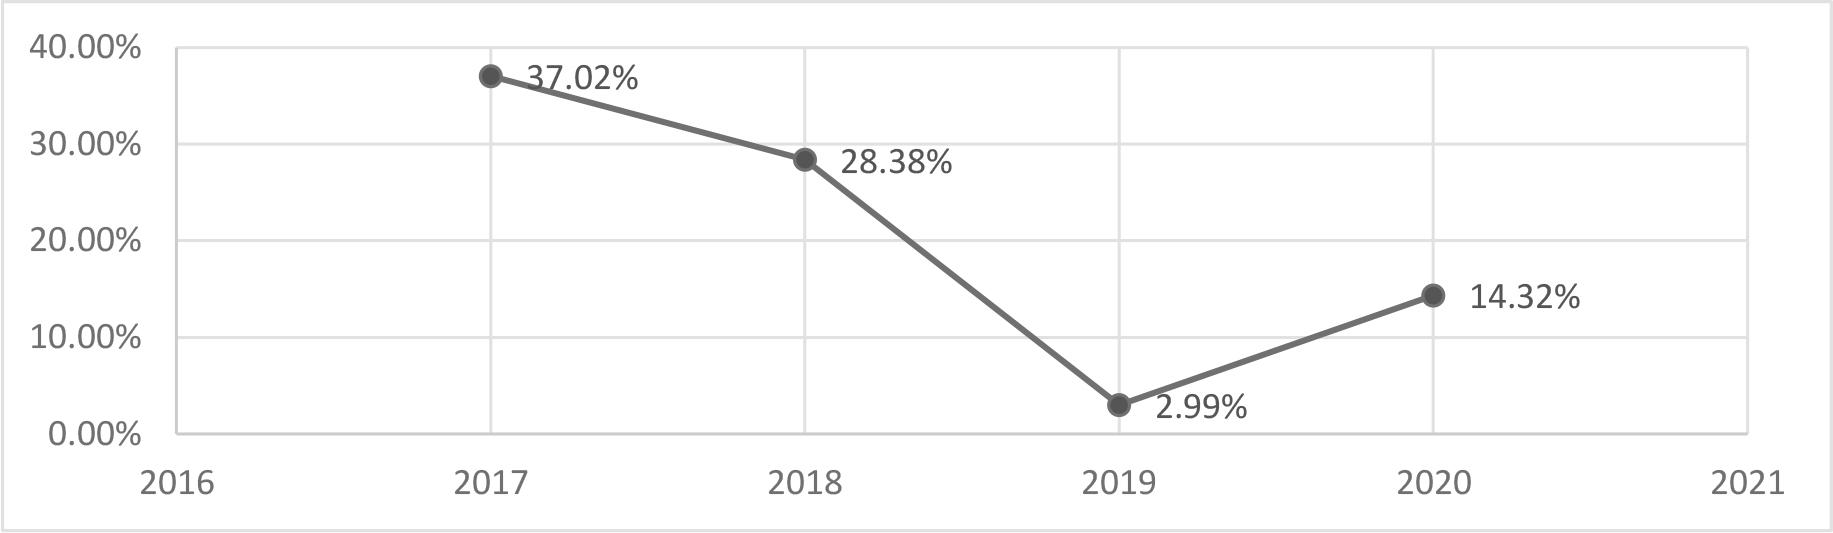
Figure no. 10:
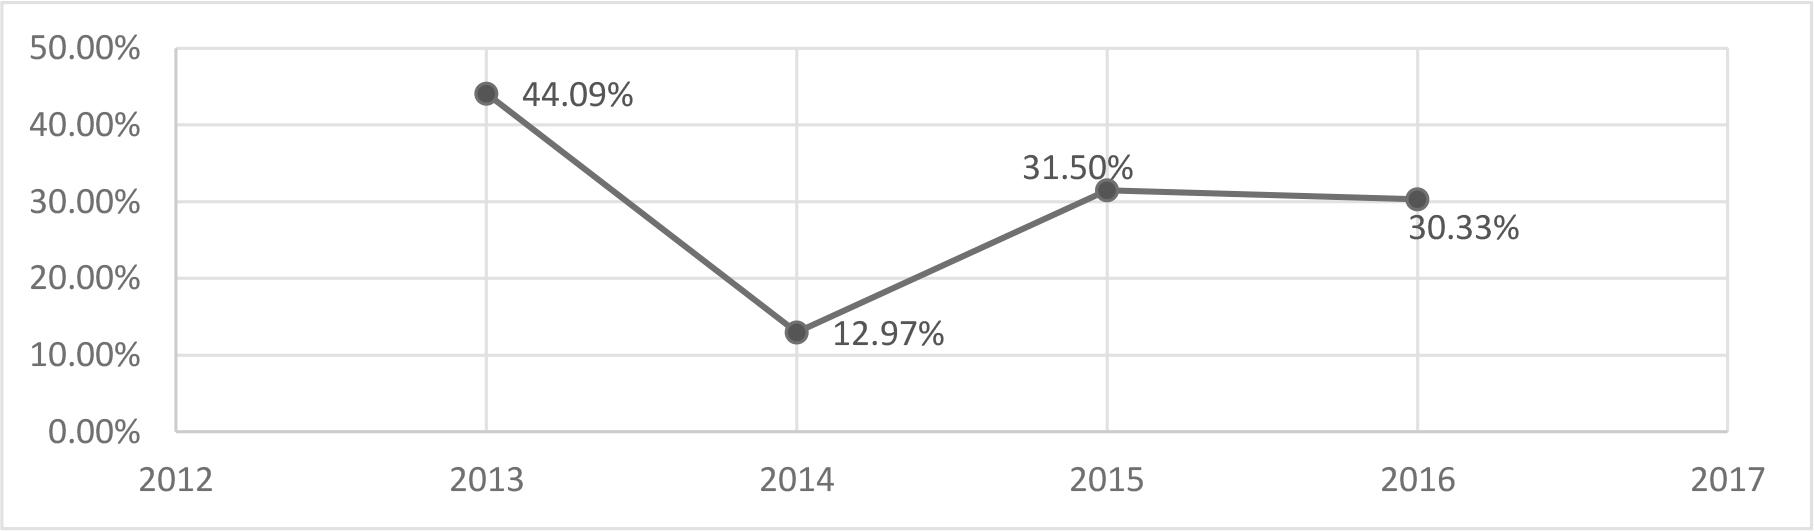
Figure no. 11:
Turnover evolution from 2017 to 2020 (In thousands of DZD)
| Year | 2017 | 2018 | 2019 | 2020 |
|---|---|---|---|---|
| Amount | 58 567 782 | 63 055 000 | 67 838 000 | 71 475 000 |
| % | 3,89% | 7,66% | 7,59% | 5,36% |
| Average | 6,12% | |||
Turnover evolution from 2013 to 2016 (In thousands of DZD)
| Year | 2013 | 2014 | 2015 | 2016 |
|---|---|---|---|---|
| Amount | 41 368 300 | 48 943 049 | 51 042 777 | 56 376 333 |
| % | 17,34% | 18,31% | 4,29% | 10,45% |
| Average | 12,60% | |||
BIOPHARM’s data sheet
| Corporate name | BIOPHARM |
| Starting date of activity | October 14, 1991 |
| Legal form | Joint stock company (SPA) |
| Share capital | 5.104.375.000 DZD, divided into 25 521 875 shares |
| Head office | 18, Rue de la zone industrielle, Route de la gare, Haouche Mahieddine, Réghaia, Wilaya of Algiers |
| Field of activity | Manufacturing, packaging, and marketing of pharmaceutical products |
| Geographical presence | Algeria (Algiers, Blida, Oran, Tizi Ouzou, Ouargla, Sétif) |
| Listing procedure | Initial Public Offering (IPO) at fixed price |
| Type of securities | Common shares |
| Quantity offered | Minimum: 5 104 375 shares Maximum: 5 120 375 shares |
| Total value of the offering | Between 6.252.859.375 DZD and 6.270.499.375 DZD |
| Sale price | 1,225 DZD per share |
| Offer period | From 13/03/2016 to 23/03/2016 (extendable with market authority approval) |
| Legal form of shares | Book-entry shares, identifiable bearer shares, or registered shares |
| Dividend entitlement date | On the settlement date of shares |
| Lead manager / Underwriting syndicate | BEA, BADR, BDL, BNA, BNPPED, CNEP-B, CPA, SGA, and TELLMarkets |
Return on assets (ROA) evolution over the period 2013-2016 (In thousands of DZD)
| Year | 2013 | 2014 | 2015 | 2016 |
|---|---|---|---|---|
| Net income | 3 395 000 | 3 854 368 | 4 453 571 | 5 552 092 |
| Total assets | 31 588 000 | 32 617 332 | 38 195 806 | 40 255 181 |
| ROA | 10,75% | 11,82% | 11,66% | 13,79% |
| Average | 12,00% | |||
The Cost of Debt evolution over the period 2017-2020 (In thousands of DZD)
| Year | 2017 | 2018 | 2019 | 2020 |
|---|---|---|---|---|
| Interest expenses | 861 495 | 290 000 | 129 000 | 921 000 |
| Total debt | 2 327 417 | 1 022 000 | 4 317 000 | 6 431 000 |
| Cost of Debt | 37,02% | 28,38% | 2,99% | 14,32% |
| Average | 20,68% | |||
The dividend payout ratio over the period 2013-2016 (In thousands of DZD)
| Year | 2013 | 2014 | 2015 | 2016 |
|---|---|---|---|---|
| Dividends | 1 497 000 | 500 000 | 1 403 000 | 1 684 000 |
| Net income | 3 395 000 | 3 854 368 | 4 453 571 | 5 552 092 |
| DPR | 44,09% | 12,97% | 31,50% | 30,33% |
| Average | 29,73% | |||
Return on assets (ROA) evolution over the period 2017-2020 (In thousands of DZD)
| Year | 2013 | 2014 | 2015 | 2016 |
|---|---|---|---|---|
| Net income | 3 395 000 | 3 854 368 | 4 453 571 | 5 552 092 |
| Equity | 11 641 000 | 14 906 572 | 19 252 142 | 23 297 757 |
| ROE | 29,16% | 25,86% | 23,13% | 23,83% |
| Average | 25,50% | |||
Financial Return (ROE) Evolution over the period 2017-2020 (In thousands of DZD)
| Year | 2017 | 2018 | 2019 | 2020 |
|---|---|---|---|---|
| Net income | 6 498 667 | 7 525 000 | 7 604 000 | 5 570 000 |
| Equity | 28 111 387 | 33 069 000 | 37 737 000 | 40 416 000 |
| ROE | 23,12% | 22,76% | 20,15% | 13,78% |
| Average | 19,95% | |||
The Debt Ratio evolution over the period 2017-2020 (In thousands of DZD)
| Year | 2017 | 2018 | 2019 | 2020 |
|---|---|---|---|---|
| Bank Debt | 2 327 417 | 1 022 000 | 4 317 000 | 6 431 000 |
| Total Balance Sheet | 48 592 810 | 55 387 000 | 66 700 000 | 74 336 000 |
| Debt Ratio | 4,79% | 1,85% | 6,47% | 8,65% |
| Average | 5,44% | |||
The impact of listing on Biopharm company
| Ratio’s | Turnover | ROA | ROE | Debt Ratio | Cost of debt | DPR |
|---|---|---|---|---|---|---|
| Impact | Negative | Negative | Negative | Positive | Positive | Negative |
The Debt Ratio evolution over the period 2013-2016 (In thousands of DZD)
| Year | 2013 | 2014 | 2015 | 2016 |
|---|---|---|---|---|
| Bank Debt | 1 771 000 | 2 217 894 | 2 476 445 | 1 053 923 |
| Total Balance Sheet | 31 588 000 | 32 617 332 | 38 195 806 | 40 255 181 |
| Debt Ratio | 5,61% | 6,80% | 6,48% | 2,62% |
| Average | 5,38% | |||
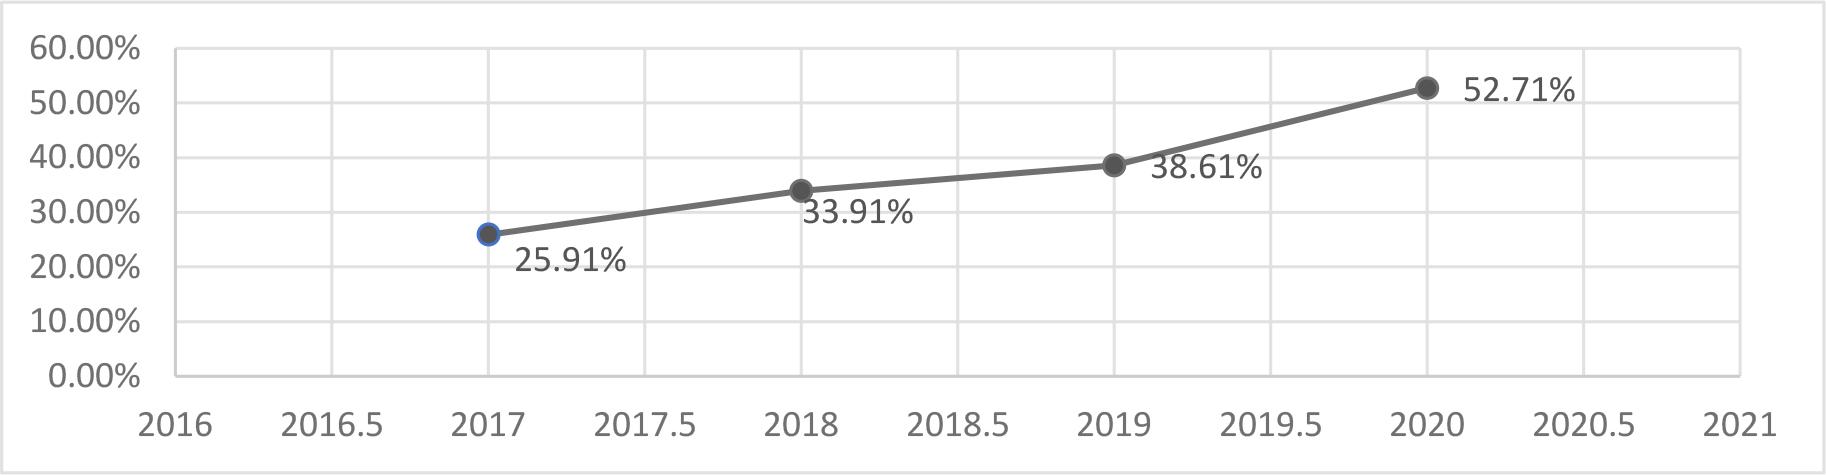
The dividend payout ratio over the period 2017-2020 (In thousands of DZD)
| Year | 2017 | 2018 | 2019 | 2020 |
|---|---|---|---|---|
| Dividends | 1 684 000 | 2 552 000 | 2 936 000 | 2 936 000 |
| Net income | 6 498 667 | 7 525 000 | 7 604 000 | 5 570 000 |
| DPR | 25,91% | 33,91% | 38,61% | 52,71% |
| Middle | 37,79% | |||
The Cost of Debt evolution over the period 2013-2016 (In thousands of DZD)
| Year | 2013 | 2014 | 2015 | 2016 |
|---|---|---|---|---|
| Interest expenses | 391 000 | 336 515 | 571 286 | 352 803 |
| Total debt | 1 771 000 | 2 217 894 | 2 476 445 | 1 053 923 |
| Cost of Debt | 22,08% | 15,17% | 23,07% | 33,48% |
| Average | 23,45% | |||