

The financial market is a meeting place for agents who have financing needs and others who have the capacity to finance them, by issuing financial securities. It is therefore a direct financing tool and a nonintermediated financing method. Today, the financial market has become the most popular source of financing, playing a significant role in the global economy by facilitating the transition from a debt-based economy to a market economy.
An initial public offering (IPO) involves accessing a capital market for the first time and obtaining a public listing. This operation is generally requested by companies to diversify their sources of financing, with the aim of strengthening both internal and external growth. It also affects the company’s financial structure as well as its short- and long-term performance.
An IPO is a major strategic decision in a company’s life. It enables a company to raise funds on the financial market by opening its capital to the public. In the Algerian context, this operation is still uncommon, raising questions about its real benefits for local companies.
This article examines the impact of the IPO on BIOPHARM’s financial performance, using several key indicators such as turnover evolution, Return on Assets (ROA), Return on Equity (ROE), Debt ratio, Cost of Debt and dividend payout ratio (DPR).
By addressing the following issue, we aim to examine the impact of the initial public offering (IPO) on the financial performance of Algerian companies, based on the following main research question:
What impact does the initial public offering (IPO) have on the financial performance of BIOPHARM?
The fundamental research questions are as follows:
- –
What is the impact of the IPO on the turnover evolution?
- –
What is the impact of the IPO on the Return on Assets (ROA)?
- –
What is the impact of the IPO on the Return on Equity (ROE)?
- –
What is the impact of the IPO on the debt ratio?
- –
What is the impact of the IPO on the cost of debt?
- –
What is the impact of the IPO on the dividend payout ratio?
To answer these research questions, we will test the following hypotheses:
H1: The IPO leads to an increase in the turnover evolution.
H2: The IPO has a positive impact on the Return on Assets (ROA).
H3: The IPO has a positive impact on the Return on Equity (ROE).
H4: The IPO contributes to a reduction in the debt ratio.
H5: The IPO helps reduce the cost of debt.
H6: The IPO supports a better dividend distribution policy.
This study aims to analyze the impact of the IPO on the financial performance of the company BIOPHARM, through a quantitative approach, using financial analysis tools to compare indicators before and after the IPO.
According to Olivier Picon (2000), “ The stock market is a place of exchange. There are two types of stock exchange: the labor exchange and the commodities and raw materials exchange, but the term ‘stock exchange ’ designates the place where exchanges and negotiations of securities take place. In an abstract definition, stock exchange means: the market for these securities irrespective of any particular location ”.
The stock exchange refers to the market for issuing and trading securities. As a part of the capital market, it provides companies with a mechanism to access savings by facilitating the interaction between economic agents with surplus funds and those in need of financing. In doing so, the stock exchange contributes to the economic development (Labed, 2022).
The primary market: includes all public offerings for savings, the issuance of financial instruments for distribution to a wide range of investors. Its role is to finance investment: to raise funds, the issuer sells a business project on the market, offering investors a share in the company’s anticipated future cash flows (Fleuriet & Simon, 2003).
The secondary market or stock market: the secondary market is a resale and trading market that organizes transactions involving securities that have already been created and placed via the primary market (Elaarem & Halima, 2016).
Conceptually, the primary market differs from the secondary market. The former is the market for issuing new securities, while the latter is the market for trading securities that have already been issued. In other words, the primary market is the ‘new’ market and the secondary market is the ‘second-hand’ market (Fleuriet & Simon, 2003).
Initial Public Offerings (IPO) is considered as an important perspective for any company, as it helps it to raise its capital and attracts much attention from investors, both existing and potential (Khadim & Babar, 2021). There are many reasons for listing a company.
- –
The widening of share ownership is one of the major contributions of an initial public offering (IPO). It allows institutional investors to enter the company’s capital with an investment-oriented approach and the potential to provide valuable financial support (Beztouh & Boulahouat, 2023). As a result, the company shifts from debt-based and/or selffinancing to equity-based financing, which may lead to a reduction in its debt and financing costs (Lalali, 2020). This implies a strengthening of equity capital, which often results in increased borrowing capacity and a greater ability to negotiate new financing at lower costs (Mahieux, 2016; Fan, 2019; Fadil, 2016).
- –
An Initial Public Offering (IPO) requires a minimum level of reliability and transparency in the company’s financial statements, as well as broader efforts in financial communication aimed at current or potential external investors. This leads to the implementation of a modern corporate governance system, involving internal control mechanisms and the professionalization of the company’s administrative and management bodies.
- –
An Initial Public Offering (IPO) is often a key first step in an external growth strategy. By increasing their capital during this operation, companies have the financial resources they need to acquire existing entities. Furthermore, the shares of a listed company constitute a tradable currency, enabling acquisitions to be made, in whole or in part, through an exchange of shares. This approach enables the company to avoid excessive indebtedness or drawing on its cash reserves (Ravaz, 2003).
- –
The Initial Public Offering (IPO) helps to enhance a company’s reputation and strengthening its credibility with its partners on the national and international levels. It can also enhance company’s credibility and recognition among customers, suppliers, and employees (Canina & Gibson, 2003).
Certainly, an Initial Public Offering (IPO) offers many advantages, but going public can also involve several unintended costs for the company, such as:
- –
An IPO imposes a transparency requirement on companies, particularly through the regular publication of their financial statements. While this strengthens investor confidence, it also exposes the company to the risk of losing confidentiality, as competitors may gain access to sensitive information that could weaken its competitive position.
- –
An Initial Public Offering (IPO) represents a significant workload for all parties involved in the operation, including financial intermediaries, auditors, regulatory authorities, communication advisors, and legal advisors. The company itself must mobilize not only its executives but also certain employees and shareholders (Ravaz, 2003).
- –
The undervaluation of securities at the time of listing refers to the gap between the offer price set by the company and what the market would consider a fair, equilibrium price.
Many studies have shown that companies often underestimate the issue price of their securities. This usually leads to a positive difference between the offer price and the stock’s initial trading price.
Researchers like Aggrawal & Rivoli (1990) examined the long-term performance of newly listed securities and found persistent underperformance over time.
As Ritter points out, “the issue price may not be as low as we think; rather, it’s the initial trading price that tends to be overestimated” (Ritter, 1991).
- –
In addition to the listing fees charged by market institutions (COSOB, SGBV, IOB, Algérie Clearing), an IPO also incurs a number of additional costs, including:
Fees for the second statutory auditor.
Costs related to financial reporting and the publication of financial information,
Costs of convening shareholders’ general meetings.
Placement commissions paid to the lead financial intermediary and the banks forming the underwriting syndicate.
Financial performance analysis is the technique of evaluating the financial health of a company by establishing proper relationships between the items of financial statements. The financial information of a company is primarily provided in its financial statements i.e., Profit and Loss Account and Balance Sheets (Konwar, 2023).
In other words, it is the process of identifying the financial strengths and weaknesses of the firm by establishing a proper connection between recorded items and the profit and loss account. It also helps with short-term and long-term forecasting, and growth is identified with the assistance of monetary performance analysis (Srinivasan, Rathika & Nivedha, 2020).
Turnover analysis – Turnover is the total of all sales made by the company over a specific period, generally the calendar year. This indicator is very important as it reflects customer satisfaction. Any increase in turnover indicates higher customer satisfaction, a growing market share for the company, greater wealth creation, and economic development.
Economic return (return on assets ROA) – The ROA measures the company’s ability to generate profits from its sales or available assets (Mesrati, 2021). When a company’s assets are used effectively, its profit margin increases. A higher return on assets ratio is a positive sign, as it indicates that the company is generating profits efficiently. This can encourage investors to engage in stock transactions, as they will perceive the company’s performance as stronger and its level of uncertainty as lower (Ramadhan, Ediano & Leon, 2023) ROA can be calculated as follows:
Financial return (Return on Equity ROE) – The ROE measures the common shareholders’ return on investment in the company. The higher this return, the better off is the owners (Al-Nsour, 2019). The ROE can be calculated as follows:
Analysis of the Debt Ratio – The debt ratio represents the share of assets financed by debt. This ratio may be high if the company finances a significant portion of its assets through borrowing. In such a case, the company is considered not financially independent, as it is over-indebted. Conversely, if the ratio is low, the company is considered to have low debt and therefore to be more financially independent. This cost of debt is calculated as follows:
Analysis of the Cost of Debt – The cost of debt is mainly composed of the borrowing interest rates. Going public allows a company to diversify its sources of financing and strengthen the upper structure of its balance sheet. These two factors help reduce the borrowing rates of various loans, which in turn lowers the overall average cost of debt. This cost of debt is calculated as follows:
Analysis of the dividend payout ratio (DPR) – The dividend payout ratio is the proportion of earnings made available to the company’s shareholders. It is considered an outflow of resources for the company. This ratio helps determine whether a company is “generous” or not. It consists of comparing the amount of dividends distributed to the company’s net profit (Elaarem & Halima, 2016).
The comparative analysis of financial performance is based on the main financial ratios derived from Biopharm’s reports.
We selected the period 2013-2016 to study the first period, which includes the four years preceding the company’s introduction to the financial market, while the period 2017-2020 will be used to analyse the second phase, representing the four years immediately following the IPO.
Biopharm was founded in 1992 by its visionary founder, Abdelmadjid KERRAR, who took on the ambitious challenge of investing in Algeria’s pharmaceutical industry. With determination and perseverance, he embarked on a remarkable journey that has driven the company’s growth. Through strategic investments, Biopharm laboratories have become one of the leading players in the Algerian pharmaceutical sector.
Biopharm SPA present in different trades of the pharmaceutical industry, opens its capital to public saving by offering for sale 5 104 375 shares, representing 20% of its capital, at a price of 1 225 dinars per share. Biopharm SPA aims through this listing operation to continue the restructuring and diversification of company shareholding’s by associating new domestic investors (general public, institutional investors, employees…) and allowing it to ensure the sustainability of the company and facilitate its development.
BIOPHARM’s data sheet
| Corporate name | BIOPHARM |
| Starting date of activity | October 14, 1991 |
| Legal form | Joint stock company (SPA) |
| Share capital | 5.104.375.000 DZD, divided into 25 521 875 shares |
| Head office | 18, Rue de la zone industrielle, Route de la gare, Haouche Mahieddine, Réghaia, Wilaya of Algiers |
| Field of activity | Manufacturing, packaging, and marketing of pharmaceutical products |
| Geographical presence | Algeria (Algiers, Blida, Oran, Tizi Ouzou, Ouargla, Sétif) |
| Listing procedure | Initial Public Offering (IPO) at fixed price |
| Type of securities | Common shares |
| Quantity offered | Minimum: 5 104 375 shares Maximum: 5 120 375 shares |
| Total value of the offering | Between 6.252.859.375 DZD and 6.270.499.375 DZD |
| Sale price | 1,225 DZD per share |
| Offer period | From 13/03/2016 to 23/03/2016 (extendable with market authority approval) |
| Legal form of shares | Book-entry shares, identifiable bearer shares, or registered shares |
| Dividend entitlement date | On the settlement date of shares |
| Lead manager / Underwriting syndicate | BEA, BADR, BDL, BNA, BNPPED, CNEP-B, CPA, SGA, and TELLMarkets |
(Source: Author’s elaboration based on Biopharm’s and SGBV reports)
We will analyze the turnover evolution before and after the IPO.
– Turnover evolution before the IPO
Turnover evolution from 2013 to 2016 (In thousands of DZD)
| Year | 2013 | 2014 | 2015 | 2016 |
|---|---|---|---|---|
| Amount | 41 368 300 | 48 943 049 | 51 042 777 | 56 376 333 |
| % | 17,34% | 18,31% | 4,29% | 10,45% |
| Average | 12,60% | |||
(Source: Author’s calculations based on Biopharm’s reports)
Interpretation: During the period 2013-2016, prior to IPO, Biopharm recorded an increase in its turnover with an average growth rate of more than 12,60%.
– Turnover evolution after the IPO
Turnover evolution from 2017 to 2020 (In thousands of DZD)
| Year | 2017 | 2018 | 2019 | 2020 |
|---|---|---|---|---|
| Amount | 58 567 782 | 63 055 000 | 67 838 000 | 71 475 000 |
| % | 3,89% | 7,66% | 7,59% | 5,36% |
| Average | 6,12% | |||
(Source: Author’s calculations based on Biopharm’s reports)
Interpretation: An increase in Biopharm’s turnover was observed during the period 2017-2020, post IPO, with an average growth rate of 6,12%, reflecting a slowdown compared to the previous period (2013-2016).
These data are illustrated in Figure no.1 below.
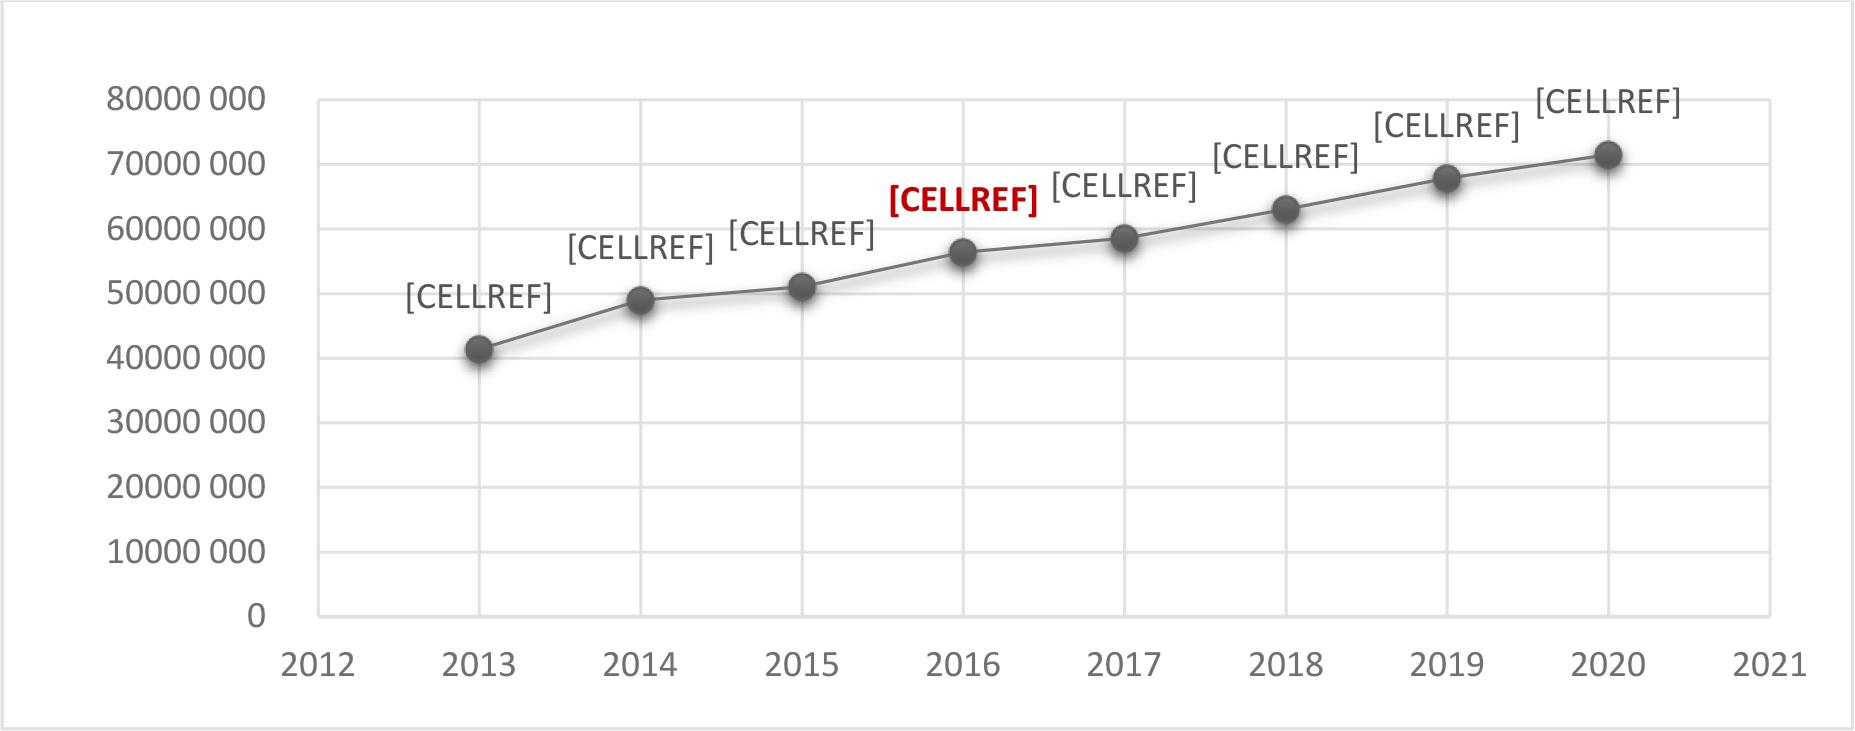
Turnover evolution from 2013 to 2020
(Source: Author’s calculations based on the data in Table no. 2 and no. 3)
Interpretation: The average growth rate decreased from 12,60% to 6,12%, reflecting a decrease of 6,47%. This indicates that the Initial Public Offering (IPO) had a negative impact on Biopharm turnover.
We will analyze the ROA before and after the IPO.
– Return on assets (ROA) before the IPO
Return on assets (ROA) evolution over the period 2013-2016 (In thousands of DZD)
| Year | 2013 | 2014 | 2015 | 2016 |
|---|---|---|---|---|
| Net income | 3 395 000 | 3 854 368 | 4 453 571 | 5 552 092 |
| Total assets | 31 588 000 | 32 617 332 | 38 195 806 | 40 255 181 |
| ROA | 10,75% | 11,82% | 11,66% | 13,79% |
| Average | 12,00% | |||
(Source: Prepared by the researcher based on the Biopharm and COSOB reviews)
These data are illustrated in Figure no. 2 below.
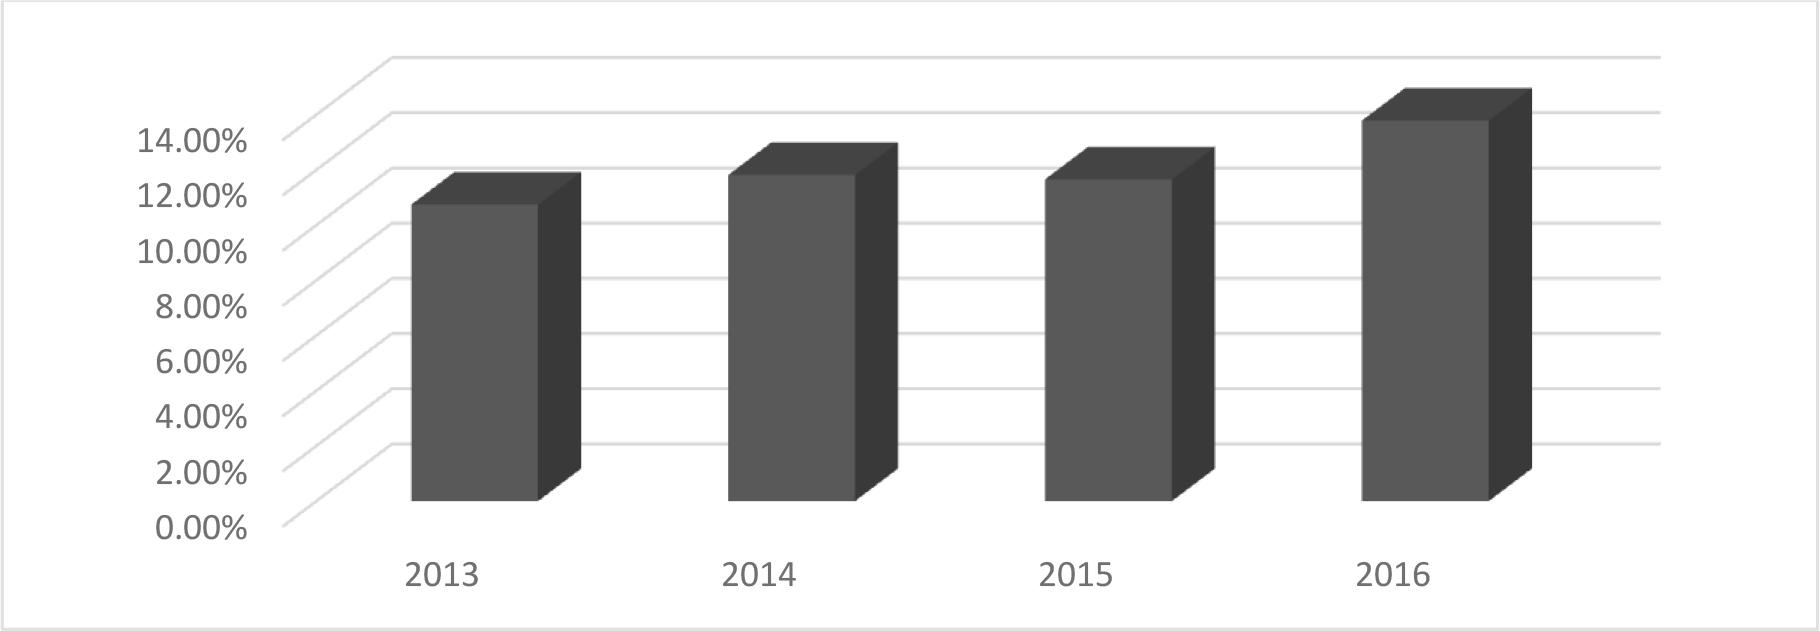
ROA evolution before the IPO
(Source: Author’s prepared based on the data in Table no. 4)
Interpretation: During the period 2013-2016, the return on assets (ROA) of Biopharm rose from 10,75% to 13,79%, reflecting better asset utilisation. On average, ROA was 12%, indicating improved performance before the IPO.
– Return on assets (ROA) after the IPO
Return on assets (ROA) evolution over the period 2017-2020 (In thousands of DZD)
| Year | 2017 | 2018 | 2019 | 2020 |
|---|---|---|---|---|
| Net income | 6 498 667 | 7 525 000 | 7 604 000 | 5 570 000 |
| Total assets | 48 592 810 | 55 387 000 | 66 700 000 | 74 336 000 |
| ROA | 13,37% | 13,59% | 11,40% | 7,49% |
| Average | 11,46% | |||
(Source: Author’s calculations based on the Biopharm and COSOB documents)
These data are presented in Figure no. 3.
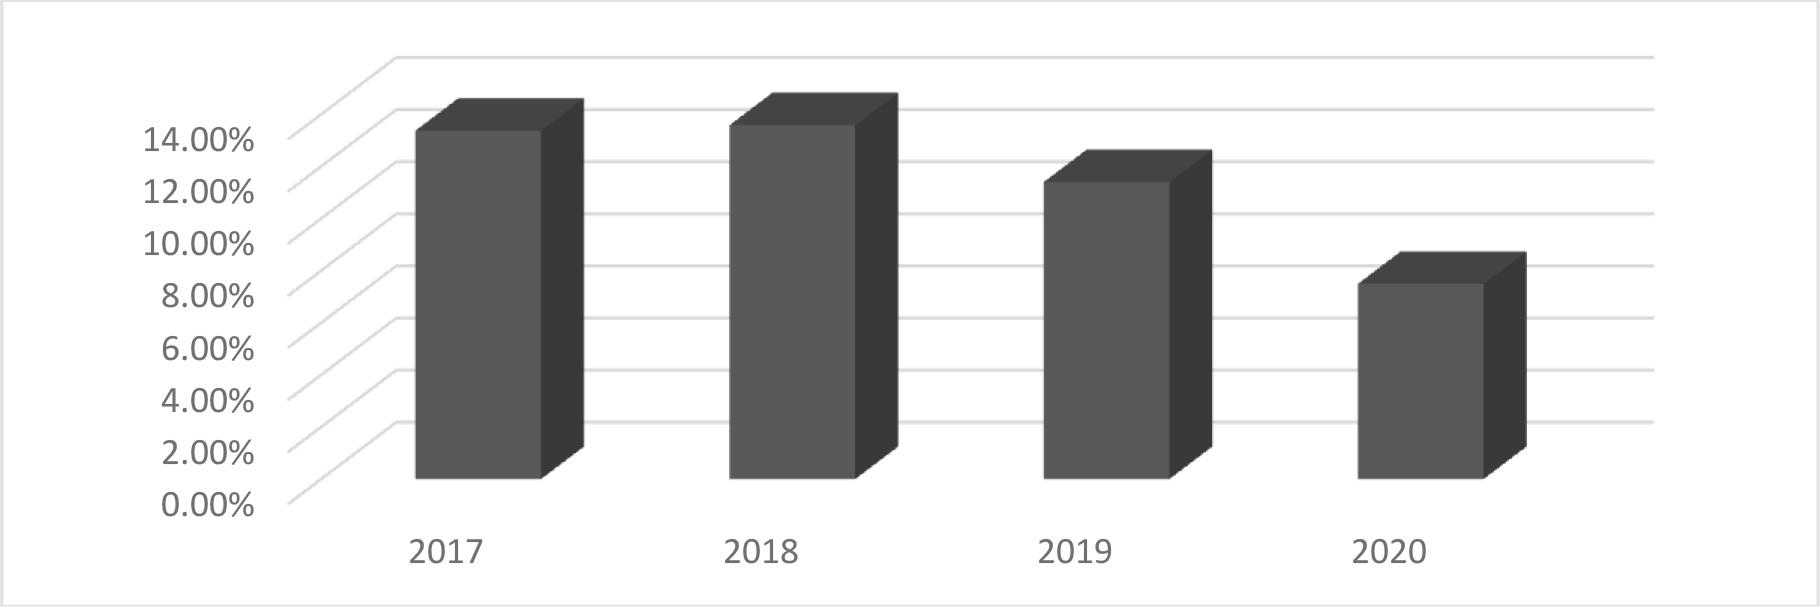
ROA evolution after the IPO
(Source: Author’s prepared based on the data in Table no. 5)
Interpretation: After the IPO, Biopharm ROA first increased, then declined from 13.37% in 2017 to 7.49% in 2020, showing a significant decline in profitability. The average ROA during this period was 11.46%, slightly lower than before the IPO.
We will analyze the return equity (ROE) before and after the IPO.
– Return on equity (ROE) before the IPO
Return on assets (ROA) evolution over the period 2017-2020 (In thousands of DZD)
| Year | 2013 | 2014 | 2015 | 2016 |
|---|---|---|---|---|
| Net income | 3 395 000 | 3 854 368 | 4 453 571 | 5 552 092 |
| Equity | 11 641 000 | 14 906 572 | 19 252 142 | 23 297 757 |
| ROE | 29,16% | 25,86% | 23,13% | 23,83% |
| Average | 25,50% | |||
(Source: Author’s calculations based on the Biopharm and COSOB documents)
These data are presented in Figure no. 4.
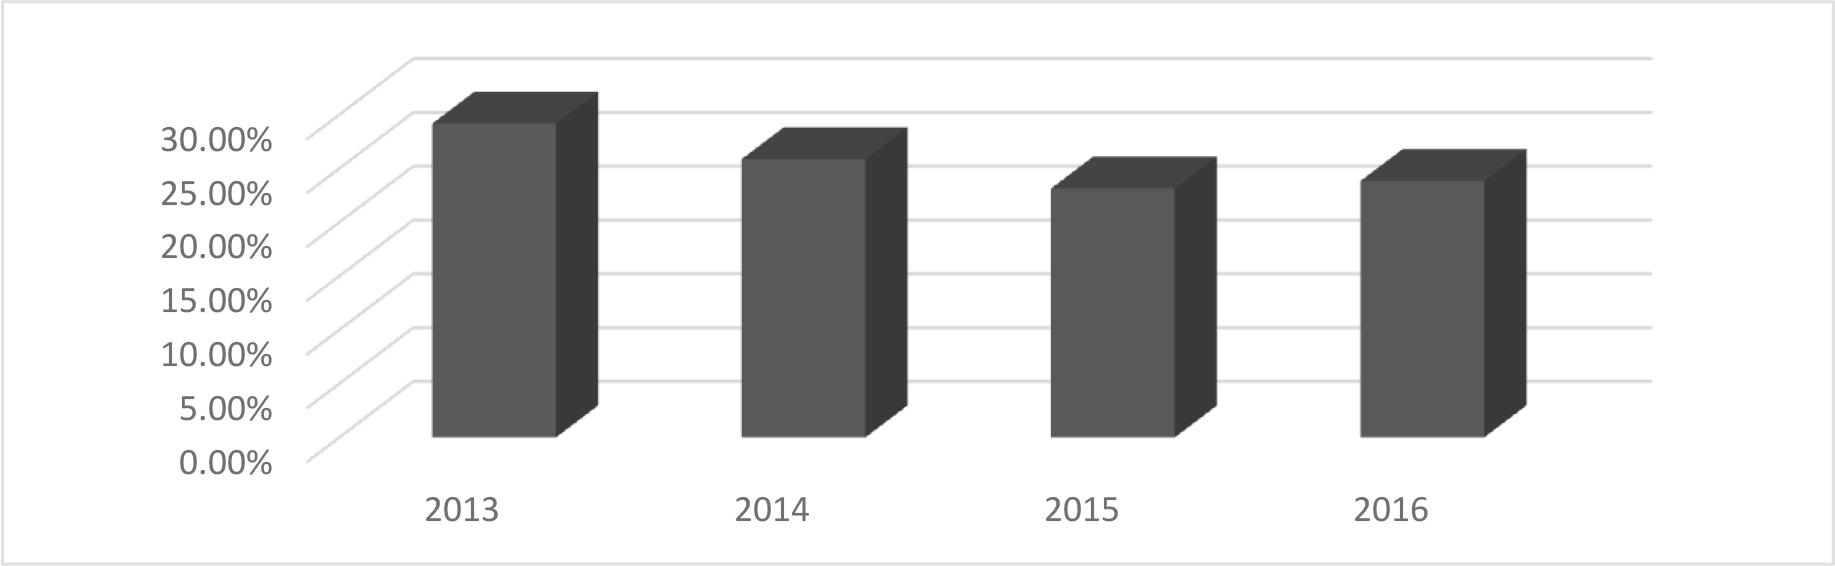
Return on equity (ROE) Evolution over the period 2013-2016
(Source: Author’s prepared based on the data in Table no. 6)
Interpretation: The Financial Return (ROE) of Biopharm showed a slight downward trend before the IPO. It decreased from 29.16% in 2013 to 23.83% in 2016, indicating a gradual decline in return on equity.
– Return on equity (ROE) after the IPO
Financial Return (ROE) Evolution over the period 2017-2020 (In thousands of DZD)
| Year | 2017 | 2018 | 2019 | 2020 |
|---|---|---|---|---|
| Net income | 6 498 667 | 7 525 000 | 7 604 000 | 5 570 000 |
| Equity | 28 111 387 | 33 069 000 | 37 737 000 | 40 416 000 |
| ROE | 23,12% | 22,76% | 20,15% | 13,78% |
| Average | 19,95% | |||
(Source: Author’s calculations based on the Biopharm and COSOB documents)
These data are illustrated in Figure no. 5 below.
Financial Return (ROE) evolution over the period 2017-2020
(Source: Author’s prepared based on the data in Table no.7)
Interpretation: The Financial Return (ROE) of Biopharm after the IPO, it decreased from 23,12% in 2017 to 13,78% in 2020, reflecting a steady decrease in return on equity. The average ROE during this period was 19.95%, lower than before the IPO. This shows that the IPO had no positive effect on the Biopharm financial return.
We will analyze the Debt Ratio before and after the IPO.
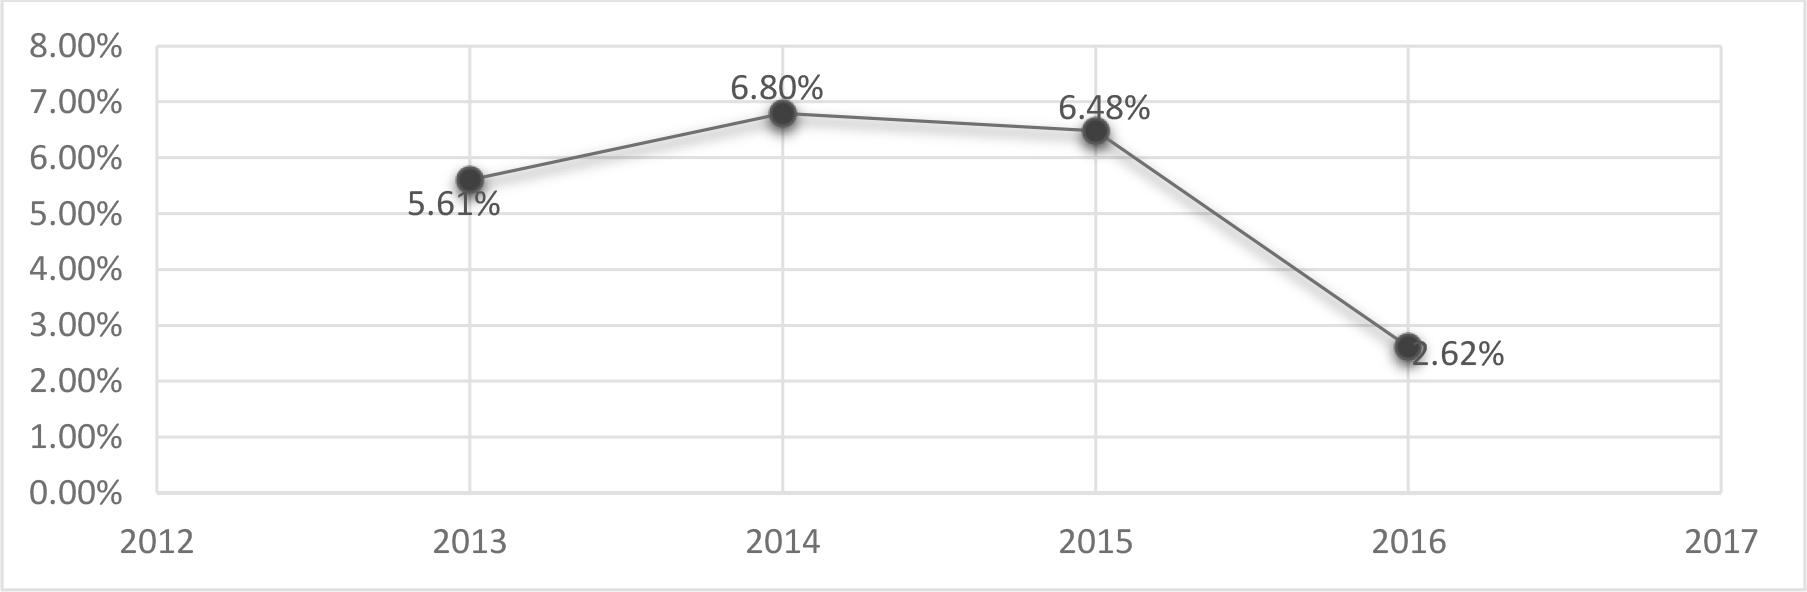
The Debt Ratio evolution over the period 2013-2016 (In thousands of DZD)
| Year | 2013 | 2014 | 2015 | 2016 |
|---|---|---|---|---|
| Bank Debt | 1 771 000 | 2 217 894 | 2 476 445 | 1 053 923 |
| Total Balance Sheet | 31 588 000 | 32 617 332 | 38 195 806 | 40 255 181 |
| Debt Ratio | 5,61% | 6,80% | 6,48% | 2,62% |
| Average | 5,38% | |||
(Source: Author’s calculations based on the Biopharm and COSOB documents)
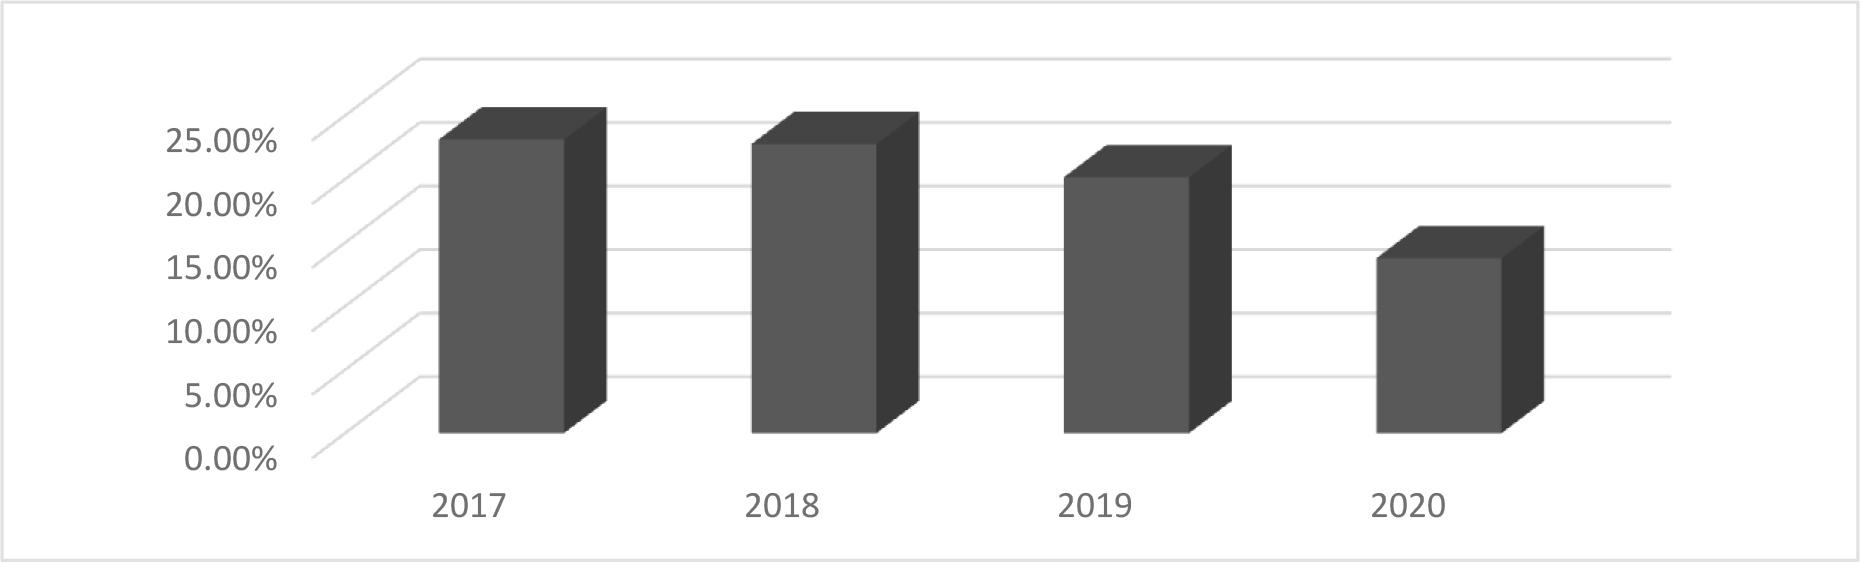
We will present these data in Figure no. 6.
The Debt Ratio evolution over the period 2013-2016
(Source: Author’s prepared based on the data in Table no. 8)
Interpretation: Biopharm maintained a low debt ratio, with an average of 5.38% before the IPO in 2016. This indicates a low dependence on bank debt to finance its operations. In 2016 (the IPO year), the ratio declined sharply to 2.62%, indicating that the company had significantly reduced its bank debt prior to the IPO. This financial strategy was probably aimed at presenting a stronger and more stable financial position to investors at the time of the IPO.
The Debt Ratio evolution over the period 2017-2020 (In thousands of DZD)
| Year | 2017 | 2018 | 2019 | 2020 |
|---|---|---|---|---|
| Bank Debt | 2 327 417 | 1 022 000 | 4 317 000 | 6 431 000 |
| Total Balance Sheet | 48 592 810 | 55 387 000 | 66 700 000 | 74 336 000 |
| Debt Ratio | 4,79% | 1,85% | 6,47% | 8,65% |
| Average | 5,44% | |||
(Source: Author’s calculations based on the Biopharm and COSOB documents)
We will present these data in Figure no. 7.
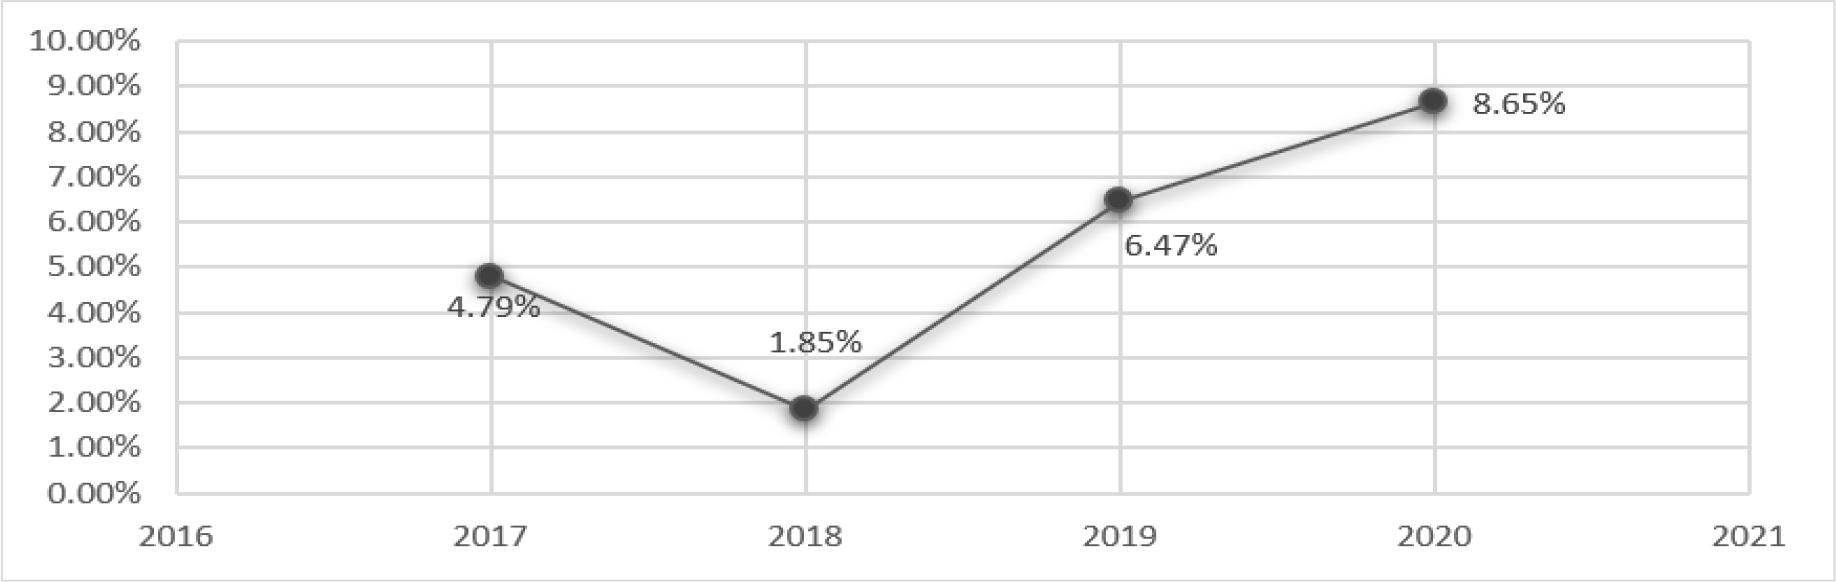
The Debt Ratio evolution over the period 2017-2020
(Source: Author’s prepared based on the data in Table no. 9)
Interpretation: After the IPO in 2016, the debt ratio of biopharma increased slightly, with an average of 5.44% over the 2017-2020 period, slightly higher than the 5.38% before the IPO. In 2019 and 2020, the ratio rose significantly, especially in 2020 (8.65%), indicating increased use of bank financing. This suggests that after its IPO, the company started to rely more on debt, as it gained the confidence of banks following the IPO. This increased trust allowed the company to take on more loans and increase the proportion of debt to equity.
We will analyze the Cost of Debt before and after the IPO.
The Cost of Debt evolution over the period 2013-2016 (In thousands of DZD)
| Year | 2013 | 2014 | 2015 | 2016 |
|---|---|---|---|---|
| Interest expenses | 391 000 | 336 515 | 571 286 | 352 803 |
| Total debt | 1 771 000 | 2 217 894 | 2 476 445 | 1 053 923 |
| Cost of Debt | 22,08% | 15,17% | 23,07% | 33,48% |
| Average | 23,45% | |||
(Source: Author’s calculations based on the Biopharm and COSOB documents)
These data are illustrated in Figure no.8 below.
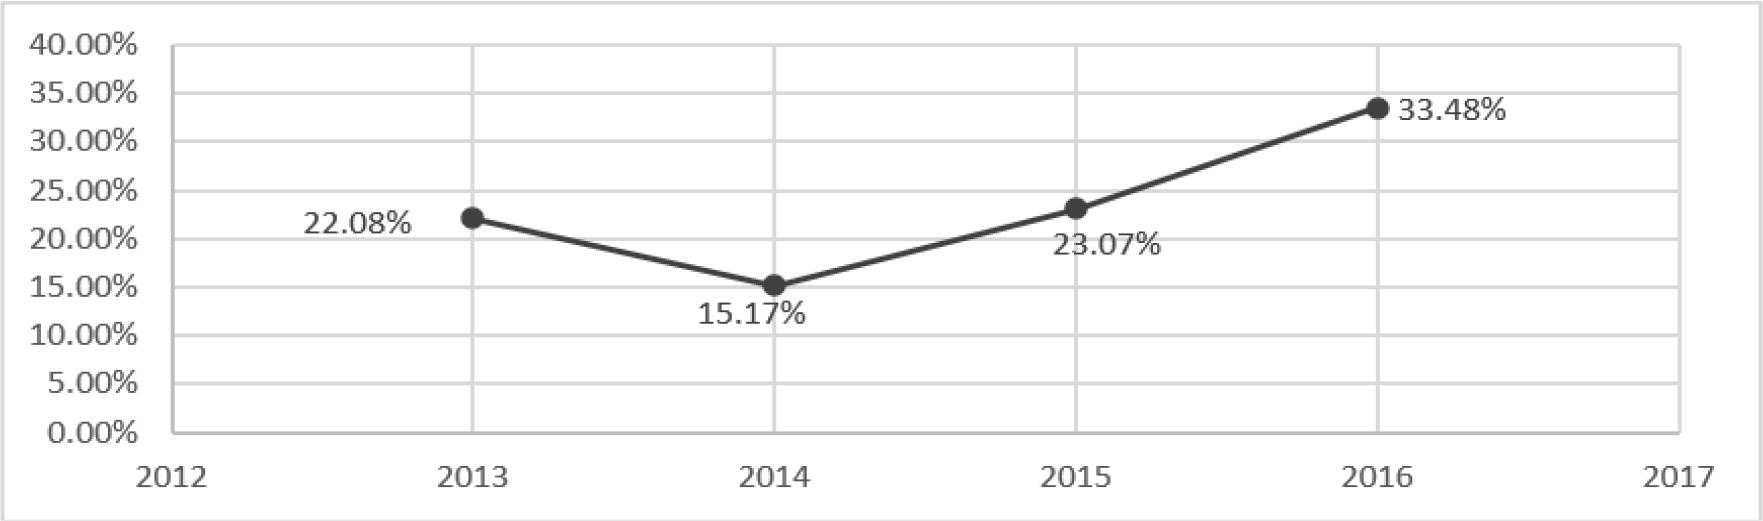
The Cost of Debt evolution over the period 2013-2016
(Source: Author’s prepared based on the data in Table no. 10)
Interpretation: During the period from 2013 to 2016 (prior to the IPO), financial expenses relative to total debt increased overall. The cost of debt reached its lowest level in 2014 (15,17%) and highest level in 2016 (33,48%), with an average of 23,45% over the period.
The Cost of Debt evolution over the period 2017-2020 (In thousands of DZD)
| Year | 2017 | 2018 | 2019 | 2020 |
|---|---|---|---|---|
| Interest expenses | 861 495 | 290 000 | 129 000 | 921 000 |
| Total debt | 2 327 417 | 1 022 000 | 4 317 000 | 6 431 000 |
| Cost of Debt | 37,02% | 28,38% | 2,99% | 14,32% |
| Average | 20,68% | |||
(Source: Author’s calculations based on the Biopharm and COSOB documents)
These data are presented in Figure no. 9.
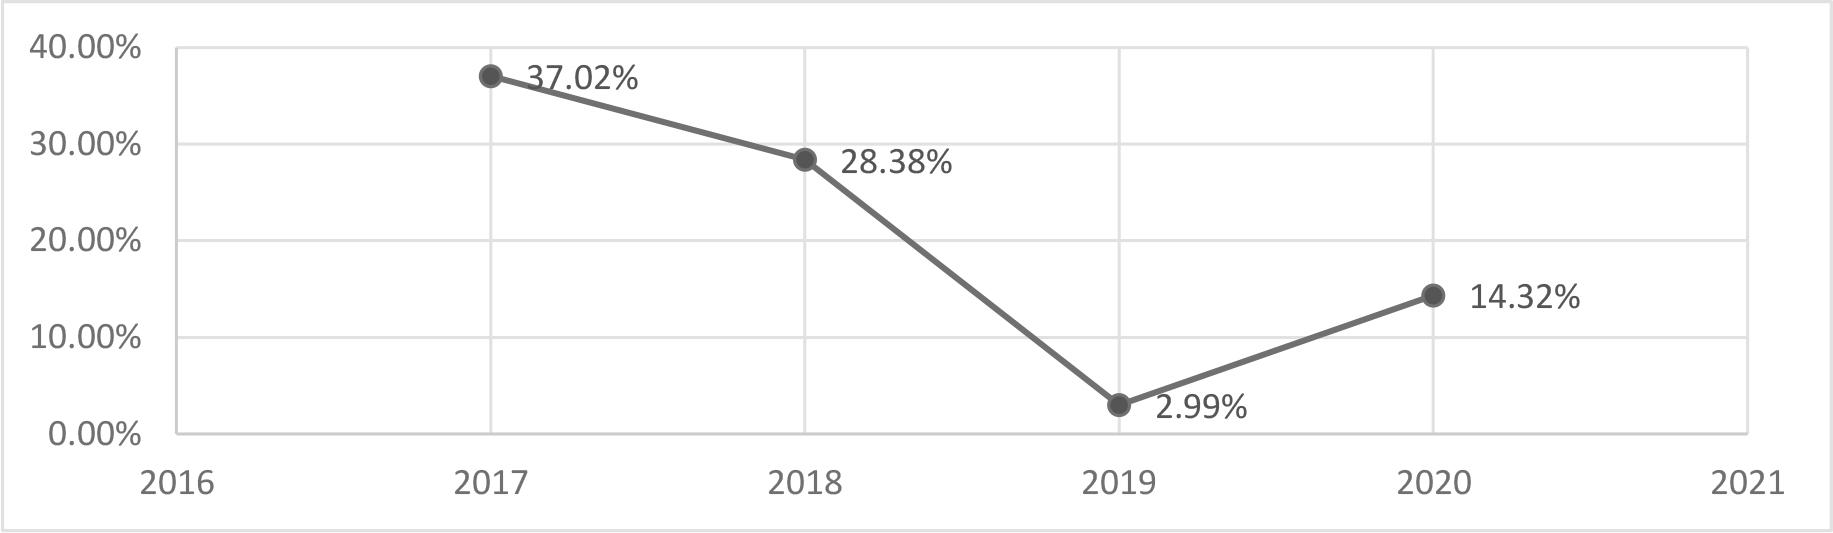
The Cost of Debt evolution over the period 2017-2020
(Source: Author’s prepared based on the data in Table no. 11)
Interpretation: In 2018, one year after the IPO, financial expenses relative to total debt has been reduced. The average of cost of debt from 2017 to 2020 was 23,45%, indicating a 2,77% reduction compared to pre-IPO period. This decrease is justified by the lower credit risk faced by creditors because the IPO improved the company’s credibility and provided a stronger guarantee.
We will analyze the DPR before and after the IPO.
The dividend payout ratio over the period 2013-2016 (In thousands of DZD)
| Year | 2013 | 2014 | 2015 | 2016 |
|---|---|---|---|---|
| Dividends | 1 497 000 | 500 000 | 1 403 000 | 1 684 000 |
| Net income | 3 395 000 | 3 854 368 | 4 453 571 | 5 552 092 |
| DPR | 44,09% | 12,97% | 31,50% | 30,33% |
| Average | 29,73% | |||
(Source: Author’s calculations based on the Biopharm and COSOB documents)
We will present these data in Figure no. 10.
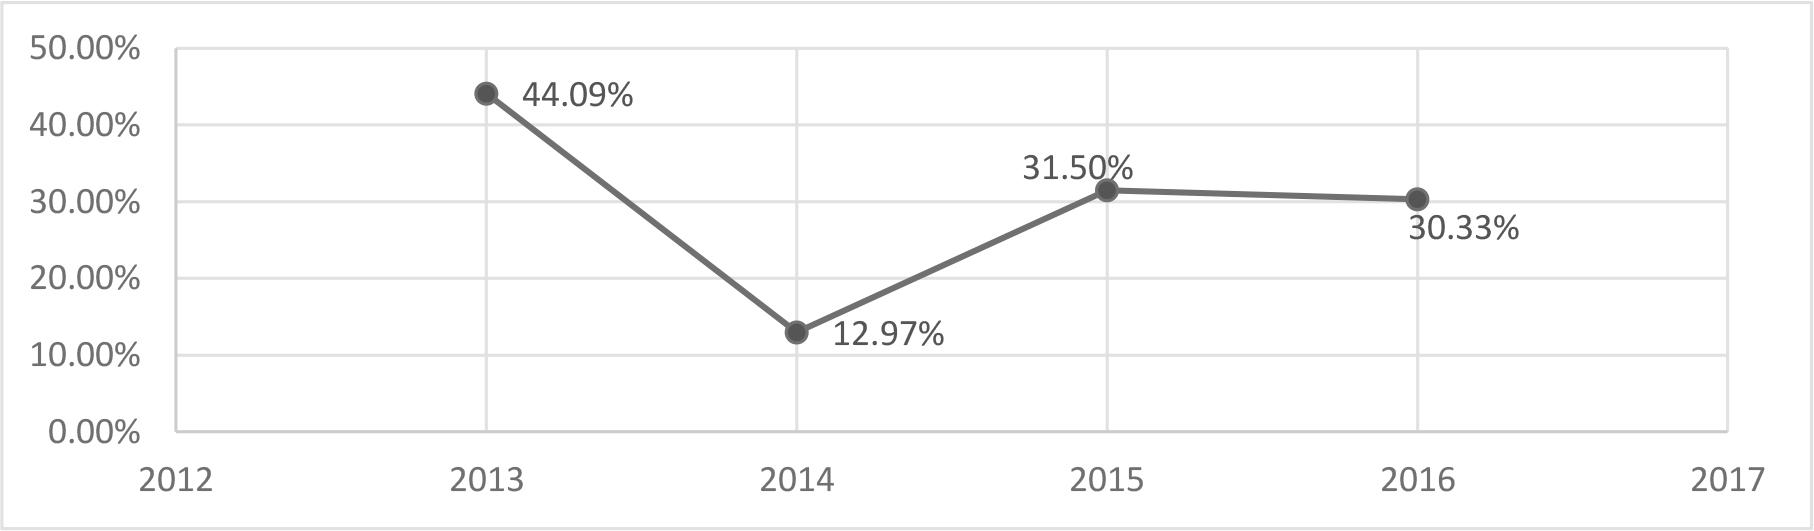
The dividend payout ratio over the period 2013-2016
(Source: Prepared by the researcher based on the data in Table no.12)
Interpretation: The dividend payout ratio (DPR) varied over the period 20132016 (prior to the IPO). It reached its highest level in 2013 (44,09%) and its lowest in 2014 (12,97%), with an average of 29,73%. This indicates a moderate dividend payout policy over this period.
The dividend payout ratio over the period 2017-2020 (In thousands of DZD)
| Year | 2017 | 2018 | 2019 | 2020 |
|---|---|---|---|---|
| Dividends | 1 684 000 | 2 552 000 | 2 936 000 | 2 936 000 |
| Net income | 6 498 667 | 7 525 000 | 7 604 000 | 5 570 000 |
| DPR | 25,91% | 33,91% | 38,61% | 52,71% |
| Middle | 37,79% | |||
(Source: Author’s calculations based on the Biopharm and COSOB documents)
We will present these data in Figure no. 11.
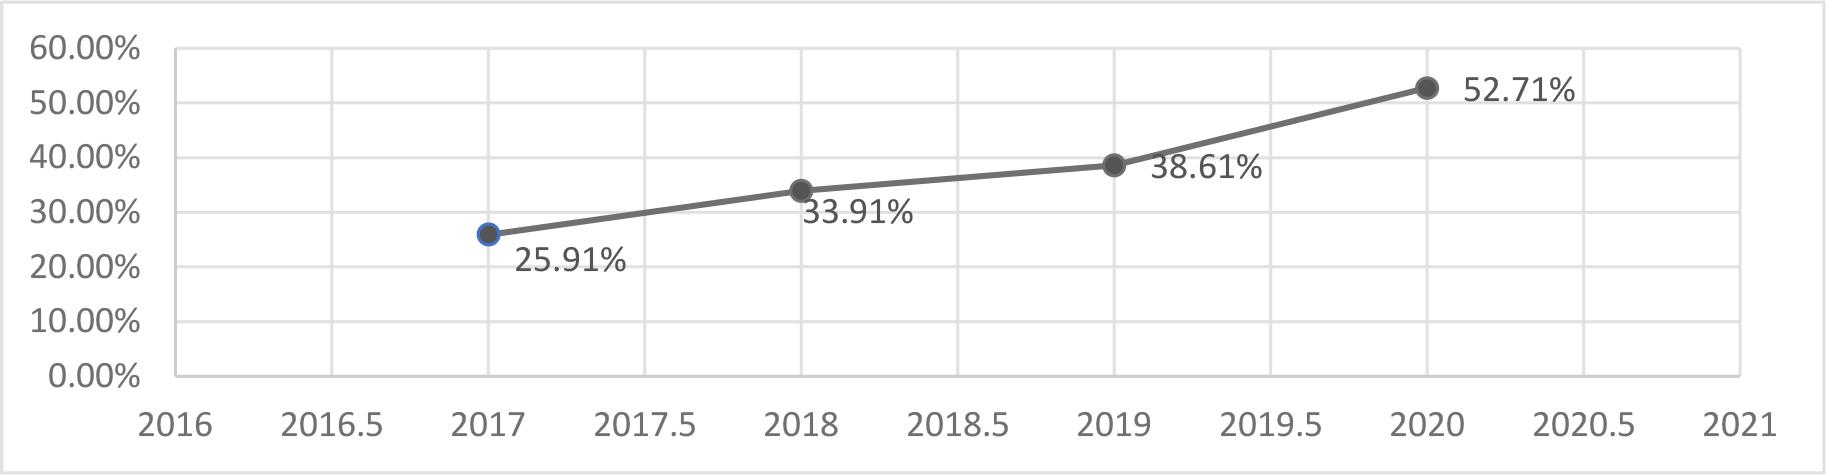
The dividend payout ratio over the period 2017-2020
(Source: Prepared by the researcher based on the data in Table no. 13)
Interpretation: The dividend payout ratio (DPR) varied over the period 2017–2020 (after the IPO). It reached its highest level in 2020 (52.71%), with an average of 37.79%. This indicates an increase in dividend distribution after the IPO, as the company is required to distribute dividends to attract investors and to comply with the projections stated in the information memorandum.
Based on the following hypotheses, we complete the summary table that will show the impact of listing for Biopharm company:
- –
If the Turnover variation increases, we will say that there is a positive impact.
- –
If the ROA increases, we will say that there is a positive impact.
- –
If the ROE increases, we will say that there is a positive impact.
- –
If the Debt Ratio increases, we will say that there is a positive impact
- –
If the Cost of debt increases, we will say that there is a negative impact.
- –
If the Dividend payout ratio increases, we will say that there is a negative impact.
The impact of listing on Biopharm company
| Ratio’s | Turnover | ROA | ROE | Debt Ratio | Cost of debt | DPR |
|---|---|---|---|---|---|---|
| Impact | Negative | Negative | Negative | Positive | Positive | Negative |
(Source: Prepared by the researcher)
The Initial Public Offering (IPO) had an overall negative impact on Biopharm. Most performance indicators (turnover, ROE, ROA, and DPR) declined. It also led to an increase in debt and its cost, which represents financial constraints.
The analysis of the impact of Biopharm’s IPO, based on a comparative study of its main financial ratios before and after the IPO, reveals contrasting results. On the basis of the hypotheses defined, certain indicators show a positive trend, notably the debt ratio and the cost of debt, reflecting easier access to financing, but also an increased financial burden. Other indicators, however, such as turnover, ROE, ROA and dividend payout ratio, show an unfavourable or neutral trend.
As a result, Biopharm’s IPO has not had a positive and significant impact on its financial performance overall. This observation reflects the structural limitations of the Algerian financial market, in particular the lack of dynamism of the Algiers Stock Exchange, which is often criticised for its inability to fully play its role as a growth lever for listed companies. In this context, Biopharm’s IPO appears to be more of a symbolic operation than a truly strategic move for financial development.