
1. Introduction
Potatoes (Solanum tuberosum L.) occupy a strategic position in the global agricultural system as the fourth major food source after wheat, rice, and corn. In addition to their high economic potential, potatoes are recognized as a solution for sustainable food diversification due to their nutritional composition rich in complex carbohydrates, fiber, vitamins, and bioactive compounds (Camire et al., 2021). Efficient biomass production per unit area and short cropping cycle provide significant comparative advantages over other food crops in strengthening global food stability (Haverkort and Struik, 2015).
This crop is generally cultivated in highland areas with cool temperatures that support growth and tuber formation. However, in tropical environments, potato plants are exposed to unique climatic conditions such as sharp diurnal temperature fluctuations and increased solar radiation. These conditions significantly affect physiological processes, photosynthetic activity, and biomass allocation (Mølmann and Johansen, 2025). Temperature variations at high elevations often alter growth responses and limit the expansion of cultivation to lower elevations, making understanding the environmental context crucial for shaping crop performance.
Given the complexity of plant responses to environmental variation, understanding genotype performance requires an analytical approach capable of integrating multiple agronomic and physiological traits. Traditional univariate analysis often fails to capture the interrelationships between traits that collectively determine adaptation. From a modern breeding perspective, multivariate analysis tools such as the Multi-Trait Genotype–Ideotype Distance Index (MGIDI) offer a powerful framework for synthesizing layered trait information into meaningful biological insights (Olivoto and Nardino, 2022). MGIDI enables researchers to evaluate the overall integration of traits, going beyond the effects of single traits.
Although MGIDI has been successfully applied to various commodities to support genotype evaluation (Pallavi et al., 2024; Alam et al., 2024; Putri et al., 2026), its application to tropical highland potato production systems remains very limited. Therefore, this study aims to elucidate the biological performance and trait integration of potato genotypes in a tropical highland environment through an integrative multi-trait analysis that highlights the relationships between genotype, traits, and environment.
2. Materials and method
2.1. Plant materials
This study used seven potato somaclones that consisted of four mutant and three commercial varieties that served as controls. The controls were superior commercial varieties widely cultivated by farmers in various regions. The mutant potato clones evaluated in this study were derived from induced mutations of commercial potatoes using gamma ray irradiation. The irradiation process was performed on stem cuttings obtained from plantlets at a dose of 30 Gy, utilizing the Gammacell 220 irradiator at the Center for Isotopes and Radiation Application, National Nuclear Energy Agency (PAIR BATAN), Pasar Jumat, South Jakarta. Following irradiation, the stem cuttings were subcultured every 4 weeks on a half-strength Murashige and Skoog (1/2 MS) medium supplemented with 0.5 ppm kinetin. These cultures were maintained in an incubation room at a temperature of 18–23°C under fluorescent lighting with an intensity of 1500 lux for a 16-h photoperiod. Specific details regarding the characteristics of all genotypes used in this experiment are provided in Table 1.
2.2. Experimental design
The field experiment was conducted for 4 months from August to November 2024 in Pangalengan, West Java, Indonesia. The test site is located at an altitude of 1,470 m above sea level (masl), with coordinates 7° 18′ 41″ S, 107° 58′ 37″ E. This field experiment was designed using a randomized block design with four replications for each somaclone. Each experimental unit (plot) has dimensions of 5 × 3 m. Climate data during the study period is presented in Figure 1.
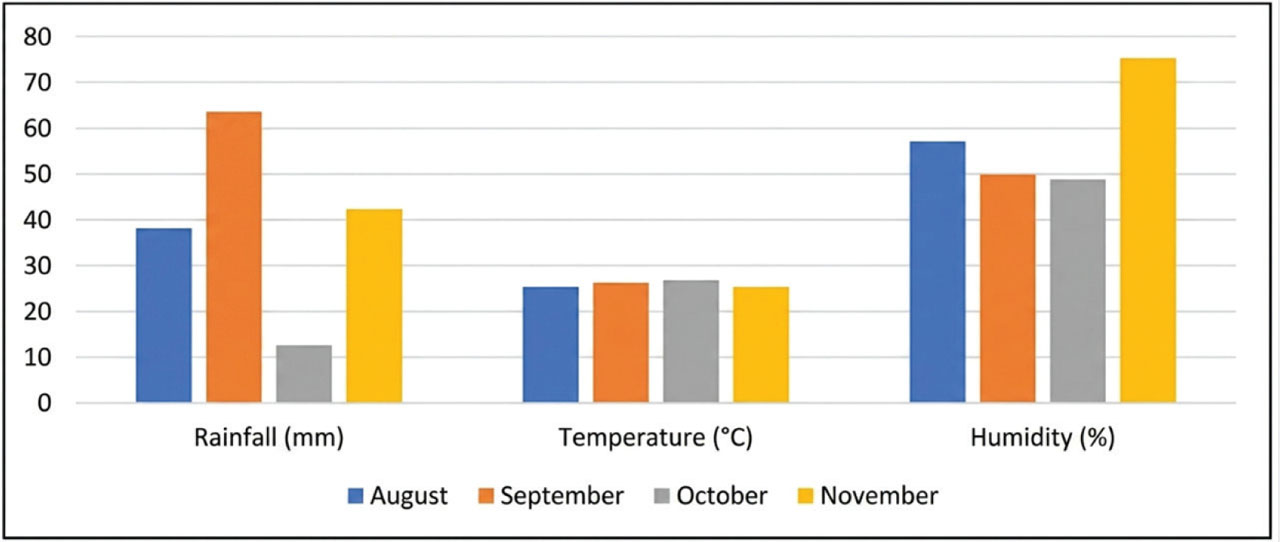
Figure 1.
Weather conditions during the study
Abbildung 1. Wetterbedingungen wahrend der Studie
The soil type at the experimental field is Andosols. During the experiment, chicken manure was applied at a rate of 10 t/ha and a compound nitrogen–phosphorus–potassium (NPK) fertilizer (Mutiara (16–16–16)) at a rate of 750 kg/ha. The NPK fertilizer contained 16% nitrogen (N), 16% phosphorus (expressed as P2O5), and 16% potassium (expressed as K2O). The irrigation system relied on rainwater throughout the experiment, with regular watering done every 2 days during the dry season. Weeds were removed manually every 2 weeks.
2.3. Data collection
Vegetative characters observed included leaf length (LL) (cm), leaf width (LW) (cm), stem diameter (SD) (mm), and plant height (PH) (cm) measured at the growth phase of 40 days after planting (DAP). Measurement of yield and productivity components such as economic amount of tuber/marketable tuber (EAT), economic tuber weight (ETW), and tuber weight per plot/yield (TWP) was carried out at the harvest time (110 DAP). The harvest of each genotype was weighed using a digital scale and then converted to determine the productivity value in tons per hectare (t/ha).
2.4. Data analysis
The collected data were analyzed using R programming software in Google Colab. Based on various morphological and yield traits, all collected data were analyzed using R programming software in Google Colab. The „Agricloae“ package was used to perform analysis of variance (ANOVA) for each trait separately. The Pearson’s rank correlation algorithm was used to construct correlation plots to evaluate the strength and direction of association between variables. Principal component analysis (PCA) was performed using the Google Colab packages „Ggally,“ „factoextra,“ and „gg-fortify.“ To visualize the PCA results, a two-way matrix containing the genotypes and their associated traits was used, focusing on the first two principal components (PCs). To show the distribution of these traits, the eigenvectors of each PC were used.
Heritability is calculated using the following equation:
The MGIDI index for the seven potato genotypes was calculated using the method suggested by Olivoto and Nardino (2021) to determine the best performing genotype. The following equation is used for this calculation:
In this equation, γij represents the jth score of the ith genotype and represents the jth score of the ideotype. The index is calculated for each genotype (i = 1, 2, …, t), where t is the total number of genotypes and j ranges from 1 to f, which is the number of characters.
To assess the strengths and weaknesses of the genotypes under study, crucial assessment techniques are used. The proportion of the MGIDI of the ith genotype explained by the jth factor (ωij) was used to show the strengths and weaknesses of each genotype. The calculation for ωij is:
Dij indicates the genetic distance between the ith genotype and the ideal genotype with respect to the MGIDI, and ω calculations were performed using the “mgidi” and “gamam” functions available in the “metan” package (Olivoto and Lúcio, 2020) in R software. These calculations allow to measure how closely each genotype aligns with the ideal genotype for a given character, providing valuable insights into the performance of the genotype regarding the character of interest. A low value ωij indicates that the genotype in that particular character is highly aligned with the ideal genotype, indicating strong performance in that particular character.
3. Results
3.1. ANOVA for all tested characters
ANOVA showed that all morphological and yield characters tested were significantly different among potato genotypes in tropical highland environments (p < 0.01 and p < 0.001), including LL, LW, SD, PH, number of economic tubers, ETW, and TWP (Table 2). The coefficient of variation (CV) values indicating a relatively low level of trait diversity (<10%) include LL, SD, PH, number of economically viable tubers, and TWP. Moderate CV values (10–20%) are indicated by leaf width (LW), while high CV values are indicated by economic tuber weight (21.3%) (Table 2).
Table 2.
Results of analysis of variance (ANOVA) on all tested characters of the 12 genotypes
Tabelle 2. Ergebnisse der Varianzanalyse (ANOVA) aller getesteten Merkmale der 12 Genotypen
| Traits | Means | Sign. | CV (%) |
|---|---|---|---|
| Leaf length (LL) (cm) | 21.248 ± 1.11 | *** | 5.22 |
| Leaf width (LW) (cm) | 4.369 ± 0.86 | ** | 19.60 |
| Stem diameter (SD) (mm) | 7.185 ± 0.64 | *** | 8.90 |
| Plant height (PH) (cm) | 265.84 ± 3.69 | *** | 1.38 |
| Economic amount of tuber (EAT) | 429.2 ± 7.27 | *** | 1.69 |
| Economic tuber weight (ETW) | 2.6701 ± 0.57 | *** | 21.30 |
| Tuber weight per plot (TWP) | 268.12 ± 8.00 | ** | 2.98 |
3.2. Relationships between measured traits
The correlation analysis results showed that several traits had a significant positive correlation, including EAT with PH, TWP, LW, LL, SD, and ETW. Furthermore, PH correlated with EAT and TWP (Figure 2). The darker the blue color for each trait, the higher the correlation value. These results suggest that targeting genotypes that exhibit favorable values for these traits may be beneficial for finding genotypes with better yields.
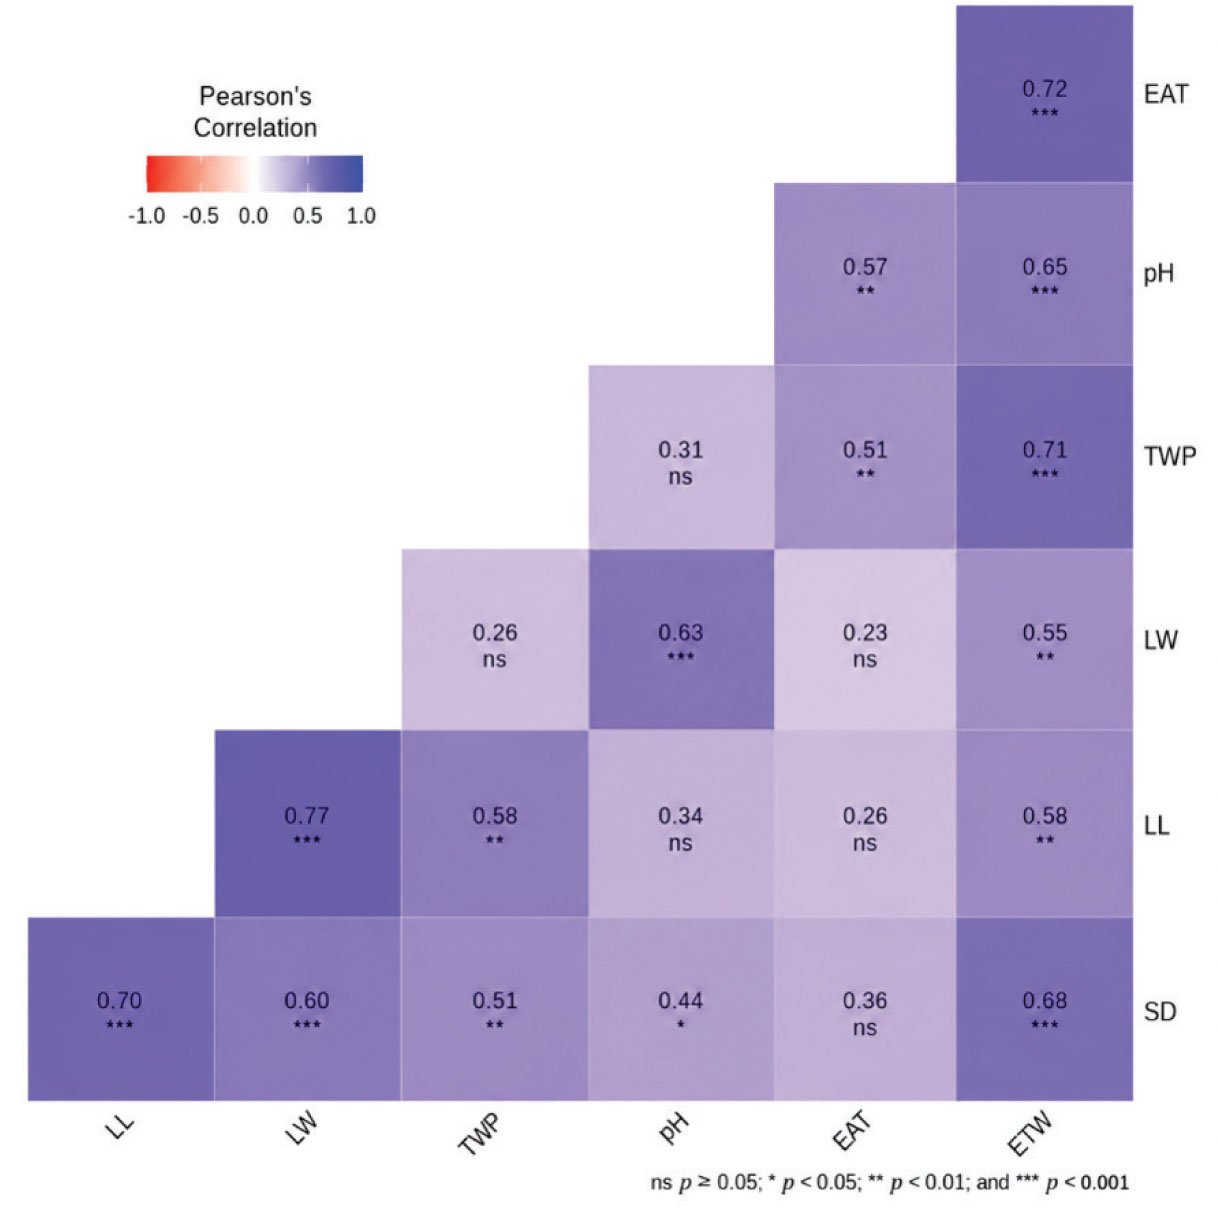
Figure 2.
Visualization of Pearson’s correlation coefficient matrix for quantitative charactersof the potato genotypes
Abbildung 2. Visualisierung der Pearson-Korrelationskoeffizientenmatrix fur die quantitative Merkmale der Kartoffelgenotypen
PCA was conducted to determine the traits that contributed the most to potato genotypic diversity. Each trait in the PC reflects its contribution to total diversity. Positive and negative loading values were used to differentiate between groups; traits with high absolute values (either positive or negative) contributed significantly to diversity within a component, while values close to zero indicated an insignificant contribution (Maulana et al., 2023). Based on the results of PCA given in Table 3, two PCs were obtained with eigenvalues greater than 1, namely PC1 and PC2. These two components cumulatively explained 86.4% of the total potato genotypic diversity, thus being sufficiently representative in describing the observed trait variation.
Table 3.
PCA character values that influence potato genotype diversity
Tabelle 3. PCA-Charakterwerte, die die Genotypendiversitat von Kartoffeln beeinflussen
| Traits | PC1 | PC2 |
|---|---|---|
| Leaf length | 0.81 | −0.49 |
| Leaf width | 0.91 | −0.04 |
| Stem diameter | 0.88 | −0.20 |
| Plant height | 0.76 | 0.53 |
| Economic amount of tuber | 0.61 | 0.66 |
| Economic tuber weight | 0.94 | 0.16 |
| Tuber weight per plot | 0.81 | −0.42 |
| Eigenvalue | 4.82 | 1.23 |
| Variability (%) | 68.8 | 17.5 |
| Cumulative (%) | 68.8 | 86.4 |
The first PC (PC1) had an eigenvalue of 4.82 with a diversity contribution of 68.8%, indicating that PC1 was the most dominant component in explaining potato genotype diversity. Characters with high loading values (˃0.5) on PC1 included LL, LW, SD, PH, number of economic tubers, ETW, and TWP. The high positive loading values for these traits indicate that PC1 is closely related to vegetative growth and yield components. Genotypes with high PC1 scores tend to have more vigorous plant growth, characterized by larger leaves, thicker stems, taller plants, and higher tuber production in terms of both quantity and weight.
The second PC (PC2) had an eigenvalue of 1.23 and contributed 17.5% to the variance. Although its contribution was smaller than PC1, PC2 still provided additional information on potato genotype variation. The characters that made a relatively larger contribution to PC2 were the number of economical tubers and PH, with the number of economical tubers having the highest positive loading value. This indicates that PC2 plays a greater role in differentiating genotypes based on yield patterns, particularly regarding the number of tubers produced, and indicates a difference in tendencies between vegetative growth traits and yield distribution.
The first two principal components (PC1 and PC2) explained 68.9% and 17.5% of the total variance, respectively, accounting for a cumulative variance of 86.4% (Figure 3). This high cumulative proportion indicates that the first two principal components adequately represent the variability among the evaluated traits. The PCA biplot illustrates the relationships among traits based on the angles between their vectors. Plant height (PH), ear attachment trait (EAT), and ear total weight (ETW) were represented by vectors with small angles between them, indicating strong positive correlations among these traits. Similarly, leaf width (LW), stem diameter (SD), total weight per plant (TWP), and leaf length (LL) also formed a cluster of closely aligned vectors, suggesting positive associations among these variables. Furthermore, the biplot revealed genotype–trait associations, with genotype G7 closely associated with the EAT vector, whereas genotypes G3 and G4 were positioned in the direction of the ETW vector, indicating superior performance for this trait.
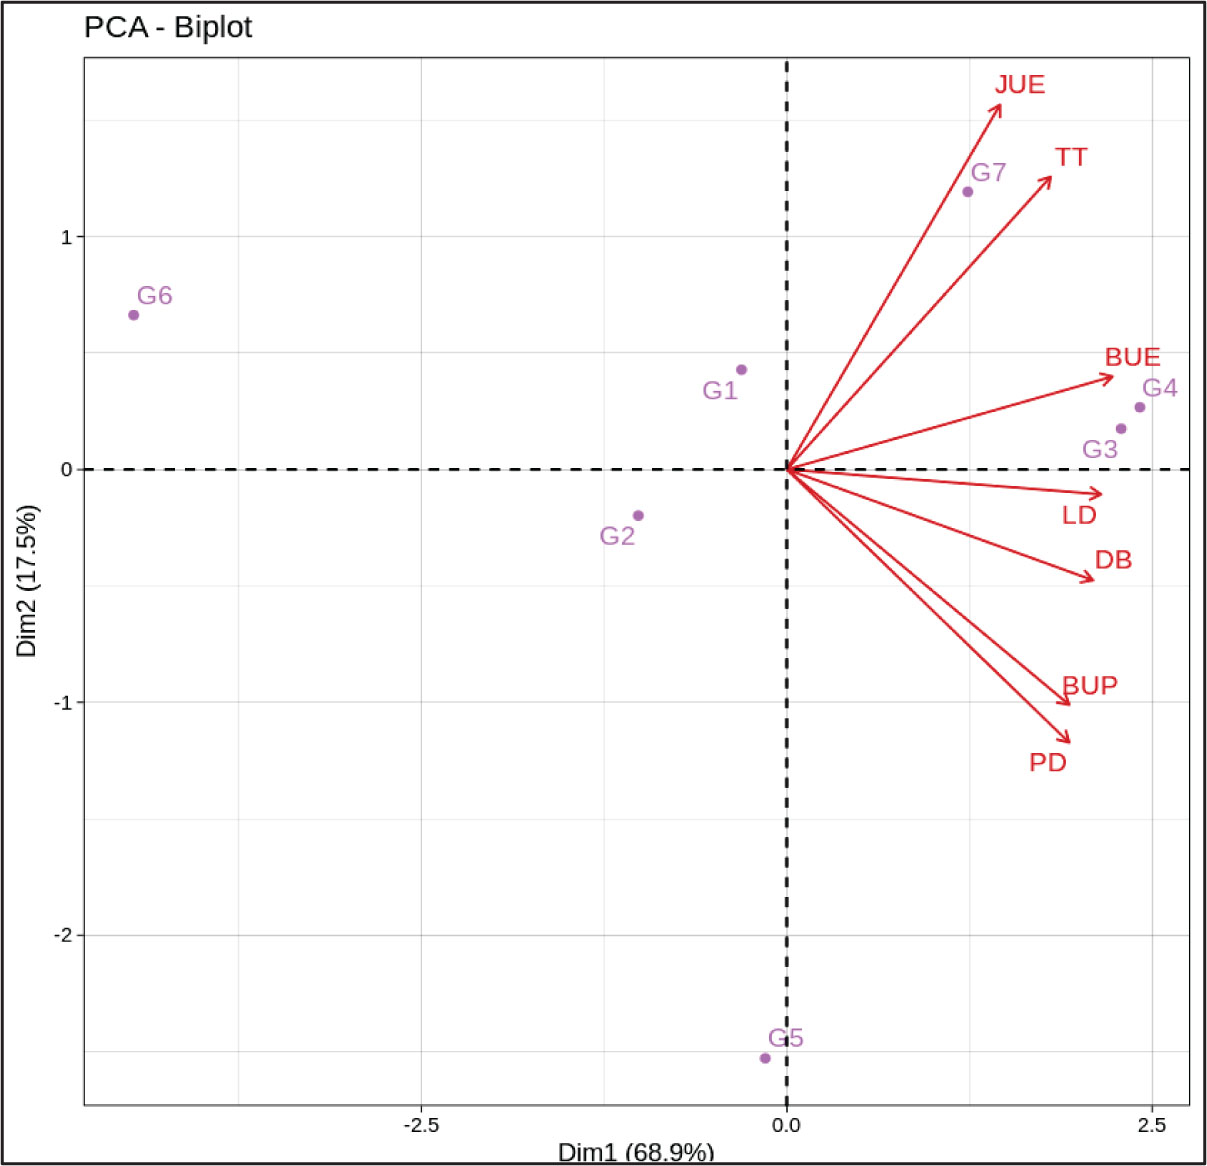
Figure 3.
PCA biplot on all genotypes and measured traits
Abbildung 3. PCA-Biplot aller Genotypen und gemessenen Merkmale
3.3. Heritability and multi-trait selection in potatoes
Factor analysis (FA) showed that two main factors (FA1 and FA2) successfully explained 86.4% of the total variability in potato traits, indicating that most of the phenotypic variation can be represented through a simpler factor structure (Table 4). Vegetative traits such as LL, LW, SD, and PH showed high loadings on FA1 (e.g., LL = −0.95; LW = −0.75; SD = −0.83), indicating that FA1 reflects the components of vegetative growth and photosynthetic potential. This is biologically consistent because leaf size and SD are closely related to the plant‘s ability to capture light, photosynthetic rate, and biomass formation (Devaux and Haverkort, 2008). Meanwhile, yield traits such as EAT, ETW, and TWP tend to have high loadings on FA2 (e.g., EAT = 0.99; ETW = 0.92; TWP = 0.16), so that FA2 can be interpreted as a component of assimilate allocation and tuber formation efficiency. In the context of tropical highlands, tuber formation is influenced by the dynamics of the transition from the vegetative to reproductive phases that are influenced by temperature and radiation, so the separation of these factors is biologically plausible.
Table 4.
Selection differentials for seven characters tested on potato genotypes
Tabelle 4. Selektionsdifferenziale fur sieben an Kartoffelgenotypen getestete Merkmale
| Variables | FA1 | FA2 | Sense | h2 (%) | Communality | Uniqueness |
|---|---|---|---|---|---|---|
| LL | −0.95 | 0.10 | Increase | 94.1 | 0.92 | 0.08 |
| LW | −0.75 | 0.52 | Increase | 82.9 | 0.83 | 0.17 |
| SD | −0.83 | 0.38 | Increase | 94.3 | 0.83 | 0.17 |
| PH | −0.28 | 0.89 | Increase | 76.1 | 0.87 | 0.13 |
| EAT | −0.09 | 0.90 | Increase | 94.9 | 0.82 | 0.18 |
| ETW | −0.65 | 0.71 | Increase | 87.7 | 0.92 | 0.08 |
| TWP | −0.91 | 0.16 | Increase | 87.5 | 0.85 | 0.15 |
| Cumulative (%) | 68.8 | 86.4 |
More specifically, high heritability values (>76%) for all traits indicate that variation between genotypes is more dominant than environmental variation, so that these characters are stable enough to describe genotype differences in tropical highland environments. However, high communality values (>0.82) for almost all traits indicate that the factor model successfully captures most of the variance of each trait, so that the biological interpretation of FA1 and FA2 is reliable. In the context of plant ecology, this factor structure supports the idea that adaptation of potato genotypes to tropical highland environments involves two main dimensions: (1) vegetative growth ability that determines the source of assimilates and (2) the efficiency of assimilate allocation to tubers as a sink. This approach is in line with the idea that understanding genotype performance in tropical environments must consider the integration of many traits, not just a single character (Olivoto and Nardino, 2022).
Identification of genotypes approaching ideotype through MGIDI resulted in three main genotypes that exceeded or were on the red line, namely G7, G4, and G3 (Figure 4A), where G7 was the best genotype. Genotype G1 was approaching the selection threshold, indicated by the red line, indicating the possibility that the genotype might have special characteristics. Meanwhile, genotype G5 was on the trajectory, indicating that it was the genotype furthest from the desired criteria. The desired character values for most of the characters being investigated were indicated by the selected mutations. Visualization of the strengths and weaknesses of a genotype can be assessed with MGIDI (Figure 4B). The selected genotypes are expected to exhibit high factor loadings for the traits represented by each principal factor. Genotype G7 was primarily associated with FA2, reflecting high loadings for plant height (PH), economic amount of tuber (EAT), and economic tuber weight (ETW), whereas it exhibited low loadings on FA1, indicating a weak contribution to the traits represented by this factor. In contrast, genotypes G5, G4, and G3 were primarily associated with FA1, showing high loadings for leaf length (LL), leaf width (LW), stem diameter (SD), and tuber weight per plot (TWP), while exhibiting low loadings on FA2.
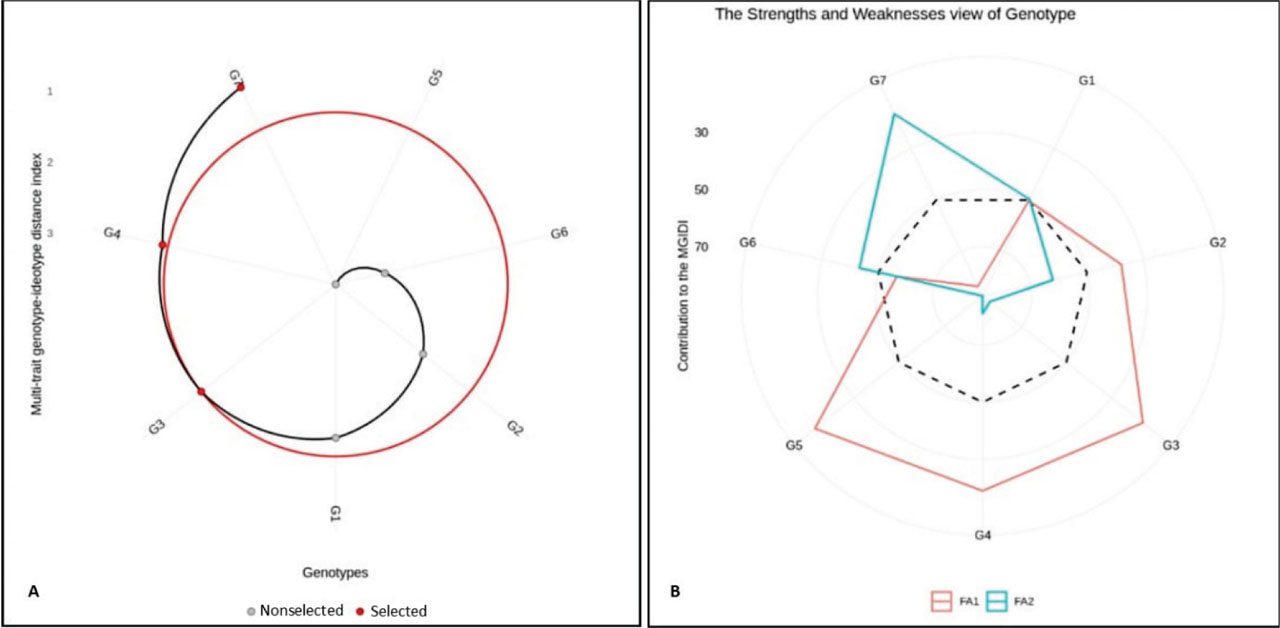
Figure 4.
Multiple Genotype–Ideotype Distance Index (MGIDI). A. Somaclones ranking, B. Strengths and weaknesses view
Abbildung 4. Multipler Genotyp-Ideotyp-Distanzindex (MGIDI), A. Somaklon-Rangliste, B. Starken- und Schwachenubersicht
4. Discussion
This analysis showed that all tested morphological and yield traits were significantly different between potato genotypes in tropical highland environments (p < 0.01 and p < 0.001), including LL, LW, SD, PH, number of economically viable tubers, ETW, and TWP. The existence of morphological and phenotypic diversity is a fundamental prerequisite in plant breeding activities, serving as an important basis for determining the criteria and implementing character selection (Yadav et al., 2025). This finding is consistent with the results of previous research reporting that potato mutant genotypes induced by gamma rays show substantial differences (Maulana et al., 2024). These significant differences can be explained by three main factors: differences in the genotypes themselves, environmental influences, and genotype–environment interactions (Ebem et al., 2021).
These results reflect significant morphological diversity in vegetative growth responses and biomass allocation to tubers. Physiologically, variations in leaf size and SD indicate differences in genotypes‘ capacity to capture and utilize solar radiation and regulate photosynthetic rates, which are important factors in tropical highland conditions characterized by high daily temperature fluctuations and strong light intensities (Devaux and Haverkort, 2008; Molahlehi et al., 2013). Significant differences in PH also have implications for canopy architecture, which influences light-use efficiency and interleaf competition for environmental resources. The CV is used to assess the relative level of diversity and precision of the data. In this study, CV values were divided into three criteria: low, indicated by LL, SD, PH, EAT, and TWP; medium, indicated by LW; and high, indicated by ETW. Traits classified as low and medium show relatively low and homogeneous variation, thus providing good validity for vegetative traits. Conversely, traits with high CV values (>20%) exhibit higher diversity but are still within acceptable limits for complex traits. Yield traits (including ETW) are generally more sensitive to environmental factors such as temperature and soil moisture; therefore, higher CV values are often found in agronomic analyses (Tokatlidis et al., 2023; Lee et al., 2023).
Identifying traits with high correlations is crucial for improving the efficiency of the selection process (Ahmadikhah et al., 2008). This study found that all traits had significant positive correlations, including EAT with PH, TWP, LW, LL, SD, and ETW. This correlation provides an opportunity to utilize these traits as effective indirect selection criteria to identify genotypes with high yield potential (Joshi et al., 2020). Variation in yield traits indicates that genotypes respond differently to resource allocation from the vegetative to reproductive phases. Therefore, the significant ANOVA results for all these traits support the use of a multi-trait approach such as MGIDI to integrate information on multiple plant traits simultaneously to evaluate genotype performance comprehensively and biologically meaningfully (Olivoto and Nardino, 2022). Overall, this high level of genetic variation is a prerequisite for predicting the superior potential of future potato genotypes (Gowda et al., 2025).
The value for each character in each PC indicates the character‘s contribution to diversity. PC1 and PC2 explain the main variation pattern and account for 86.3% of the total variation (Table 3). The PCA biplot serves to visualize the correlation coefficient between characters. This correlation can be interpreted through the angle between the vectors representing the tested characters; a small angle indicates a strong positive correlation (Maulana et al., 2023). Based on the biplot interpretation, this condition indicates that genotypes that show minimal angular variation among important character vectors can be key in formulating effective selection strategies. This directly leads to the identification of genotypes with high and stable tuber yield potential. These results also indicate that all characters contribute to genotypic diversity on PC1. Meanwhile, only the PH and EAT characters significantly contribute to genotypic diversity on PC2.
The PCA biplot (Figure 3) serves as a visual tool that helps understand the complex relationships between traits and individuals (genotypes) (Khan et al., 2021; Maulana et al., 2023). By observing the position and direction of the trait vectors and genotype points on the biplot, patterns and relationships hidden in the data can be identified. The EAT trait has a strong affinity with PH and ETW. Similarly, LW is close to SD, TWP, and LL. This proximity indicates a strong positive vector angle correlation between these traits, indicating a significant interrelated contribution to diversity. Interpretation of genotype positions on the biplot also provides insight into trait dominance. For example, the position of Genotype 7 (G7), which is very close to the EAT trait vector angle, indicates that this genotype has high dominance or superior performance for that trait.
Quantitative genetic approaches have been recognized for their effectiveness in selecting the best genotypes, but conventional methods are often limited to studies involving only a few traits (Maulana et al., 2023). To address this, this study applied the Multi-Trait Index Analysis by Distance (MGIDI) (Olivoto and Nardino, 2021). The results of FA showed that two main factors (FA1 and FA2) successfully explained 68.8% of the total variability. Vegetative traits such as LL, LW, SD, and PH showed high loadings on FA1, which reflects the components of vegetative growth and photosynthetic potential. This is biologically consistent because leaf size and SD are closely related to plant ability to capture light, photosynthetic rate, and biomass formation (Devaux and Haverkort, 2008). Previous studies have shown that environmental stress reduces shoot biomass, thereby limiting dry matter allocation to tubers (Gervais et al., 2021; Chang et al., 2018). In this study, the high rainfall recorded in September may have influenced shoot growth and biomass partitioning, suggesting that including shoot dry matter and climate data at different DAP could improve the interpretation of potato responses under tropical conditions. Meanwhile, FA2 is interpreted as an assimilate allocation component because it is dominated by yield traits such as EAT and ETW. Biologically, this separation of factors reflects the dynamics of transition from the vegetative to the reproductive phase influenced by temperature and radiation in tropical highlands.
Specifically, high heritability values (>76%) for almost all traits indicate that variation between genotypes is more dominant than environmental variation, making these traits relatively stable (Olivoto and Nardino, 2022). In this study, the very high heritability value for the number of tubers per plant (>87%) is crucial. This characteristic allows for efficient selection of superior genotypes in early generations, ultimately saving up to two growing seasons in a breeding program cycle. This factor structure supports the idea that potato adaptation to highlands involves two main dimensions: vegetative growth capacity (source) and efficient assimilate allocation to tubers (sink).
The MGIDI analysis successfully identified G7, G4, and G3 as the genotypes closest to the ideal criteria (Figure 4A). The G7 genotype (Median cultivar) was selected due to its highest productivity and disease resistance, which is crucial considering that farmers still rely on the susceptible Granola cultivar. Utilizing G7 could be a strategic solution to reduce dependence on seed imports by up to 40%. Furthermore, G4 and G3 demonstrated superior TWP, supported by optimal leaf morphology and SD for assimilate accumulation. The unique characteristics of G4 and G3, which even exceed the ideal criteria, make them important targets for future breeding programs.
The flexibility of the MGIDI method has been demonstrated through its application to various commodities such as wheat, soybeans, corn, rice, and potato (Pour-Aboughadareh and Poczai, 2021; Nasution et al., 2025; Putri et al., 2026). The MGIDI selection accuracy in this study reached 72.4%, comparable to the success rates in rice (91.2%) and corn (85.7%) (Yue et al., 2022), thus confirming the reliability of this method. Although G7, G4, and G3 show great potential, this study was conducted at only one location. Therefore, validation through multi-location testing is urgently needed to confirm the stability and adaptability of these promising genotypes before they are widely recommended as new superior varieties.
5. Conclusions
ANOVA showed significant differences for all observed traits. The correlation analysis showed that TWP (yield) had a significant positive correlation with various growth parameters and yield components. The increase in TWP was in line with the increase in ETW, number of economic tubers, SD, and PH. In addition, leaf dimensions, including LL and LW, also contributed significantly to the achievement of TWP in each observation area unit. The MGIDI analysis successfully identified the highest heritability for the number of economical tubers (94.9%) and accumulated PCA variance of 86.3%. The MGIDI analysis successfully identified three superior potato genotypes (G7, G3, and G4) with the desired trait profiles.
Acknowledgments
A high appreciation is given to the field assistance team during the trial, and thanks to the National Research and Innovation Agency and Hikmah Farm for providing field research facilities to conduct this research. This research was funded by a research grant from the National Research and Innovation Agency (Rumah Program ORPP).
Notes
[6] Contributed by Author Contribution
Conceptualization: H.M., I.R., H.H.N., methodology: H.M., I.R., software: H.M., M.R.F., A.Y., validation: H.M., I.R., H.H.N., K., D.W.U., T.H., A.K.K., formal analysis: M.R.F., A.Y., K., investigation: M.R.F., K., T.H., A.K.K., A.A., R.C.H., resources: H.M., I.R., data curation: M.R.F., T.H., K., A.K.K., A.A., R.C.H., writing-original draft: H.M., M.R.F., writing-review and editing: I.R., H.H.N., A.Y., K., D.W.U., A.A., T.H., A.K.K., R.C.H., visualization: M.R.F., A.Y., supervision: H.M., project administration: H.M., funding acquisition: H.M. All co-authors reviewed the final version and approved the manuscript before submission.