
Figure 1.

Figure 2.
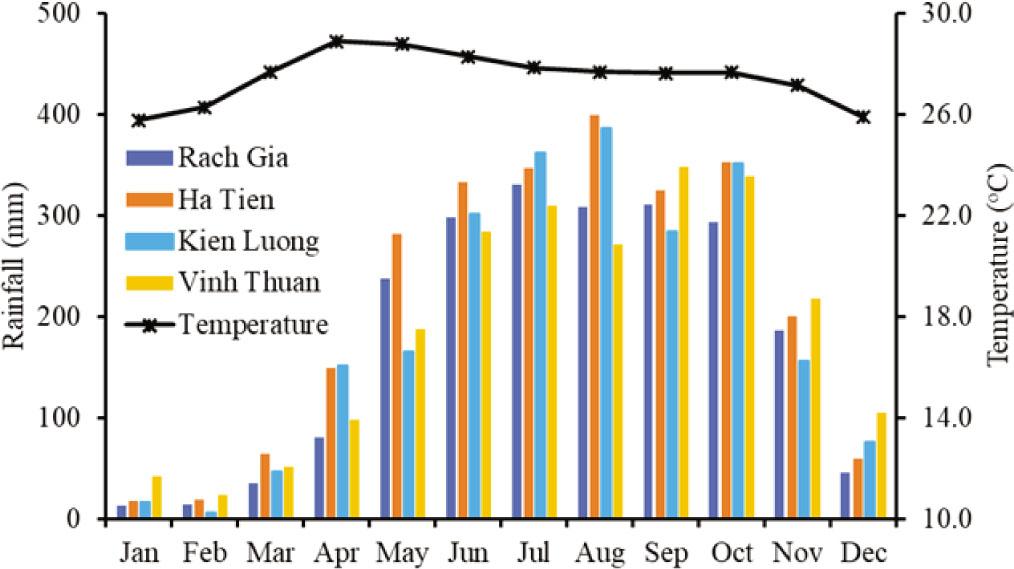
Figure 3.
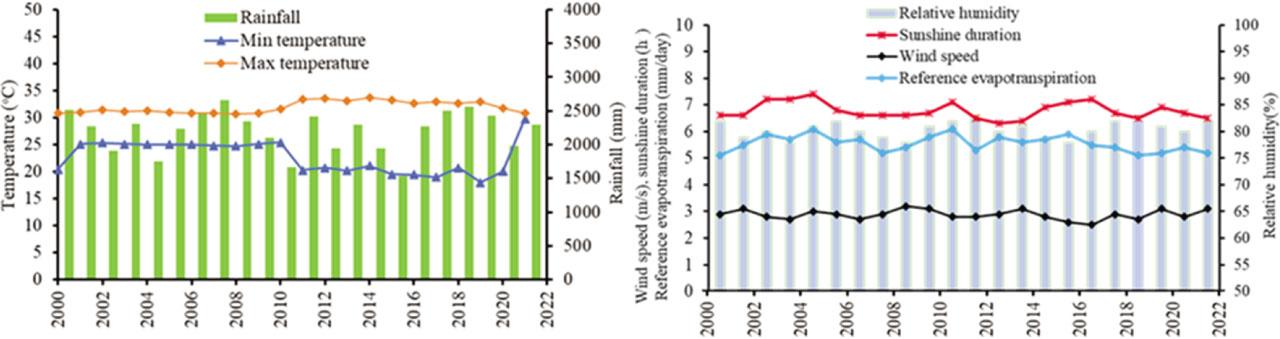
Figure 4.
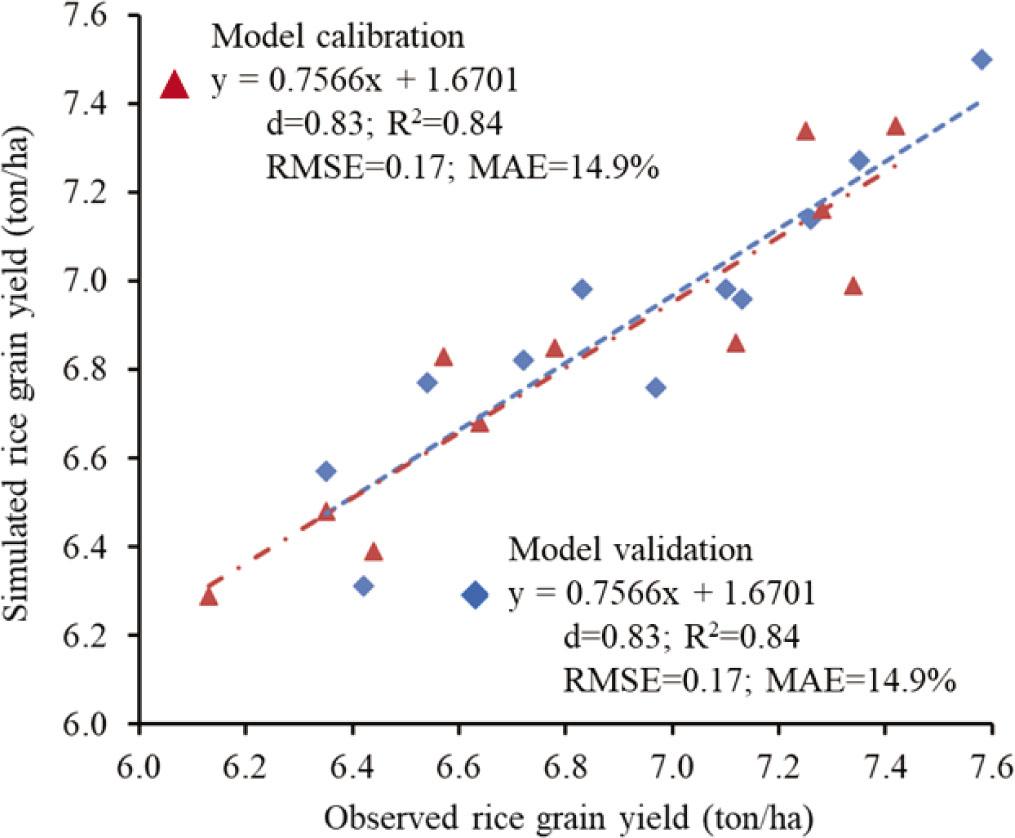
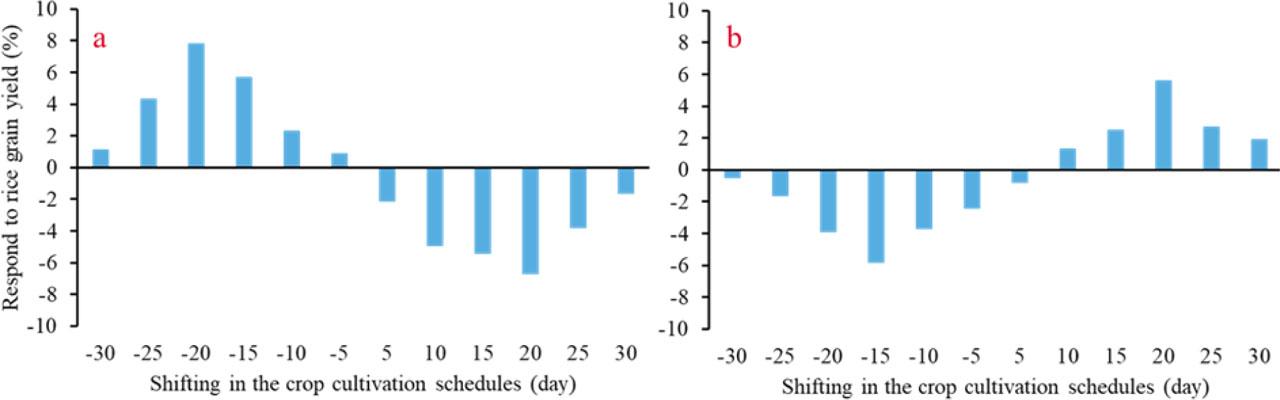
Figure 5.
The main parameters used to simulate the crop cultivation schedulesTabelle 3_ Die wichtigsten Parameter zur Simulation der Anbaupläne für Pflanzen
| Description | Default | Selected |
|---|---|---|
| Base temperature | 5.0 | 4.80 |
| Cut-off temperature | 30 | 28.6 |
| Canopy cover per seedling at 90% emergence (CCo) | 5.00 | 4.85 |
| Soil water depletion threshold for stomata control – upper | 0.50 | 0.48 |
| Shape factor for water stress coefficient for canopy senescence | 3.00 | 2.90 |
| Decline in crop coefficient after reaching maximum canopy cover | 0.3% | 0.3% |
| Crop coefficient for transpiration at CC (100%) | 1.00 | 0.95 |
| Leaf growth stress coefficient curve shape | 3.0 | 2.84 |
| Normalized water productivity (WP) | 15% | 14.6% |
| Allowable maximum increase (%) of specified HI | 10 | 9.4 |
Rice grain yield response to change in the crop cultivation schedules (sowing date) in the winter–spring and summer–fall vegetation seasonsTabelle 6_ Reaktion des Reiskornertrags auf Änderungen der Anbaupläne (Aussaattermin) in der Winter-Frühlings- und Sommer-Herbst-Vegetationsperioden
| Sowing date | Winter–spring | Period | Summer–fall | ||
|---|---|---|---|---|---|
| Rice grain yield (ton/ha) | Changed trend (%) | Rice grain yield (ton/ha) | Changed trend (%) | ||
| Current | 7.4 | - | Current | 6.5 | - |
| 30 | 7.3 | −1.6 | 30 | 6.6 | 1.9 |
| 25 | 7.1 | −3.8 | 25 | 6.7 | 2.7 |
| 20 | 6.9 | −6.7 | 20 | 6.9 | 5.6 |
| 15 | 7.0 | −5.4 | 15 | 6.7 | 2.5 |
| 10 | 7.0 | −4.9 | 10 | 6.6 | 1.3 |
| 5 | 7.2 | −2.1 | 5 | 6.4 | −0.8 |
| −5 | 7.5 | 0.9 | −5 | 6.3 | −2.4 |
| −10 | 7.6 | 2.3 | −10 | 6.3 | −3.7 |
| −15 | 7.8 | 5.7 | −15 | 6.1 | −5.8 |
| −20 | 8.0 | 7.8 | −20 | 6.2 | −3.9 |
| −25 | 7.7 | 4.3 | −25 | 6.4 | −1.6 |
| −30 | 7.5 | 1.1 | −30 | 6.5 | 0.5 |
Information about seeds, fertilizer rate, and irrigation water in the study areaTabelle 1_ Informationen zu Saatgut, Düngermenge und Bewässerungswasser im Untersuchungsgebiet
| Crop | Seeds (kg/ha) | Fertilizer rate (kg/ha) | Rain fed (mm) | Required irrigation (mm) | |||||||||
|---|---|---|---|---|---|---|---|---|---|---|---|---|---|
| IS | DS | MS | LS | IS | DS | MS | LS | IS | DS | MS | LS | ||
| WS | 80 | 60 | 100 | 50 | 130 | 33.4 | 188.2 | 34.7 | 25.6 | 50 | 18 | 60 | 50 |
| Stf | 100 | 70 | 100 | 60 | 140 | 46.4 | 73.7 | 192.3 | 306.5 | 40 | 45 | 10 | 0 |
Comparison of observed rice grain yields with the simulated resultsTabelle 4_ Vergleich der beobachteten Reiskornerträge mit den simulierten Ergebnissen
| Year | Model validation | Year | Model calibration | ||
|---|---|---|---|---|---|
| Observed | Simulated | Observed | Simulated | ||
| 2000 | 7.10 | 6.98 | 2011 | 6.64 | 6.68 |
| 2001 | 7.26 | 7.14 | 2012 | 7.12 | 6.86 |
| 2002 | 6.42 | 6.31 | 2013 | 7.28 | 7.16 |
| 2003 | 6.54 | 6.77 | 2014 | 6.57 | 6.83 |
| 2004 | 6.72 | 6.82 | 2015 | 6.13 | 6.29 |
| 2005 | 6.35 | 6.57 | 2016 | 6.44 | 6.39 |
| 2006 | 6.97 | 6.76 | 2017 | 7.25 | 7.34 |
| 2007 | 7.13 | 6.96 | 2018 | 7.34 | 6.99 |
| 2008 | 7.35 | 7.27 | 2019 | 6.35 | 6.48 |
| 2009 | 7.58 | 7.51 | 2020 | 6.78 | 6.85 |
| 2010 | 6.83 | 6.98 | 2021 | 7.40 | 7.35 |
The calibration and validation results of rice grain yield corresponding to winter–spring and summer–fall vegetation seasonsTabelle 5_ Die Kalibrierungs- und Validierungsergebnisse des Reiskornertrags entsprechen den Vegetationsperioden Winter-Frühling und Sommer-Herbst
| Crop | Validation | Calibration | ||||||
|---|---|---|---|---|---|---|---|---|
| d | R2 | RMSE | MAE | d | R2 | RMSE | MAE | |
| WS | 0.83 | 0.83 | 0.17 | 14.9% | 0.86 | 0.85 | 0.11 | 12.6% |
| SF | 0.76 | 0.77 | 0.21 | 17.6% | 0.78 | 0.79 | 0.16 | 13.4% |
The physical and chemical properties of soil across the study areaTabelle 2_ Die physikalischen und chemischen Eigenschaften des Bodens im gesamten Untersuchungsgebiet
| Variables | Soil depth layers (cm) | |||||||||||
|---|---|---|---|---|---|---|---|---|---|---|---|---|
| Ha Tien | Kien Luong | Rach Gia | ||||||||||
| Layer | 0–10 | 10–20 | 20–30 | 30–40 | 0–10 | 10–20 | 20–30 | 30–40 | 0–10 | 10–20 | 20–30 | 30–40 |
| Sand (%) | 24.5 | 27.6 | 22.7 | 19.4 | 25.7 | 27.9 | 24.8 | 19.7 | 22.7 | 24.1 | 24.8 | 19.8 |
| Silt (%) | 60.7 | 55.8 | 51.9 | 48.7 | 55.2 | 51.8 | 53.8 | 51.1 | 51.9 | 48.7 | 55.4 | 52.3 |
| Clay (%) | 14.8 | 16.6 | 25.4 | 31.9 | 19.1 | 20.3 | 21.4 | 29.2 | 25.4 | 27.2 | 19.8 | 27.9 |
| Soil features | Silty clay loam | Silt loam | Silty clay loam | Silty clay loam | Silt loam | Silt loam | Silt loam | Silty clay Loam | Silt loam | Silt loam | Silt loam | Silty clay loam |
| FC (% vol) | 40 | 39 | 42 | 38 | 33 | 33 | 33 | 44 | 33 | 33 | 33 | 44 |
| PWP (% vol) | 22 | 18 | 19 | 19 | 13 | 13 | 13 | 23 | 13 | 13 | 13 | 23 |
| SAT (% vol) | 52 | 46 | 52 | 52 | 46 | 46 | 46 | 52 | 46 | 46 | 46 | 52 |
| BD (g/cm3) | 1.12 | 1.21 | 1.25 | 1.31 | 0.98 | 0.89 | 0.96 | 1.02 | 0.97 | 0.94 | 0.99 | 1.13 |
| TAW (mm/m) | 210 | 200 | 210 | 210 | 200 | 200 | 200 | 210 | 200 | 200 | 200 | 210 |
| K+ (cmol/kg) | 0.21 | 0.18 | 0.18 | 0.17 | 0.19 | 0.18 | 0.19 | 0.22 | 0.19 | 0.18 | 0.18 | 0.20 |
| Na+ (cmol/kg) | 0.13 | 0.12 | 0.11 | 0.12 | 0.10 | 0.12 | 0.13 | 0.14 | 0.11 | 0.12 | 0.12 | 0.14 |
| Ca2+ (cmol/kg) | 3.6 | 3.8 | 3.2 | 3.3 | 3.7 | 3.6 | 3.8 | 3.9 | 3.8 | 3.7 | 3.9 | 4.0 |
| Mg2+ (cmol/kg) | 0.95 | 0.84 | 0.79 | 0.92 | 0.83 | 0.85 | 0.86 | 0.99 | 0.84 | 0.86 | 0.82 | 0.97 |
| pH (H2O) | 5.5 | 5.3 | 5.6 | 5.7 | 5.7 | 5.4 | 5.1 | 5.0 | 5.8 | 5.5 | 5.6 | 5.0 |