
Figure 1
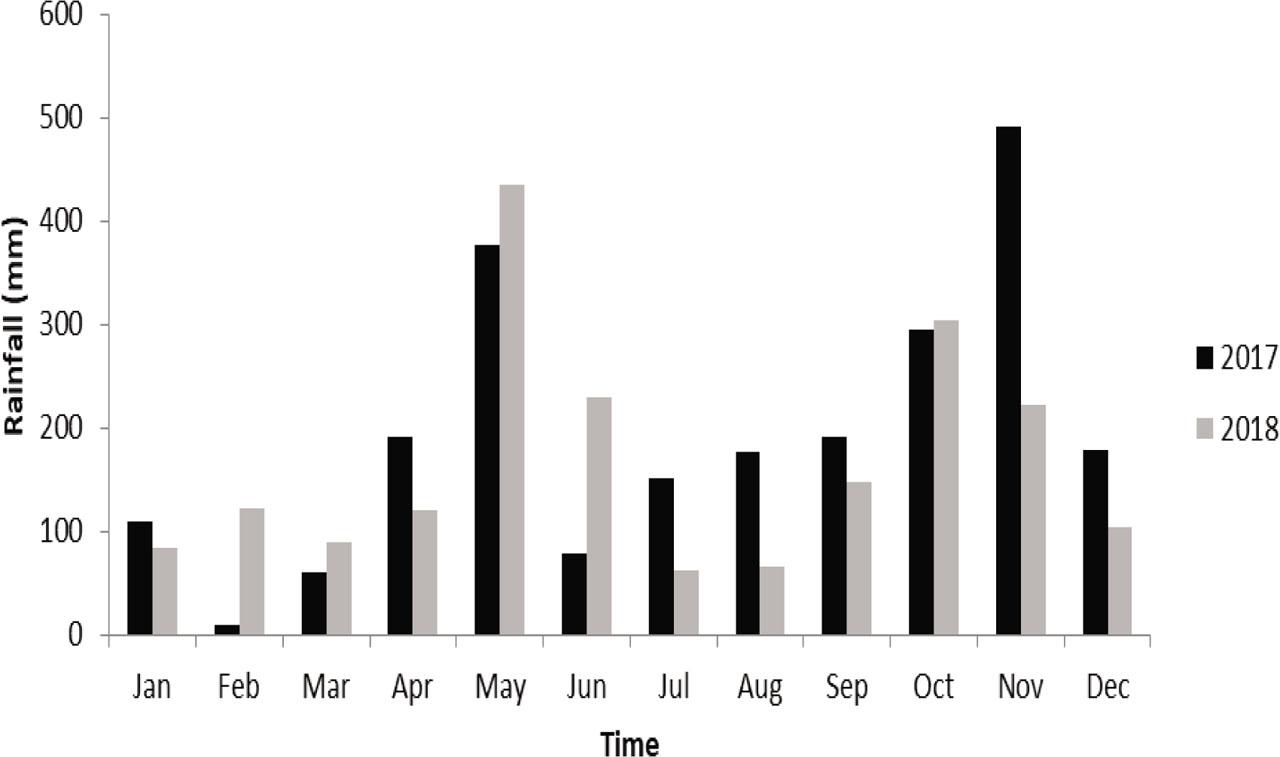
Figure 2
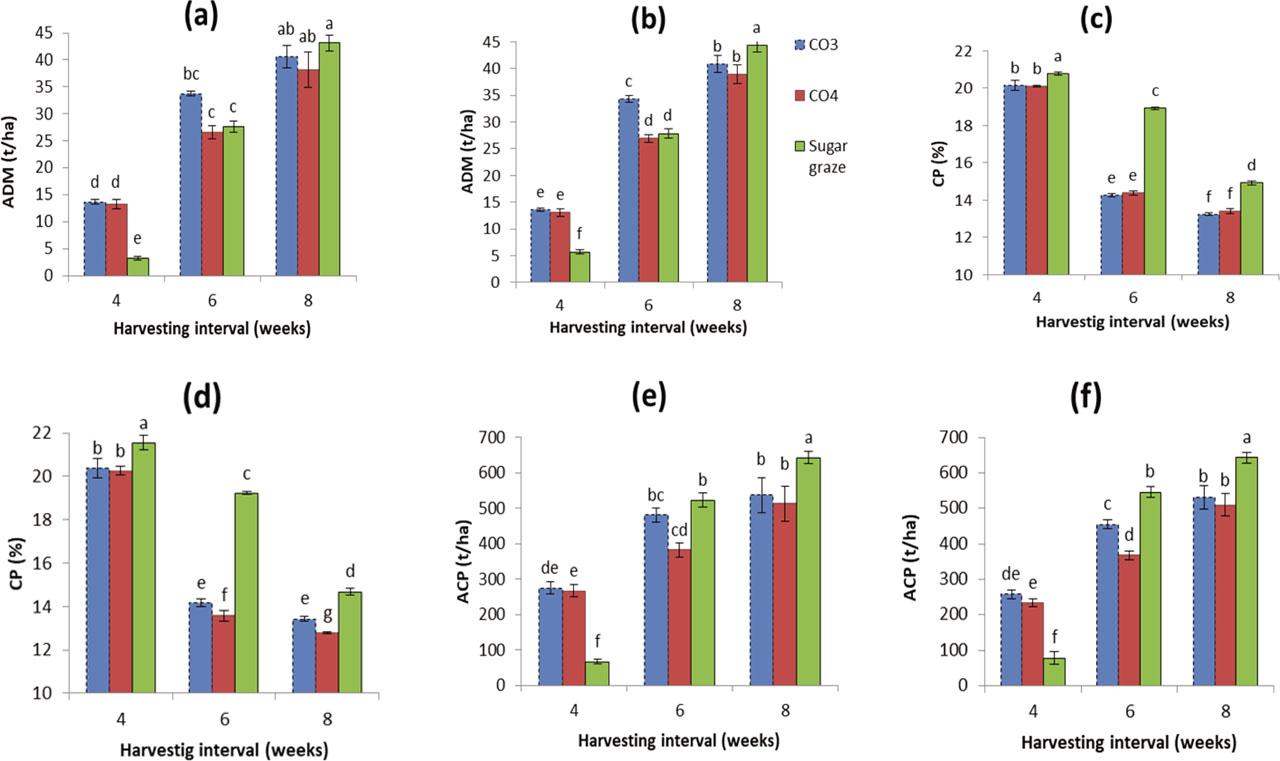
Interaction effects of variety and cutting interval on annual dry matter yield, dry matter content, crude protein, annual crude protein yield, and crude fiber contents during the second harvesting year (2018–2019) Means ± standard error followed by different letters within columns show statistically significant differences (p < 0_05)_ V: variety, H: harvesting interval_Tabelle 7_ Interaktionseffekte von Sorte und Schnittintervall auf den jährlichen Trockenmasseertrag, den Trockenmassegehalt, das Rohprotein, den jährlichen Rohproteinertrag und den Rohfasergehalt im zweiten Erntejahr (2018–2019)_ Mittelwerte ± Standardfehler, gefolgt von unterschiedlichen Buchstaben in den Spalten, unterscheiden sich statistisch signifikant (p < 0,05)_ V: Sorte, H: Ernteintervall_
| Variety | Cutting interval | p-Value | ||||
|---|---|---|---|---|---|---|
| 4 weeks | 6 weeks | 8 weeks | ||||
| Dry matter (%) | CO-3 | 11.67 ± 0.41cd | 13.01 ± 0.04cd | 15.21 ± 0.92abc | V | 0.000 |
| CO-4 | 12.86 ± 0.36cd | 13.84 ± 0.71bcd | 16.53 ± 2.03ab | H | 0.059 | |
| Sugar graze | 12.95 ± 0.09d | 15.24 ± 0.35abc | 18.88 ± 0.07a | V × H | 0.085 | |
| Annual dry matter yield (t/ha) | CO-3 | 13.63 ± 0.35e | 34.24 ± 0.65c | 40.87 ± 1.56b | V | 0.000 |
| CO-4 | 13.04 ± 0.72e | 26.92 ± 0.74d | 38.96 ± 1.75b | H | 0.000 | |
| Sugar graze | 3.24 ± 0.32f | 27.85 ± 0.82d | 44.35 ± 1.32a | V × H | 0.000 | |
| Crude protein (%) | CO-3 | 20.37 ± 0.45b | 14.15 ± 0.18e | 13.43 ± 0.11e | V | 0.000 |
| CO-4 | 20.25 ± 0.21b | 13.57 ± 0.23f | 12.78 ± 0.05g | H | 0.000 | |
| Sugar graze | 21.55 ± 0.32a | 19.23 ± 0.05c | 14.68 ± 0.14d | V × H | 0.000 | |
| Annual crude protein yield (t/ha) | CO-3 | 2.77 ± 0.34de | 4.84 ± 0.23c | 5.48 ± 0.13b | V | 0.000 |
| CO-4 | 2.64 ± 0.11e | 3.65 ± 0.12d | 4.98 ± 0.32b | H | 0.000 | |
| Sugar graze | 0.69 ± 0.18f | 5.35 ± 0.15b | 6.51 ± 0.15a | V × H | 0.000 | |
| Crude fiber (%) | CO-3 | 26.75 ± 0.23d | 28.65 ± 0.35c | 29.55 ± 0.19b | V | 0.000 |
| CO-4 | 26.75 ± 0.25d | 29.10 ± 0.19c | 31.25 ± 0.1a | H | 0.000 | |
| Sugar graze | 22.58 ± 0.05e | 26.26 ± 0.14d | 28.86 ± 0.15c | V × H | 0.000 | |
Harvest dates for cutting treatments in 2017 and 2018_Tabelle 1_ Erntedaten für Schnittbehandlungen in den Jahren 2017 und 2018_
| Cutting interval | Harvest dates | Number of cuts |
|---|---|---|
| 4 weeks | 2017: June 14, July 12, Aug 9, Sep 6, Oct 4, Nov 1, Nov 29, Dec 27 | 13 |
| 2018: Jan 24, Feb 21, Mar 21, Apr 18, May 16 | ||
| 6 weeks | 2017: Jun 25, July 6, Sep 17, Oct 29, Dec 10 | 9 |
| 2018: Jan 21, Mar 4, Apr 15, May 27 | ||
| 8 weeks | 2017: Jul 9, Sep 3, Oct 29, Dec 24, | 6 |
| 2018: Feb 4, Apr 29 |
Effects of variety and cutting interval on annual dry matter yield, dry matter content, crude protein, annual crude protein yield, and crude fiber contents during the second harvesting year (2018–2019)_ Means ± standard error followed by different letters within columns shows statistically significant differences (p < 0_05)_Tabelle 5_ Auswirkungen von Sorte und Schnittintervall auf die jährliche Trockenmasseausbeute, den Trockenmassegehalt, das Rohprotein, die jährliche Rohproteinausbeute und den Rohfasergehalt von drei Futtermitteln während des zweiten Erntejahres (2018–2019)_ Mittelwerte ± Standardfehler, gefolgt von unterschiedlichen Buchstaben in den Spalten, unterscheiden sich statistisch signifikant (p < 0_05)_
| Treatment | Dry matter (%) | Annual dry matter yield (t/ha) | Crude protein (%) | Annual crude protein yield (t/ha) | Crude fiber (%) |
|---|---|---|---|---|---|
| Variety | |||||
| CO-3 | 13.29 ±1.03b | 29.58 ± 8.20a | 15.98 ± 2.20b | 4.14 ± 0.81a | 28.32 ± 0.82b |
| CO-4 | 14.41 ± 1.10ab | 26.31 ± 7.49b | 15.53 ± 2.37b | 3.70 ± 0.79a | 29.03 ± 1.29a |
| Sugar graze | 15.69 ± 1.73a | 25.96 ± 11.20b | 18.49 ± 2.02a | 4.22 ± 0.17a | 25.89 ± 1.70c |
| Harvesting interval | |||||
| 4 weeks | 12.49 ± 0.41c | 10.78 ± 2.56c | 20.72 ± 0.82a | 1.89 ± 0.56c | 25.36 ± 1.39c |
| 6 weeks | 14.03 ± 0.65b | 29.67 ± 2.30b | 15.65 ± 1.80b | 4.56 ± 0.51b | 28.19 ± 0.69b |
| 8 weeks | 16.87 ± 1.07a | 39.39 ± 1.58a | 13.63 ± 0.56c | 5.61 ± 0.41a | 29.69 ± 0.86a |
Effects of variety and cutting interval on plant height, leaf length, leaf width, number of tillers, number of leaves, and stem diameter of three forages at the first harvesting year_ Means ± standard error followed by different letters within columns show statistically significant differences (p < 0_05)_Tabelle 2_ Auswirkungen von Sorte und Schnittintervall auf Pflanzenhöhe, Blattlänge, Blattbreite, Anzahl der Ackerbauern, Anzahl der Blätter und Stammdurchmesser von drei Futtermitteln_ Mittelwerte ± Standardfehler, gefolgt von unterschiedlichen Buchstaben in den Spalten, unterscheiden sich statistisch signifikant (p < 0,05)_
| Treatment | Plant height (cm) | Leaf length (cm) | Leaf width (cm) | No. of tillers | No. of leaves | Stem diameter (mm) |
|---|---|---|---|---|---|---|
| Variety | ||||||
| CO-3 | 163.0 ± 19.6b | 94.4 ± 6.1a | 3.6 ± 0.3c | 33.5 ± 0.4a | 254.8 ± 13.1a | 15.2 ± 1.7a |
| CO-4 | 164.7 ± 28.3ab | 91.0 ± 6.4b | 3.9 ± 0.3b | 35.1 ± 0.6a | 266.8 ± 15.8a | 13.9 ± 1.0b |
| Sugar graze | 169.0 ± 25.9a | 66.6 ± 10.2c | 7.2 ± 1.3a | 0.0b | 8.5 ± 0.7b | 12.9 ± 0.9c |
| Harvesting interval | ||||||
| 4 weeks | 118.3 ± 4.8c | 69.3 ± 11.5c | 3.6 ± 0.5c | 22.2± 0.4 | 157.8 ± 75.4b | 11.6 ± 0.3b |
| 6 weeks | 177.8 ± 3.0b | 88.3 ± 7.3b | 5.3 ± 1.3b | 23.2 ± 0.5 | 188.8 ± 90.0a | 15.0 ± 0.9a |
| 8 weeks | 200.6 ± 5.5a | 94.4 ± 7.4a | 5.7 ± 1.6a | 23.1 ± 1.1 | 183.5 ± 88.2ab | 15.0 ± 0.9a |
Interaction effects of variety and cutting interval on plant height, leaf length, leaf width, number of tillers, number of leaves, and stem diameter of three forages at the first harvesting year_ Means ± standard error followed by different letters within columns differ statistically significant (p < 0_05)_ V: Variety, H: Harvesting interval_Tabelle 3_ Interaktionseffekte von Sorte und Schnittintervall auf Pflanzenhöhe, Blattlänge, Blattbreite, Anzahl der Bestocker, Anzahl der Blätter und Stängeldurchmesser von drei Futtermitteln im ersten Erntejahr_ Mittelwerte ± Standardfehler, gefolgt von unterschiedlichen Buchstaben in den Spalten, unterscheiden sich statistisch signifikant (p < 0,05)_ V: Sorte, H: Ernteintervall_
| Variety | Harvesting interval | p-Value | ||||
|---|---|---|---|---|---|---|
| 4 weeks | 6 weeks | 8 weeks | ||||
| Plant height | CO-3 | 125.0 ± 6.1e | 173.4 ± 4.2d | 190.6 ± 0.5bc | V | 0.038 |
| CO-4 | 109.0 ± 7.2f | 183.6 ± 3.8cd | 201.6 ± 2.1ab | H | 0.000 | |
| Sugar graze | 120.9 ± 3.2e | 176.5 ± 9.3cd | 209.6 ± 4.3a | V × H | 0.000 | |
| Leaf length | CO-3 | 82.7 ± 1.6c | 96.8 ± 1.5ab | 103.6 ± 3.7a | V | 0.000 |
| CO-4 | 78.7 ± 1.0cd | 94.5 ± 1.5b | 99.9 ± 1.2ab | H | 0.000 | |
| Sugar graze | 46.4 ± 1.5e | 73.7 ± 0.4d | 79.7 ± 1.5cd | V × H | 0.000 | |
| Leaf width | CO-3 | 3.0 ± 1.8e | 3.8 ± 0.0d | 4.0 ± 0.1d | V | 0.000 |
| CO-4 | 3.2 ± 0.2e | 4.1 ± 0.0d | 4.3 ± 0.0cd | H | 0.000 | |
| Sugar graze | 4.6 ± 0.6c | 8.0 ± 0.4b | 8.9 ± 0.0a | V × H | 0.000 | |
| No. of tillers | CO-3 | 32.8 ± 6.1a | 34.2 ± 7.1a | 33.4 ± 7.4a | V | 0.000 |
| CO-4 | 33.8 ± 7.9a | 35.5 ± 7.1a | 36.0 ± 6.6a | H | 0.672 | |
| Sugar graze | 0.0b | 0.0b | 0.0b | V × H | 0.969 | |
| No. of leaves | CO-3 | 229.4 ± 55.3b | 272.9 ± 56.6ab | 262.2 ±50.7ab | V | 0.000 |
| CO-4 | 237.0 ± 42.7ab | 284.4 ± 57.2a | 284.4 ± 57.2a | H | 0.002 | |
| Sugar graze | 7.1 ± 0.8c | 9.0 ± 0.5c | 9.3 ± 0.5c | V × H | 0.240 | |
| Stem diameter | CO-3 | 11.7 ± 0.5d | 16.5 ± 0.9a | 17.2 ± 0.9a | V | 0.000 |
| CO-4 | 12.0 ± 0.7cd | 15.0 ± 1.2ab | 14.8 ± 1.1ab | H | 0.000 | |
| Sugar graze | 11.0 ± 0.3d | 13.5 ± 1.2bc | 14.1 ± 1.3bc | V × H | 0.009 | |
Interaction effects of variety and cutting interval on annual dry matter yield, dry matter content, crude protein, annual crude protein yield, and crude fiber contents during the first harvesting year (2017–2018)_ Means ± standard error followed by different letters within columns shows statistically significant differences (p < 0_05)_ V: Variety, H: Harvesting interval_Tabelle 6_ Interaktionseffekte von Sorte und Schnittintervall auf den jährlichen Trockenmasseertrag, den Trockenmassegehalt, das Rohprotein, den jährlichen Rohproteinertrag und den Rohfasergehalt im ersten Erntejahr (2017–2018)_ Mittelwerte ± Standardfehler, gefolgt von unterschiedlichen Buchstaben in den Spalten, unterscheiden sich statistisch signifikant (p < 0,05)_ V: Sorte, H: Ernteintervall_
| Variety | Cutting interval | p-Value | ||||
|---|---|---|---|---|---|---|
| 4 weeks | 6 weeks | 8 weeks | ||||
| Dry matter (%) | CO-3 | 11.67 ± 0.41cd | 13.01 ± 0.04cd | 15.21 ± 0.92abc | V | 0.000 |
| CO-4 | 12.86 ± 0.36cd | 13.84 ± 0.71bcd | 16.53 ± 2.03ab | H | 0.059 | |
| Sugar graze | 12.95 ± 0.09d | 15.24 ± 0.35abc | 18.88 ± 0.07a | V × H | 0.085 | |
| Annual dry matter yield (t/ha) | CO-3 | 13.63 ± 0.35e | 34.24 ± 0.65c | 40.87 ± 1.56b | V | 0.000 |
| CO-4 | 13.04 ± 0.72e | 26.92 ± 0.74d | 38.96 ± 1.75b | H | 0.000 | |
| Sugar graze | 3.24 ± 0.32f | 27.85 ± 0.82d | 44.35 ± 1.32a | V × H | 0.000 | |
| Crude protein (%) | CO-3 | 20.37 ± 0.45b | 14.15 ± 0.18e | 13.43 ± 0.11e | V | 0.000 |
| CO-4 | 20.25 ± 0.21b | 13.57 ± 0.23f | 12.78 ± 0.05g | H | 0.000 | |
| Sugar graze | 21.55 ± 0.32a | 19.23 ± 0.05c | 14.68 ± 0.14d | V × H | 0.000 | |
| Annual crude protein yield (t/ha) | CO-3 | 2.77 ± 0.34de | 4.84 ± 0.23c | 5.48 ± 0.13b | V | 0.000 |
| CO-4 | 2.64 ± 0.11e | 3.65 ± 0.12d | 4.98 ± 0.32b | H | 0.000 | |
| Sugar graze | 0.69 ± 0.18f | 5.35 ± 0.15b | 6.51 ± 0.15a | V × H | 0.000 | |
| Crude fiber (%) | CO-3 | 26.75 ± 0.23d | 28.65 ± 0.35c | 29.55 ± 0.19b | V | 0.000 |
| CO-4 | 26.75 ± 0.25d | 29.10 ± 0.19c | 31.25 ± 0.1a | H | 0.000 | |
| Sugar graze | 22.58 ± 0.05e | 26.26 ± 0.14d | 28.86 ± 0.15c | V × H | 0.000 | |
Effects of variety and cutting interval on annual dry matter yield, dry matter content, crude protein, annual crude protein yield, and crude fiber contents during the first harvesting year (2017–2018)_ Means ± standard error followed by different letters within columns differ statistically significant (p < 0_05)_Tabelle 4_ Auswirkungen der Sorte und des Schnittintervalls auf die jährliche Trockenmasseausbeute, den Trockenmassegehalt, das Rohprotein, die jährliche Rohproteinausbeute und den Rohfasergehalt von drei Futtermitteln (2017–2018) Mittelwerte ± Standardfehler, gefolgt von unterschiedlichen Buchstaben in den Spalten, unterscheiden sich statistisch signifikant (p < 0,05)_
| Treatment | Dry matter (%) | Annual dry matter yield (t/ha) | Crude protein (%) | Annual crude protein yield (t/ha) | Crude fiber (%) |
|---|---|---|---|---|---|
| Variety | |||||
| CO-3 | 14.25 ± 0.91b | 29.30 ± 8.08a | 15.89 ± 2.16b | 4.31 ± 0.79a | 28.88 ± 0.84b |
| CO-4 | 15.15 ± 1.39ab | 26.02 ± 7.21b | 15.96 ± 2.09b | 3.87 ± 0.71a | 29.45 ± 1.19a |
| Sugar graze | 15.73 ± 2.09a | 24.68 ± 11.61b | 18.22 ± 1.73a | 4.10 ± 0.13a | 25.87 ± 2.02c |
| Harvesting interval | |||||
| 4 weeks | 12.66 ± 0.30c | 10.04 ± 3.40c | 20.35 ± 0.22a | 2.02.82 ± 0.68c | 25.62 ± 1.79c |
| 6 weeks | 14.78 ± 0.61b | 29.32 ± 2.22b | 15.86 ± 1.54b | 4.62.26 ± 0.41b | 28.36 ± 0.82b |
| 8 weeks | 17.69 ± 0.96a | 40.63 ± 1.42a | 13.86 ± 0.54c | 5.64.47 ± 0.39a | 30.22 ± 0.80a |