
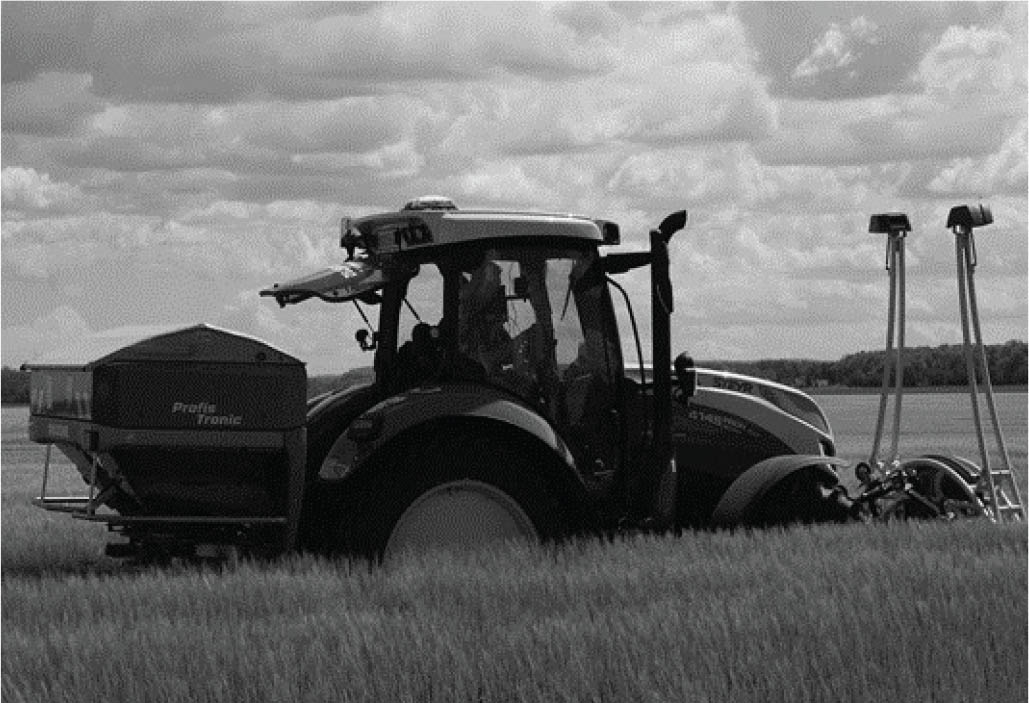
Figure 1
Ground-based crop sensor
Abbildung 1. Bodenbasierter optischer Pflanzensensor
Table 1
Description of the scenarios implemented for VRNA during the field experiment
Tabelle 1. Beschreibung der durchgeführten Szenarien im Feldversuch mit konventioneller und variabler Stickstoffausbringung (VRNA)
| Fertilizer application scenario | Description |
|---|---|
| Stimulus | Crops with lower sensor-determined yield than expected1 receive higher fertilizer rate |
| Compensatory | Crops with higher sensor-determined yield than expected1 receive lower fertilizer rate |
1 Expected yield created on the basis of the isaria’s reflectance measurement index (IRMI). This index, created by the sensor’s manufacturer, measures the vegetation index of the crop and compares it to the calibration quantity. The calibration value is selected on the basis of an NDVI map and continuously adjusted during the measurements
IRMI, isaria’s reflectance measurement index; NDVI, normalized difference vegetation index; VRNA, variable rate nitrogen application
Table 2
Partial budgeting structure for the acquisition of the crop sensor for VRNA
Tabelle 2. Teilkostenrechnungsansatz für die Anschaffung des Pflanzensensors für die variable Stickstoffausbringung (VRNA)
| Additional income | Additional costs |
|---|---|
| Yield increased | Equipment costs
|
| Reduced costs | Reduced income |
| Fertilizer amount | Yield decreased |
| A. Total additional income and reduced costs | B. Total additional costs and reduced income |
| Δ Net income = A – B | |
[i] VRNA, variable rate nitrogen application
Table 3
Fertilizer application rates and yield changes in comparison to the conventional way of fertilizer application
Tabelle 3. Vergleich der Düngerausbringungsraten und Ertragsänderungen des konventionellen und variablen Stickstoffausbringungsszenarios
| Scenario | Fertilizer applied (kg N/ha) | Δ relative to baseline (kg N/ha) | Yield (kg/ha) | Δ relative to baseline (kg/ha) |
|---|---|---|---|---|
| Conventional1 | 56 | – | 6,829 | – |
| Stimulus | 63 | +7 | 6,760 | −69 |
| Compensatory | 44 | −12 | 6,412 | −417 |
Table 4
Additional precision farming expenses
Tabelle 4. Zusätzliche Ausgaben für die Präzisionslandwirtschaft
| Description | Cost | Reference |
|---|---|---|
| ISARIA crop sensor (€) 1 | 19,393 | Louise (2017) |
| AMAZONE ZA-TS 2000 mounted | 17,735 | Oliver (2018) |
| spreader (€) 2 | ||
| Laptop (€) | 1,099 | mediamarkt (2020) |
| Internet subscription (€/month) | 25 | magenta (2020) |
| Internet box (€) | 75 | magenta (2020) |
| Satellite mapping software fees (€/year)3 | 257 | moneysoft (2020) |
| Satellite yield zoning maps (€/year)4 | 60–120 | AgrarCommander (2020) |
1 Cost was given in British pounds (17,500 £). The present value cost in Euro was calculated with the following formula: ((cost of sensor in £ × present nominal exchange rate) × CPI in UK)/CPI in Austria
2 Cost was given in British pounds (15,500 £). The present value cost in Euro was calculated with the following formula: ((Cost of spreader in £ × present nominal exchange rate) × CPI in UK)/CPI in Austria
3 20% VAT included. Includes basic software recording and application, one-time installation fee, and XL data package
CPI, consumer price index; VAT, value added tax
Table 5
Financial data used for calculations
Tabelle 5. Für Berechnungen verwendete Finanzdaten
| Description | Value | Reference |
|---|---|---|
| Calcium ammonium nitrate (€/t)1 | 191 | agrarheute (2020) |
| Milling wheat (12% protein [€/t])2 | 173 | AMA (2020) |
| Diesel (€/l)3 | 1.00 | globalpetrolprices (2020) |
| Exchange rate (€/£)4 | 1.10 | x-rates (2020) |
| CPI in the UK5 | 108.80 | ONS (2020) |
| CPI in Austria5 | 108.00 | Statistik Austria (2020) |
| Lifespan of sensor (years) | 15 | Assumed |
| Salvage value of sensor (%) | 26 | Edwards (2015) |
| List price of pneumatic spreader (€) | 23,000 | ÖKL (2019) |
| Salvage value of pneumatic spreader (%)6 | 40 | Edwards (2015) |
| Lifespan of precision spreader (years) | 10 | Assumed |
| Salvage value of precision spreader (%) | 35 | Edwards (2015) |
| Repair and maintenance of sensor (%) | 3 | ÖKL (2019) |
| Lifespan of the laptop (years) | 5 | Assumed |
| Insurance (%) | 2 | ÖKL (2019) |
| Interest rate (%)7 | 1.76 | ONB (2020) |
| Inflation rate (%)8 | 1.40 | Statistik Austria (2020) |
| VAT (%) | 20 | PwC (2019) |
| VAT on fertilizers (%) | 13 | OECD (2020) |
Table 6
Additional studies and their change in yield due to the use of crop sensors for VRNA
Tabelle 6. Zusätzliche Studien und deren Ertragsänderung durch den Einsatz von Pflanzensensoren für VRNA
| Type of crop sensor | Δ yield relative to baseline (t/ha) | Study |
|---|---|---|
| Fritzmeier | 1.25 | Galambošová et al. (2015) |
| Hydro N | 0.16 | Link et al. (2002) |
| Yara Hydro N | 0.04 | Mayfield and Trengove (2009) |
[i] Conventional fertilizer application (constant fertilizer rate without sensor) is the baseline for comparison
[ii] VRNA, variable rate nitrogen application
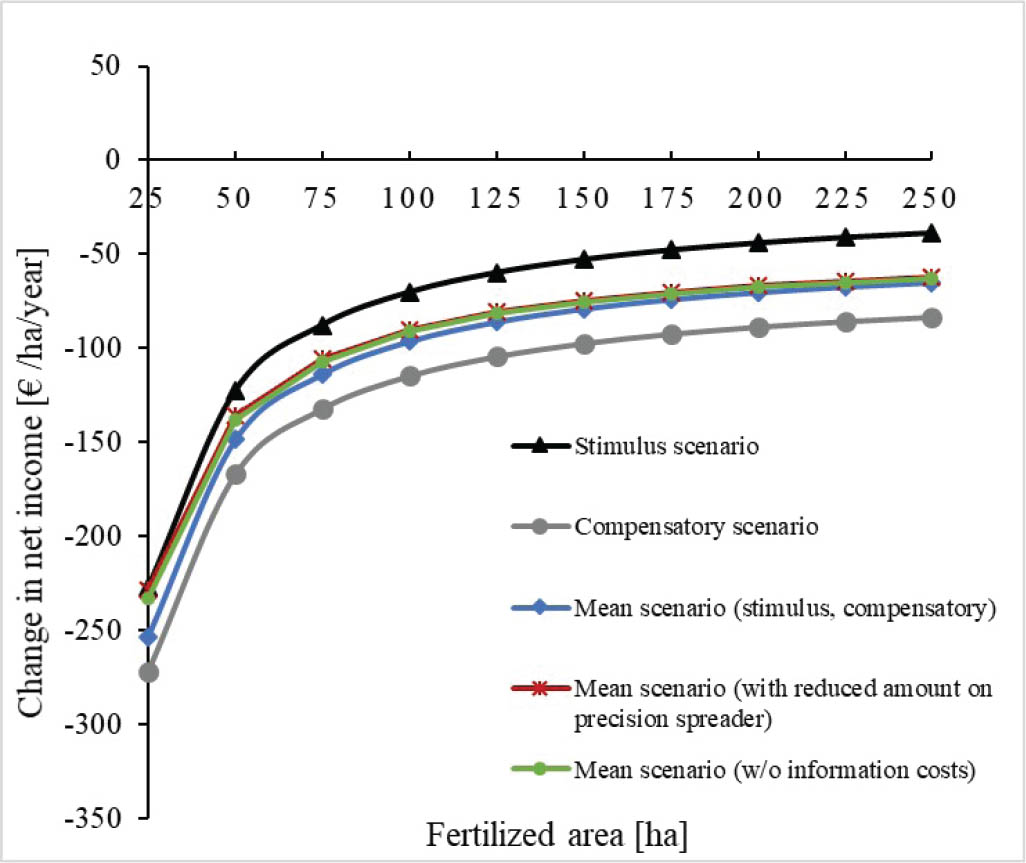
Figure 2
Change in income (€/ha/year) caused by the acquisition and operation of the optical crop sensor for VRNA
VRNA, variable rate nitrogen application
Abbildung 2. Gewinnveränderung (€/ha/Jahr) aufgrund der Anschaffung und Verwendung eines optischen Pflanzensensors für die variable Stickstoffausbringung (VRNA)
Table 7
Payback period to cover the cost of the crop sensor device using the reduced costs from fertilizing rate application savings
Tabelle 7. Amortisationszeit zur Deckung der Kosten für den Pflanzensensor unter Verwendung der reduzierten Kosten durch die Einsparungen bei der Düngerausbringung
| Fertilized area in ha | Mean of stimulus and compensatory scenario |
|---|---|
| 25 | 331.2 |
| 50 | 165.6 |
| 75 | 110.4 |
| 100 | 82.8 |
| 125 | 66.2 |
| 150 | 55.2 |
| 175 | 47.3 |
| 200 | 41.4 |
| 225 | 36.8 |
| 250 | 33.1 |
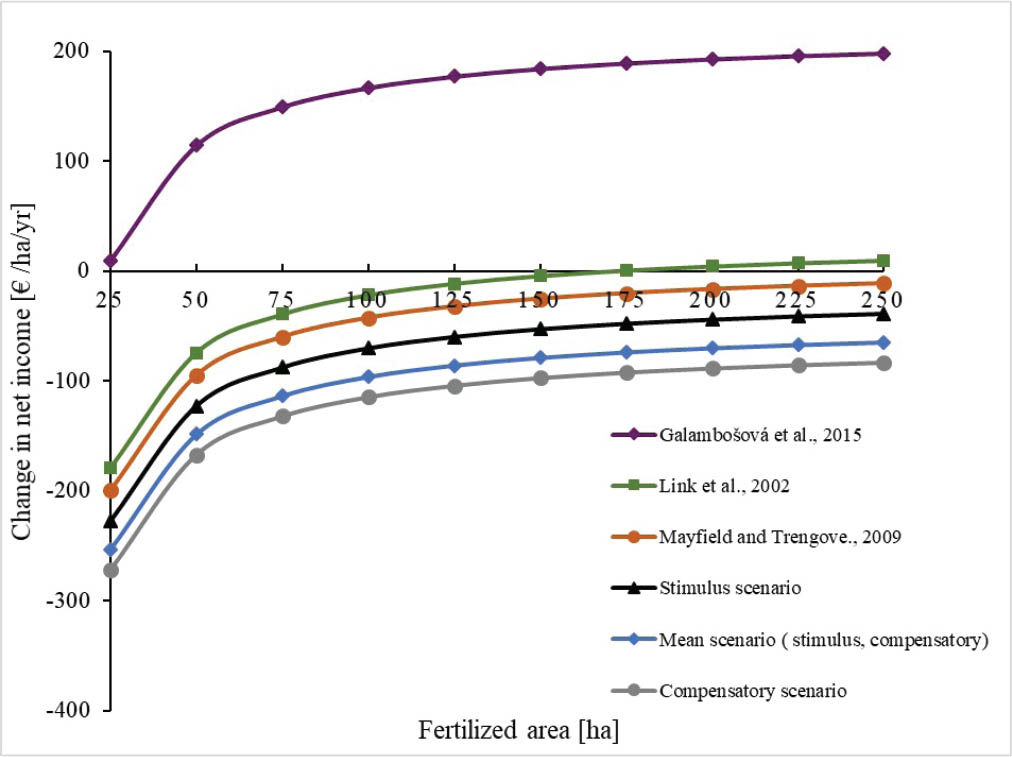
Figure 3
Comparison of scenarios using yield data from other fielded experiments implementing the same or similar crop sensor
Abbildung 3. Szenarienvergleich unter Verwendung von Ertragsdaten aus anderen Feldversuchen bei Einsatz des gleichen oder eines ähnlichen Pflanzensensors