
Figure 1

Figure 2

Figure 3

Figure 4

Figure 5

Figure 6
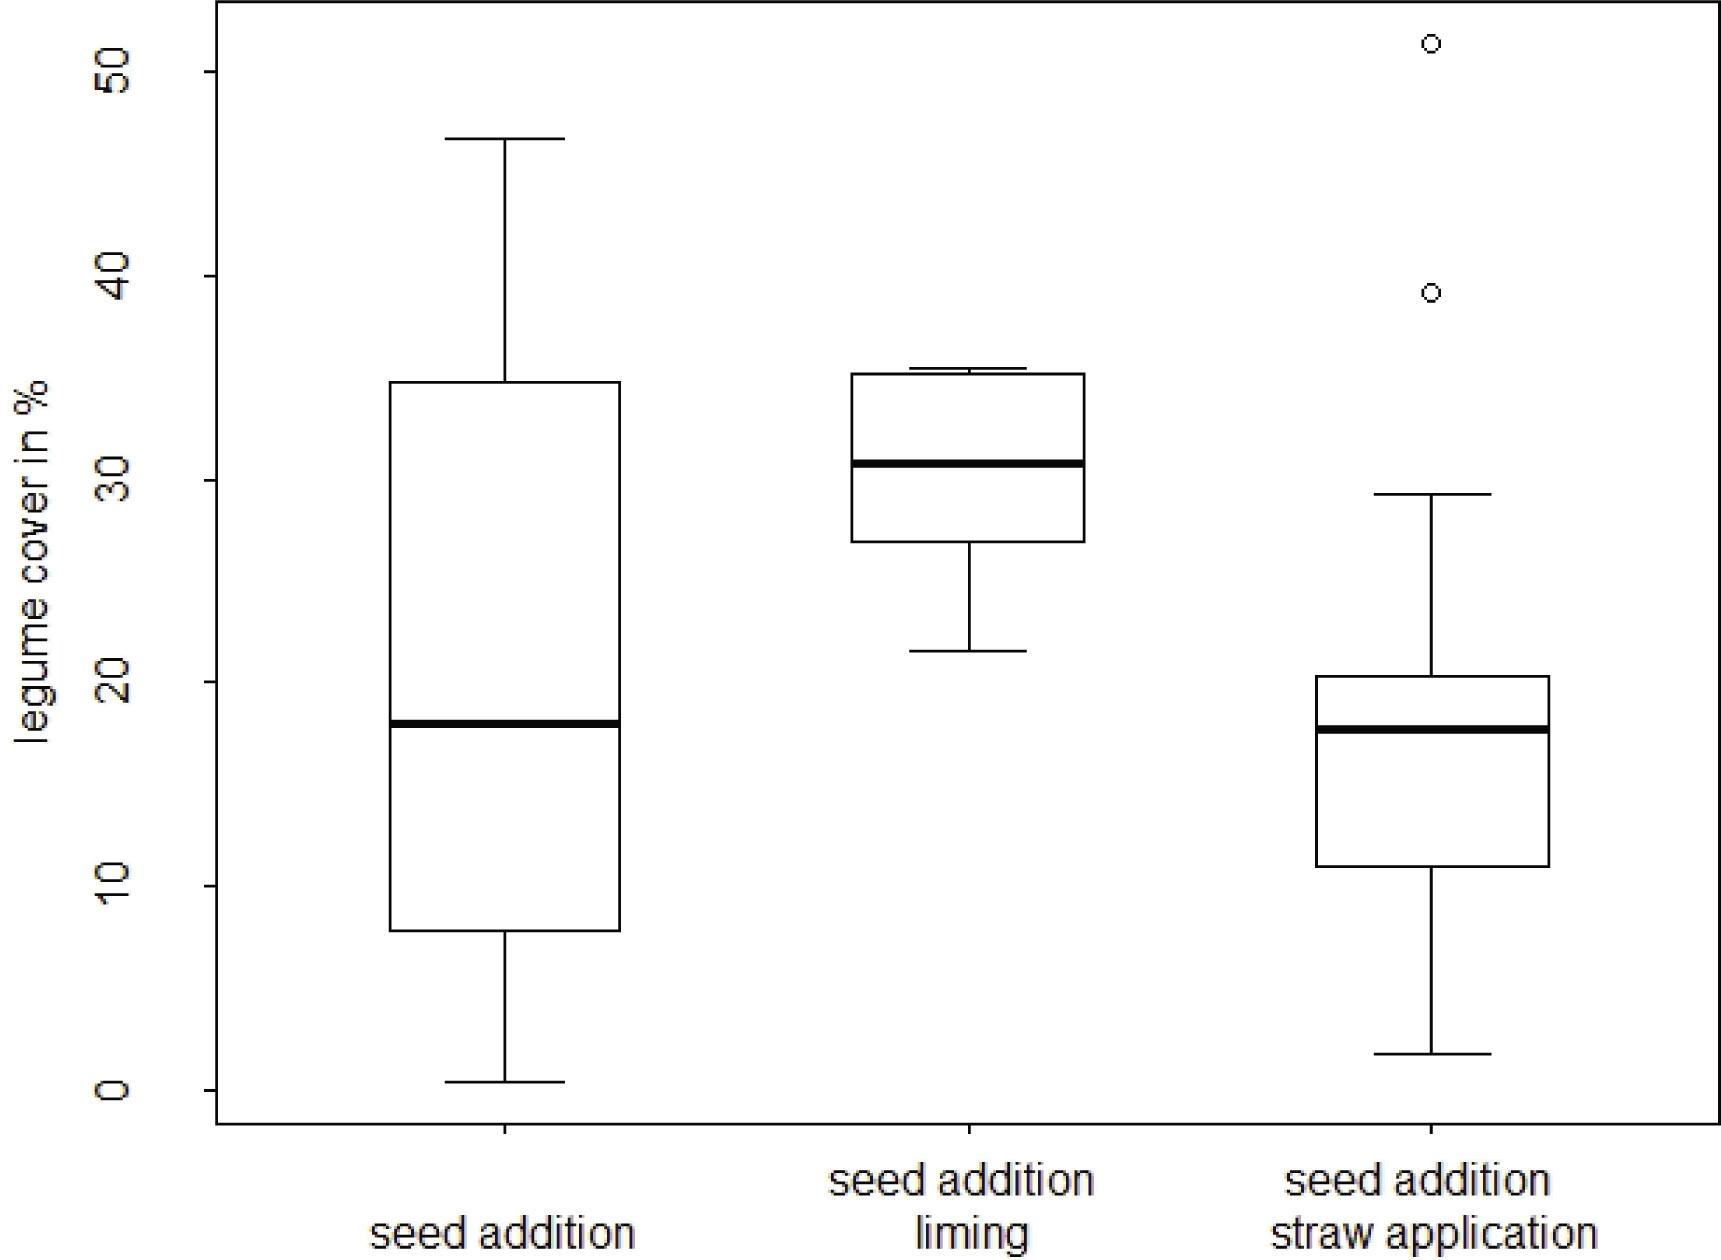
Figure 7

Figure 8

Figure 9

Figure 10

Species density (number of vascular plant species per plot, 4 m × 4 m), total vegetation cover, proportion of grasses, herbs and legumes on vegetation cover, bryophyte cover and percentage of non-sown species (proportion of non-sown species of the total number of plant species per plot) according to the revegetation measure_ V% = variation coefficient (%)_Tabelle 2_ Artendichte (Anzahl Gefäßpflanzen pro Aufnahmefläche, 4 m × 4 m), Vegetationsdeckungsgrad, Anteil der Gräser, Kräuter und Leguminosen an der Vegetationsdecke, Moosdeckung und Anteil nicht angesäter Arten an der Gesamtartenzahl pro Aufnahmefläche in Abhängigkeit von der Wiederbegrünungsmaßnahme_ V% = Variabilitätskoeffizient (%)_
| unsown | seed addition | seed addition and liming | seed addition and straw application | seed addition and manure application | |
|---|---|---|---|---|---|
| number of plots | 27 | 27 | 5 | 19 | 1 |
| species density (mean) | 13 | 31 | 22 | 27 | 19 |
| V% | 48 | 34 | 33 | 31 | |
| species density (median) | 11 | 29 | 17 | 24 | |
| mean vegetation cover (%) | 2 | 56 | 58 | 36 | 75 |
| V% | 133 | 43 | 20 | 54 | |
| proportion of grasses (%) | 33 | 27 | 17 | 26 | |
| V% | 43 | 27 | 65 | ||
| proportion of herbs (%) | 1 | 1 | 1 | 1 | |
| V% | 78 | 20 | 53 | ||
| proportion of legumes (%) | 22 | 30 | 18 | 48 | |
| V% | 68 | 19 | 65 | ||
| mean bryophyte cover (%) | 0.4 | 5 | 10 | 2 | 1 |
| V% | 87 | 108 | 0 | 166 | |
| mean non-sown species (%) | 67 | 48 | 61 | 42 | |
| V% | 14 | 26 | 18 |
Species composition of the seed mixtures used for revegetation of mudflow deposits and proportion (weight per cent) of each species (Die Saat, 2014)_ H = permanent pasture for harsh environmental conditions, G = permanent pasture_Tabelle 1_ Artenzusammensetzung der verwendeten Saatgutmischungen und Anteil (Gewichtsprozent) jeder Art (Die Saat, 2014)_ H = Dauerweide für raue Lagen, G = Dauerweide_
| Plant species | Seed mixtures % | |
|---|---|---|
| H | G | |
| Trifolium repens | 10 | 15 |
| Trifolium hybridum | 5 | 0 |
| Lotus corniculatus | 5 | 5 |
| Poa pratensis | 20 | 25 |
| Festuca pratensis | 15 | 15 |
| Phleum pratense | 15 | 10 |
| Festuca rubra | 10 | 10 |
| Dactylis glomerata | 5 | 10 |
| Lolium perenne | 5 | 10 |
| Agrostis capillaris | 5 | 0 |
| Cynosurus cristatus | 5 | 0 |
Mean cover (%) of sown species according to the revegetation measure_ n = number of plots, f = frequency (%), mc = mean cover (%) of the sown species, V = variation coefficient (%)_Tabelle 3_ Mittlere Deckung der angesäten Arten in Abhängigkeit von der Wiederbegrünungsmaßnahme_ n = Anzahl der Aufnahmeflächen, f = Stetigkeit (%), mc = mittlere Deckung (%) der angesäten Art, V = Variabilitätskoeffizient (%)_
| seed addition (n = 27) | seed addition and liming (n = 5) | seed addition and straw application (n = 19) | seed addition and manure application (n = 1) | |||||||||
|---|---|---|---|---|---|---|---|---|---|---|---|---|
| f | mc | V | f | mc | V | f | mc | V | f | c | V | |
| Trifolium repens | 100 | 16.37 | 67 | 100 | 29.00 | 0 | 100 | 18.97 | 51 | 38.5 | ||
| Trifolium hybridum | 96 | 3.52 | 111 | 100 | 2.40 | 34 | 100 | 7.74 | 86 | 22.0 | ||
| Lotus corniculatus | 100 | 6.12 | 85 | 100 | 4.60 | 133 | 100 | 5.79 | 82 | 15.5 | ||
| Poa pratensis | 15 | 0.07 | 267 | 40 | 0.14 | 186 | 37 | 0.22 | 135 | 0.6 | ||
| Festuca pratensis | 85 | 1.60 | 113 | 100 | 1.44 | 68 | 100 | 1.99 | 54 | 4.5 | ||
| Phleum pratense | 100 | 1.42 | 57 | 100 | 1.44 | 68 | 100 | 1.83 | 55 | 3.0 | ||
| Festuca rubra | 100 | 12.38 | 54 | 100 | 18.10 | 20 | 100 | 15.61 | 35 | 15.5 | ||
| Dactylis glomerata | 100 | 1.35 | 69 | 100 | 1.62 | 53 | 100 | 1.86 | 51 | 4.5 | ||
| Lolium perenne | 92 | 6.18 | 97 | 100 | 2.10 | 39 | 100 | 2.98 | 73 | 15.5 | ||
| Agrostis capillaris | 100 | 13.48 | 73 | 100 | 3.00 | 0 | 100 | 3.33 | 146 | 1.5 | ||
| Cynosurus cristatus | 50 | 1.04 | 137 | 100 | 4.24 | 150 | 63 | 1.77 | 116 | 3.0 | ||