
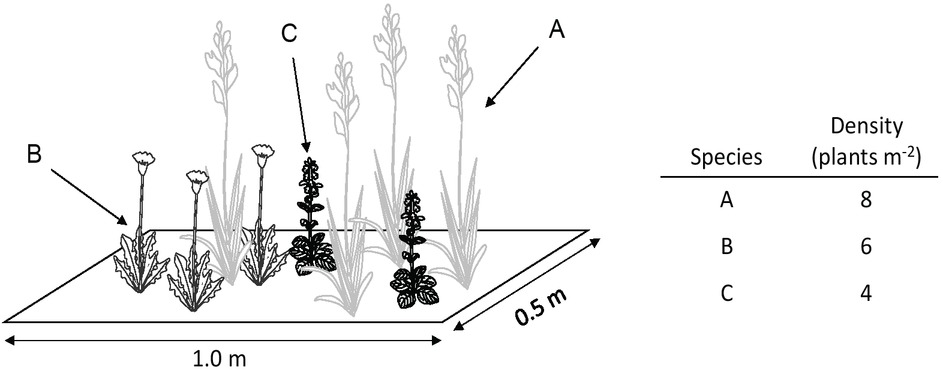
Figure 1
Plant density
Abbildung 1. Pflanzendichte
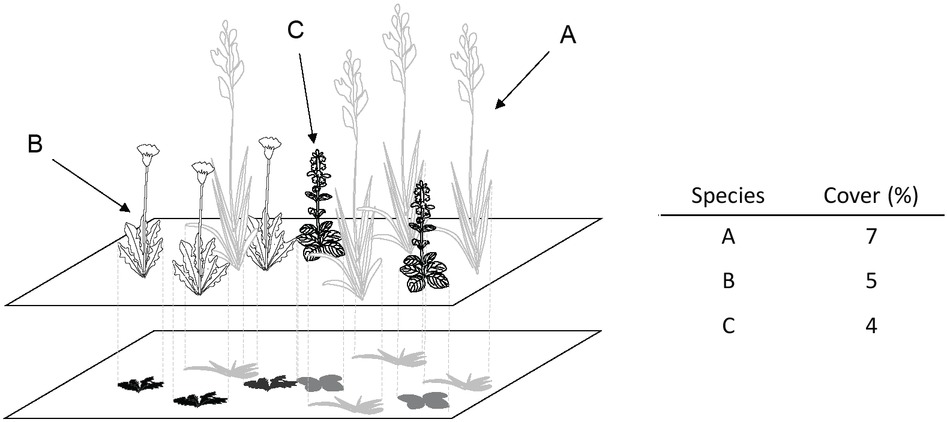
Figure 2
Plant cover
Abbildung 2. Deckungsgrad
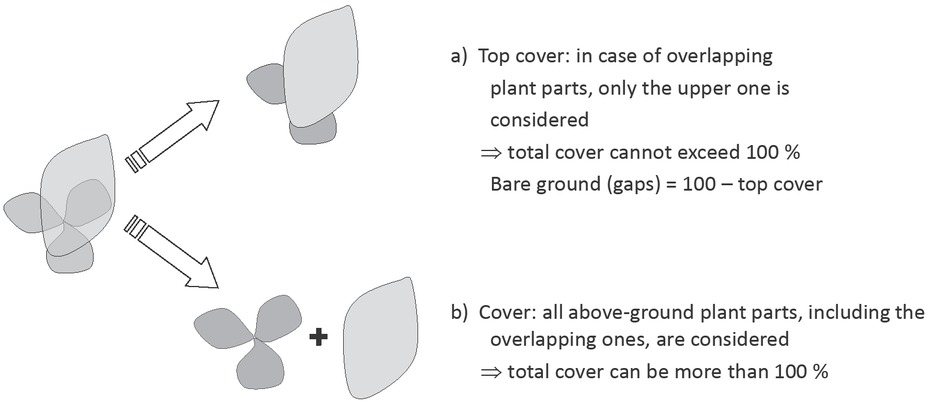
Figure 3
Difference between a) top cover and b) cover in case of overlapping plant parts
Abbildung 3. Unterschied zwischen a) Deckungsgrad unter Berücksichtigung nur der oberen Pflanzenteile im Fall von Überlappungen (top cover) und b) Deckungsgrad unter Berücksichtigung aller Schichten
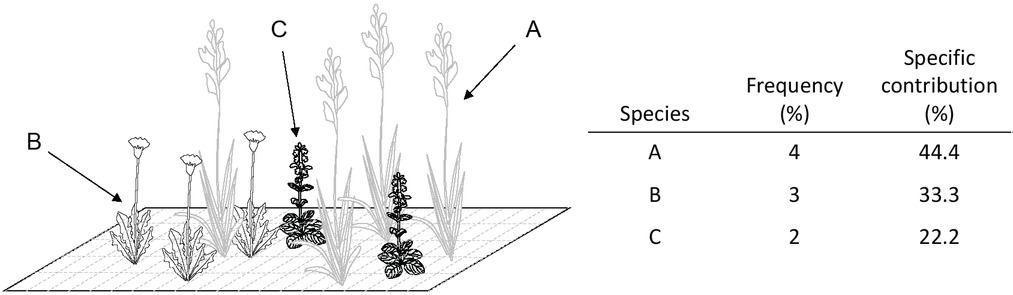
Figure 4
Frequency and specific contribution. The surveyed area has been divided into 100 sub-areas
Abbildung 4. Häufigkeit und spezifischer Anteil. Die Erhebungsfläche wurde in 100 Teilflächen unterteilt
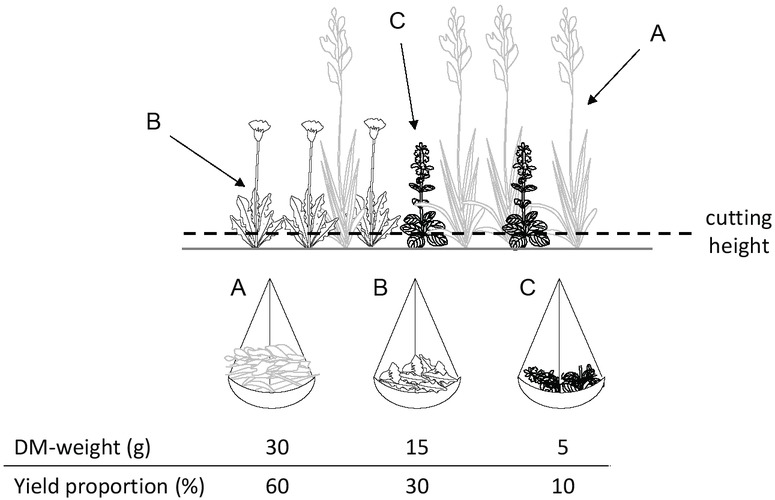
Figure 5
Yield proportion
Abbildung 5. Ertragsanteil
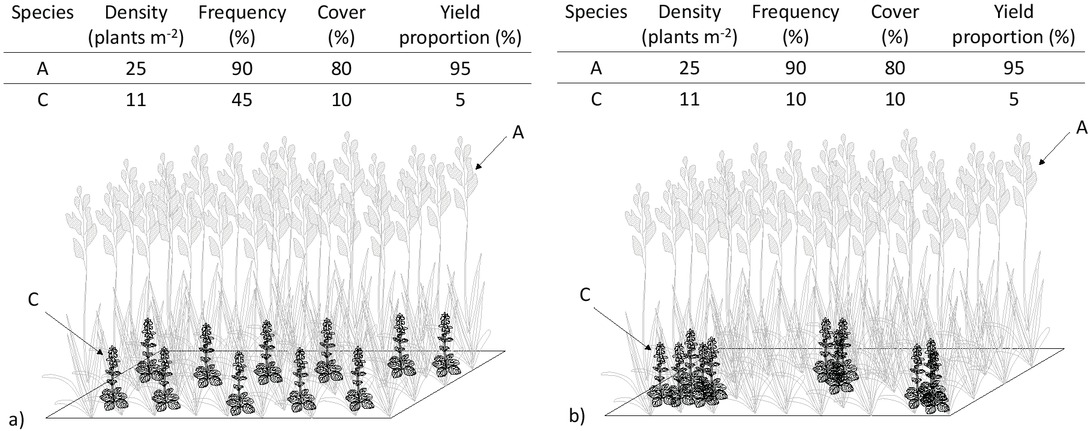
Figure 6
Expression of various parameters depending on the plant size and distribution in the sward
Abbildung 6. Ausprägung unterschiedlicher Parameter in Abhängigkeit von Pflanzengröße und -verteilung im Bestand
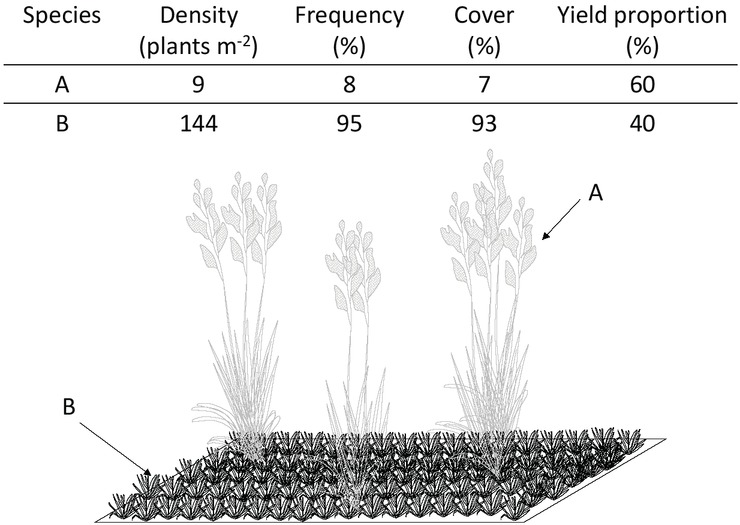
Figure 7
Different expression of cover and yield proportion in a combination of tall, clumped individuals (species A) and a dense, short vegetation (species B)
Abbildung 7. Unterschiedliche Ausprägung von Deckungsgrad und Ertragsanteil bei Mischbeständen mit großwüchsigen, gruppierten Individuen (Art A) und einer dichten niedrigwüchsigen Vegetation (Art B)
Table 1
Classification of a plant community based on different botanical parameters (Weinzierl, 1902)
Tabelle 1. Klassifizierung der Pflanzengesellschaft auf Basis unterschiedlicher botanischer Parameter (Weinzierl, 1902)
| Species | Yield proportion (%) | Cover (%) |
|---|---|---|
| Common reed (Phragmites communis) | 25 | 5 |
| Canary grass (Phalaris arundinacea) | 20 | 5 |
| Tall fescue (Festuca arundinacea) | 18 | 10 |
| Bent grass (Agrostis vulgaris) | 17 | 65 |
| 15 other species | 20 | 15 |
| total | 100 | 100 |
| grassland type | = Phragmitetum | = Agrostietum |
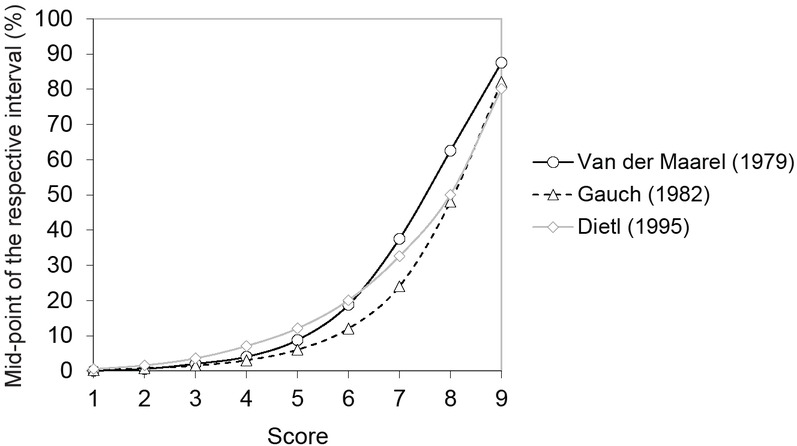
Figure 8
Comparison of different nine-part logarithm-like scales
Abbildung 8. Vergleich unterschiedlicher neunteiliger, logarithmusähnlicher Skalen
Table 2
Information about forage yield, forage quality and suitability for forage conservation deducible from the sward type
Tabelle 2. Aus dem Pflanzenbestandestyp ableitbare Informationen über Futterertrag, Futterqualität und Eignung zur Futterkonservierung
| Sward type | Rich in grasses | Balanced | Rich in forbs | Rich in legumes |
|---|---|---|---|---|
| Yield potential | ++ | + | + | - |
| Crude protein potential | - | + | + | ++ |
| Forage quality stability along phenological development at the first cut | - | + | + | ++ |
| Easiness of silage conservation | ++ | + | - | - |
| Drying speed | ++ | + | - a | + |
| Risk of crumbling losses | - | - | + | + |
| Risk of contamination with soil | - | - | + | +/++ |
[i] ++ high, + medium, - low; a particularly in case of forbs with rough stems
Table 3
Calculation example for the mean cover proportion of a species (CS) occurring in replicate plots with different total cover of vegetation (CV)
Tabelle 3. Berechnungsbeispiel zur Ermittlung des durchschnittlichen Deckungsgrades einer Art (CSmean) bei Vorliegen unterschiedlicher Gesamtdeckungsgrade (CV) in Wiederholungsflächen
| Replicate plot | CS (area-%) | CV (area-%) | CSZ (area-%) |
|---|---|---|---|
| 1 | 20 | 140 | 14.3 |
| 2 | 25 | 110 | 22.7 |
| 3 | 20 | 125 | 16.0 |
| 4 | 25 | 115 | 21.7 |
| Average | 22.5 | 121.3 | 18.7 |
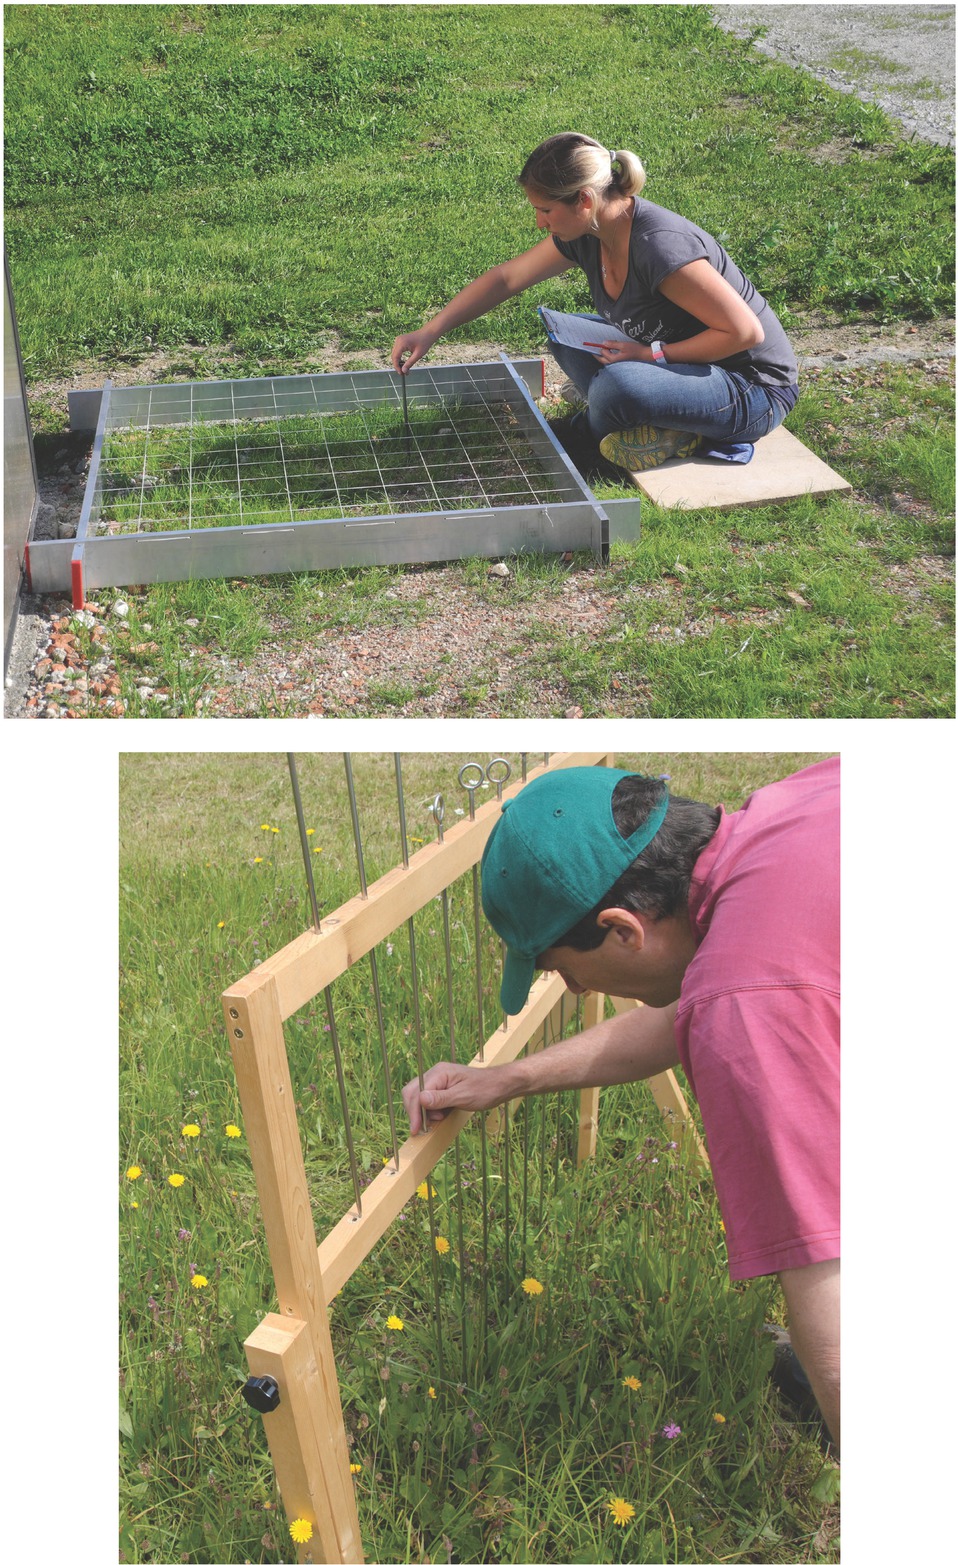
Figure 9
Different frames used for the point intercept method
Abbildung 9. Unterschiedliche Rahmenbauweisen für die Durchführung der Punkt-Quadrat-Methode
Table 4
Suitability and specific properties of selected survey methods for grassland vegetation
Tabelle 4. Eignung und spezifische Eigenschaften ausgewählter Erhebungsmethoden für Pflanzenbestände im Grünland
| Method | Recordable parameters | Properties and requirements | |||||||
|---|---|---|---|---|---|---|---|---|---|
| Density | Cover | Yield proportion | Frequency | Accuracy/Repeatability | Subjectivity | Time effort | Need for special devices | Dependency on weather conditions | |
| Visual estimation | x | x | +* | ++++ | +** | - | + | ||
| Counting frame | x | +++ | + | + | + | + | |||
| Frequency frame | x | ++ | + | ++ | + | + | |||
| Linear analysis | x | x | ++ | + | +++ | + | + | ||
| Point intercept | x | x | x | ++ | + | +++ | ++ | ++ | |
| Manual separation | x | +++ | + | ++++ | + | - | |||
| Photography*** | (x) | x | x | +++ | - | + | +++ | +++ | |
| Spectrometry**** | +++ | - | + | ++++ | ++++ | ||||
[i] Legend: - no, + low, ++ medium, +++ high, ++++ very high;
* depends on the experience and skills of the observer; repeatability can be raised with increased accuracy
** using interval-based scales reduces the time effort
*** suitable for single target species (i.e. a single weed species) or simple swards (i.e. binary clover-grass mixtures)
**** suitable for indices at a community level