
Figure 1
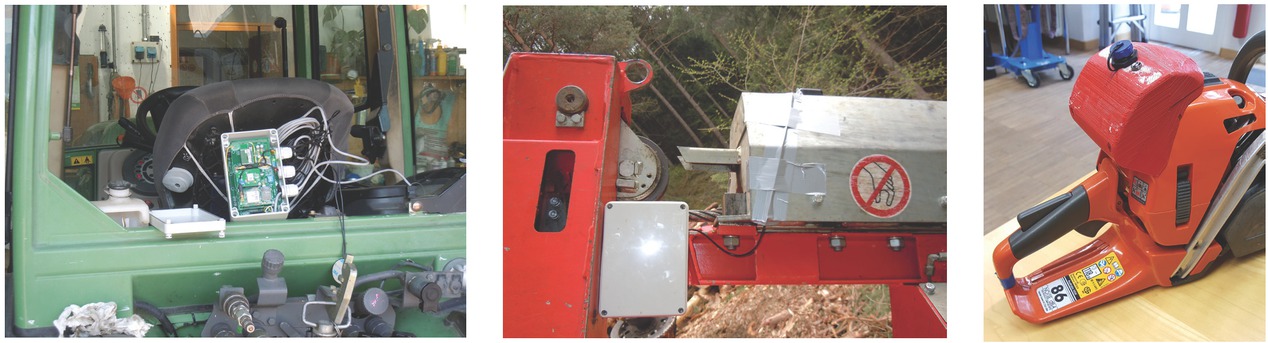
Three developed FDLs: On the left side the Tractor-FDL, in the center the Yarder-FDL, and on the right side the Chainsaw-FDL. The Tractor-FDL is the energy supplied by the electric circuit of the tractor, while the others foreseen the use of external batteries.
Abbildung 1. Die Abbildungen zeigen die drei FDL: links der Traktor-FDL, in der Mitte der Kippmastgerät-FDL und rechts der Kettensägen--FDL. Der Traktor-FDL wird durch den Stromkreis des Traktors mit Energie versorgt, während die anderen die Verwendung von externen Batterien vorsehen.
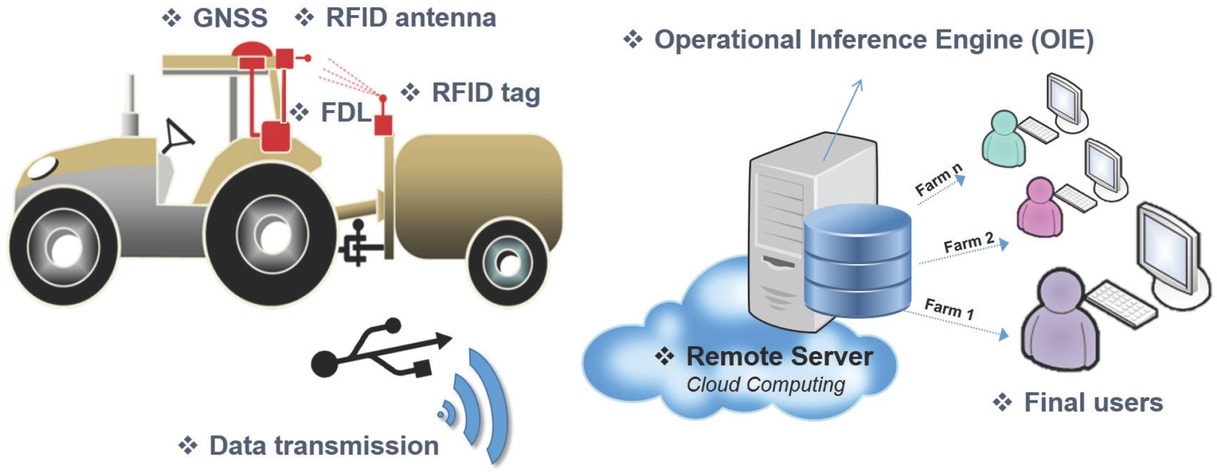
Figure 2
The conceptual model followed is reported. On the left side the collection and transmission of the raw data and on the right side their elaboration and consulting through a Web-GIS platform.
Abbildung 2. Das angewandte Konzeptmodell: Links die Sammlung und Übertragung der Rohdaten, rechts ihre Ausarbeitung und Beratung durch eine Web-GIS-Plattform.
Table 1
Tractor-FDL: Summary of the results obtained for the manual and automatic operational monitoring. A_S: automatic survey, M_S: manual survey.
Tabelle 1. Traktor-FDL: Zusammenfassung der Ergebnisse für die manuelle und automatische Betriebsüberwachung. A_S: automatische Vermessung, M_S: manuelle Vermessung.
| Total time | Mean time | Standard Deviation | Difference | R2 | |||||
|---|---|---|---|---|---|---|---|---|---|
| A_S | M_S | A_S | M_S | A_S | M_S | – | % | ||
| Working session (s) | 1519.2 | 1517.2 | 66.1 | 66.0 | 49.0 | 49.0 | −0.09 | −0.1% | 0.998 |
| Effective work (s) | 847.5 | 831.7 | 36.8 | 36.2 | 26.5 | 21.3 | −0.69 | −1.9% | 0.827 |
| Stops (s) | 490.3 | 481.1 | 21.3 | 20.9 | 18.7 | 23.0 | −0.40 | −1.9% | 0.907 |
| Displacements (s) | 181.9 | 204.4 | 7.9 | 8.9 | 4.7 | 8.3 | 0.98 | 11.0% | 0.641 |
Table 2
Yarding-FDL: Summary of the gross time of working cycle for each data set. Data include data set with missed cycles. A_S: automatic survey, M_S: manual survey.
Tabelle 2. Kippmastgerät-FDL: Zusammenfassung der Bruttozeit des Arbeitszyklus für jeden Datensatz. Daten beinhalten Datensätze mit verpassten Zyklen. A_S: automatische Vermessung, M_S: manuelle Vermessung.
| No. of cycles | Gross time | Average | Standard Deviation | R2 | ||||||||
|---|---|---|---|---|---|---|---|---|---|---|---|---|
| A_S | M_S | A_S | M_S | A_S | M_S | A_S | M_S | |||||
| Working session (s) | 220 | 228 | 138536 | 138157 | 638.4 | 636.7 | 323.6 | 324.3 | 0.886 | |||
| Difference (s) | 8 | −379 | −1.75 | – | ||||||||
Table 3
Yarding-FDL: Statistics of the elemental time study recorded during the cable logging working cycles. Missed cycles were not considered. A_S: automatic survey, M_S: manual survey.
Tabelle 3. Kippmastgerät-FDL: Statistiken der Elementarzeitstudie, die während der Arbeitszyklen der Kabelprotokollierung aufgezeichnet wurden. Verpasste Zyklen wurden nicht berücksichtigt. A_S: automatische Vermessung, M_S: manuelle Vermessung.
| Average | Standard Deviation | Difference | R2 | ||||
|---|---|---|---|---|---|---|---|
| A_S | M_S | A_S | M_S | – | (%) | ||
| Outhaul (s) | 99.7 | 99.1 | 60.6 | 59.3 | 0.61 | 1% | 0.563 |
| Hook (s) | 288.2 | 295.6 | 208.7 | 215.6 | −7.4 | −7% | 0.880 |
| Inhaul (s) | 163 | 153.8 | 84.1 | 82.9 | 9.7 | 9% | 0.663 |
| Unhook (s) | 87.4 | 88.1 | 166.2 | 160.8 | 0.6 | −1% | 0.930 |
Table 4
Yarding-FDL: Summary of the automatic weight assessment: In this table the results obtained by the two repetitions are reported. The average weight measured as reference was 40.2 kg.
Tabelle 4. Kippmastgerät-FDL: Zusammenfassung der automatischen Gewichtsmessung: Die Tabelle zeigt die Ergebnisse der beiden Wiederholungen. Das Durchschnittsgewicht, gemessen als Referenz, betrug 40,2 kg.
| Repetition 1 | Repetition 2 | |||||||
|---|---|---|---|---|---|---|---|---|
| CK-2% | CK-5% | CK-10% | CK-20% | CK-2% | CK-5% | CK-10% | CK-20% | |
| Average (kg) | 41.4 | 42.2 | 40.2 | 41.7 | 40.8 | 38.4 | 39.5 | 38.6 |
| Difference (kg) | −1.2 | −2.0 | 0.0 | −1.5 | −0.6 | 1.8 | 0.7 | 1.6 |
| (%) | −2.9% | −5.1% | −0,1% | −3.8% | −1.6% | 4.4% | 1.9% | 4.0% |
| R2 | 0.980 | 0.990 | 0.996 | 0.995 | 0.981 | 0.965 | 0.990 | 0.948 |
Table 5
Chainsaw-FDL: The data collected by manual survey and those obtained by the OIE’s elaborations are reported and compared. A_S: automatic survey, M_S: manual survey.
Tabelle 5. Motorsäge-FDL: Zusammenfassung der validierten Ergebnisse. Die Tabelle zeigt die Messungen und deren Vergleich, die bei der manuellen Erhebung und den OIE-Berechnungen vorgenommen wurden. A_S: automatische Vermessung, M_S: manuelle Vermessung.
| Sum | Average | Standard Deviation | Difference | R2 | |||||
|---|---|---|---|---|---|---|---|---|---|
| A_S | M_S | A_S | M_S | A_S | M_S | – | % | ||
| Time study (s) | 735.4 | 639 | 81.7 | 71.0 | 45.95 | 42.56 | −10.7 | −15.1% | 0.909 |
| Stump diameter (cm) | 483.1 | 491 | 53.7 | 54.6 | 15.65 | 17.20 | 0.9 | 1.6% | 0.893 |
| Breast height diameter (cm) | 361.5 | 353 | 40.2 | 39.2 | 10.80 | 12.30 | −0.9 | −2.4% | 0.928 |
| Volume (m3) | 16.58 | 16.49 | 1.84 | 1.83 | 0.99 | 1.12 | 0.0 | −0.5% | 0.932 |
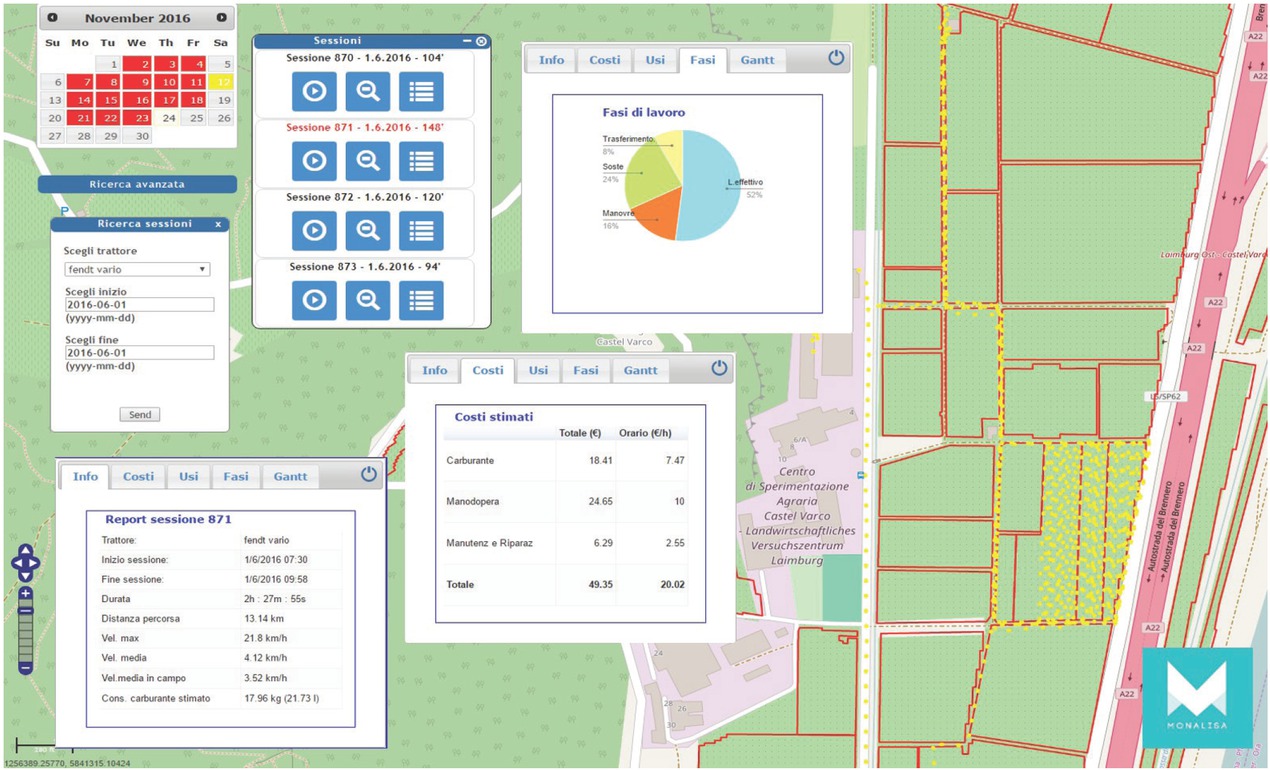
Figure 3
Example of graphical output. All the elaborations are displayed on Web-GIS tool.
Abbildung 3. Beispiel für ein grafisches Output. Alle Ausarbeitungen werden auf einem Web-GIS-Tool angezeigt.