
Table 1.
Demographic and anthropometric characteristics. Values are presented as mean (minimum–maximum).
| Characteristic | Normal-weight group (n = 25) | Overweight/obese group (n = 25) |
|---|---|---|
| Age, years | 32.1 (22–46) | 31.2 (21–42) |
| Height, cm | 166.72 (151–178) | 165.78 (150–179) |
| BMI, kg/m2 | 21.27 (19–24) | 36.31 (26–47) |
Table 2.
Target miRNAs meeting the predefined >2-fold higher-expression threshold in the overweight/obese pooled sample. P-values are nominal and unadjusted.
| miRNA | Fold change | Exact p-value | Interpretation |
|---|---|---|---|
| miR-100-5p | 2.67 | 0.293932 | Non-significant fold-change trend |
| miR-106b-5p | 2.27 | 0.135031 | Non-significant fold-change trend |
| miR-133b | 6.62 | 0.205666 | Non-significant fold-change trend |
| miR-192-5p | 2.02 | 0.436563 | Non-significant fold-change trend |
| miR-200a-3p | 3.97 | 0.353263 | Non-significant fold-change trend |
| miR-200b-3p | 3.94 | 0.173488 | Non-significant fold-change trend |
| miR-20a-5p | 3.66 | 0.314082 | Non-significant fold-change trend |
| miR-21-5p | 2.58 | 0.030266 | Meets nominal p < 0.05 |
| miR-214-3p | 2.53 | 0.209446 | Non-significant fold-change trend |
| miR-222-3p | 2.45 | 0.138196 | Non-significant fold-change trend |
| miR-27a-3p | 5.18 | 0.257703 | Non-significant fold-change trend |
| let-7c-5p | 3.99 | 0.268329 | Non-significant fold-change trend |
| miR-10a-5p | 2.18 | 0.201061 | Non-significant fold-change trend |
| miR-191-5p | 2.80 | 0.353809 | Non-significant fold-change trend |
| miR-22-3p | 6.44 | 0.185505 | Non-significant fold-change trend |
| miR-24-3p | 8.49 | 0.344617 | Non-significant fold-change trend |
| miR-26a-5p | 3.73 | 0.246393 | Non-significant fold-change trend |
[i] Fifteen target miRNAs met the <0.5-fold threshold in the overweight/obese pooled sample: miR-124-3p, miR-141-3p, miR-195-5p, miR-200c-3p, miR-205-5p, miR-223-3p, miR-224-5p, miR-574-3p, miR-130b-3p, miR-145-5p, miR-193a-5p, miR-30e-5p, miR-374a-5p, miR-7-5p, and miR-31-5p. None met the nominal p < 0.05 threshold. Their exact fold changes and p-values are reported in Supplementary Table S1.
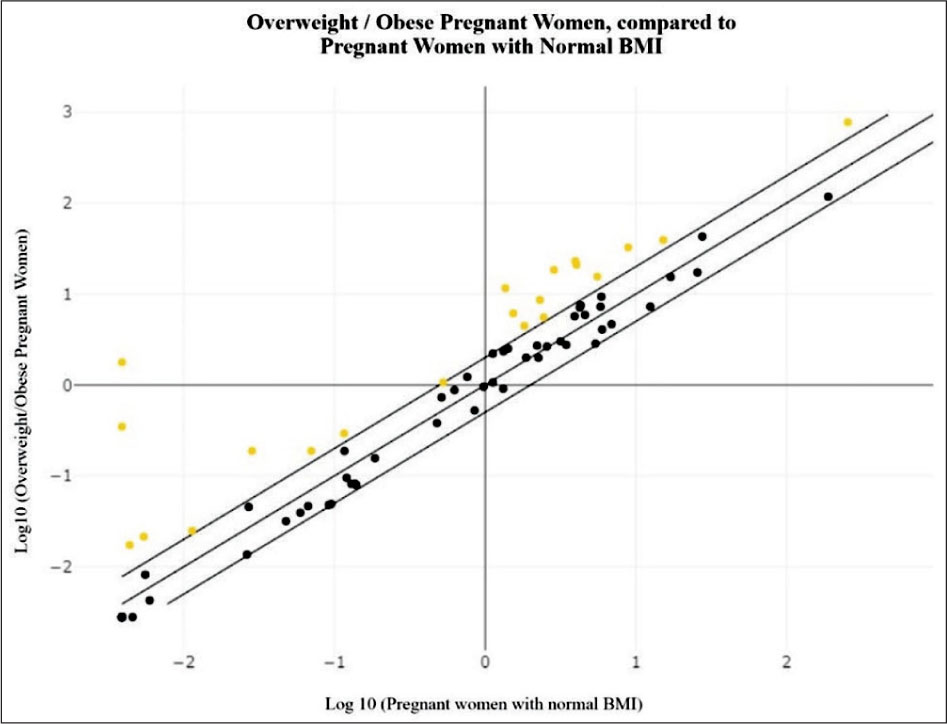
Figure 1.
GeneGlobe scatter plot of pooled plasma miRNA-expression measurements in overweight/obese and normal-weight pregnant women. Yellow points indicate assay signals meeting the predefined twofold fold-change threshold; this visual threshold does not itself indicate statistical significance. The plot includes target and reference/quality-control miRNA assays. The central diagonal represents equal relative expression, and the outer diagonals represent twofold differences.