
Table 1.
Demographic, clinical, dialysis, variability and transplantation-related parameters.
| N=84 | Mean value ± SD N (%) |
|---|---|
| Age (years) | 37.57 ± 12.34 |
| Male (%) | 59 (70) |
| Hypertension (%) | 64 (76) |
| Diabetes (%) | 8 (9) |
| Preemtive transplantation (%) | 10(12) |
| Dialysis treatment prior transplantation (%) | 74( 88) |
| Dialysis vintage (months) | 32.26 ± 42.93 |
| hemodialysis (%) | 71 (95.94) |
| peritoneal dialysis (%) | 6 (8.1) |
| Brain death donor BDD (%) | 35 (42) |
| Living donor (%) | 49(58) |
| primary kidney disease | |
| Glomerulonephritis | 34 (40) |
| Hypertensive/vascular nephropathy | 7(8) |
| Diabetes Mellitus | 6(7) |
| Tubulointerstitial disease | 16(19) |
| ADPKD | 4(4) |
| Unknown/uncertain etiology | 17(20) |
| CV>30% | 14(17) |
| C0/D<1.05ng/mL/mg | 13(15) |
Table 2.
Detected ABCB1 and CYP3A5* genotypes and functional phenotype.
| Gene | Nucleotide change (SNP) | Genotype | N(%) | Functional phenotype |
|---|---|---|---|---|
| CYP3A5* (rs776746) | 6986A>G | AA (CYP3A5*1/1*) | 1(1.2) | Expressers |
| AG (CYP3A5*1/*3) | 11(13.09) | Expressers | ||
| GG (CYP3A5*3/*3) | 72(86) | Non-expressers | ||
| ABCB1 (rs1045642) | 3435 C>T | CC | 22(26) | High P-gp expression |
| CT | 39(46) | Intermedium expression | ||
| TT | 23(27) | Low P-gp expression |
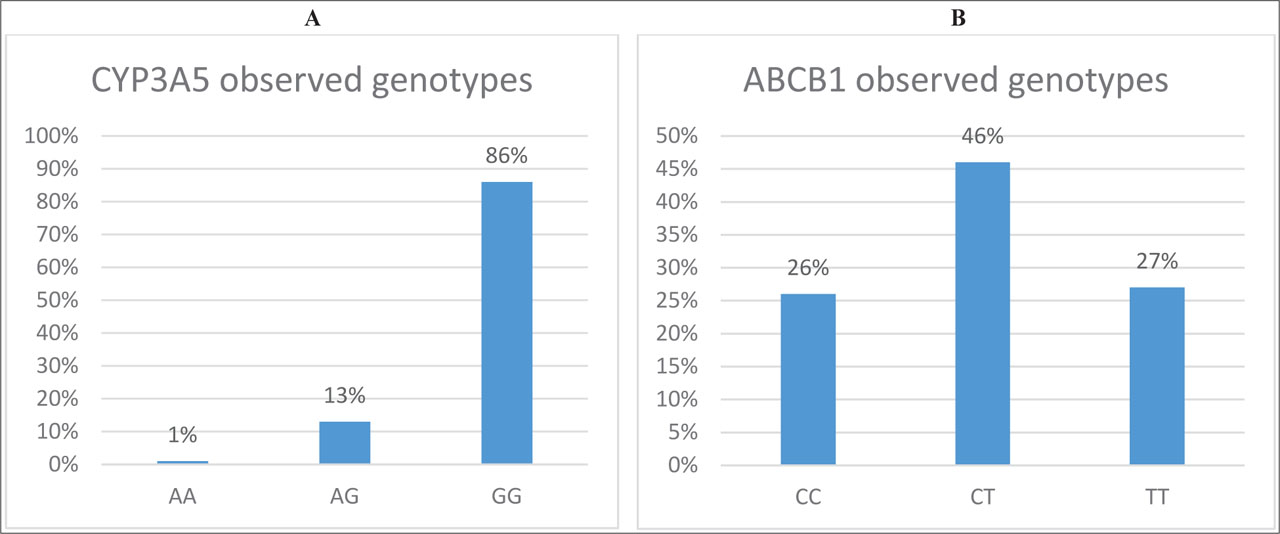
Figure 1.
Genotype distribution of the tested variants for both genes: А– CYP3A5*3 (rs 776746) 6986 A>G, frequencies of AA, AG and GG genotypes; B – ABCB1(rs 1045642) 3435C>T, frequencies of CC, CT and TT genotypes
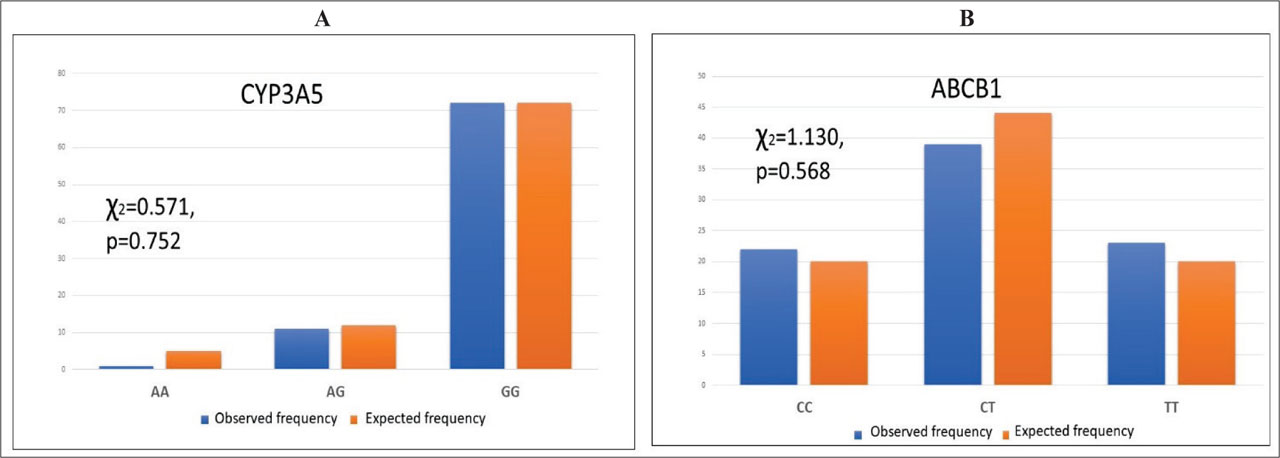
Figure 2.
Hardy-Weinberg equilibrium for genotype distributions А - CYP3A5 genotypes, B - ABCB1 genotypes
Table 3.
Comparative analysis of patients with each genotype for both genes regarding age and gender.
| N=84 | CYP3A5* | ABCB1 | ||||
|---|---|---|---|---|---|---|
| AA + AG (CYP3A5 *1/1*+*1/3*) | GG (CYP3A5 *3/3*) | p | TT+CT (ABCB1) | CC (ABCB1) | p | |
| N=72 Medium rank N0 (%) | N=12 Medium rank N0 (%) | N=61 Medium rank N0 (%) | N=23 Medium rank N0 (%) | |||
| Age (years) | 47.19 | 45.75 | 0.618 | 41.02 | 46.23 | 0.364 |
| Gender (male) | 8(67) | 51(70) | 0.744 | 43(70) | 16(68) | 0.567 |
Table 4.
Association between observed genotypes and tacrolimus variability.
| CYP3A5 | AA/AG | GG | p | ||
|---|---|---|---|---|---|
| N (%) | 12 (14%) | 72 (86%) | |||
| C0D <1.05ng/mL/mg | 7 (58%) | 6 (8%) | 0.001 | 2.01 | 1.114–3.624 |
| CV>30% | 3 (25%) | 11 (15%) | 0.197 | ||
| ABCB1 3435C>T | TT | CT+CC | |||
| N (%) | 23 (27%) | 61 (73%) | |||
| C0D <1.05 ng/mL/mg | 6 (27.3%) | 7 (11.5%) | 0.096 | ||
| C0/D>1.55 | 13 (59.1%) | 47 (77%) | 0.163 | ||
| CV>30% ng/ml/mg | 5 (22.7%) | 9 (14.8%) | 0.507 | ||
| ABCB1 | CC | CT+TT | |||
| N (%) | 22 (26%) | 62 (74%) | |||
| C0D <1.05 ng/mL/mg | 4 (18.2%) | 9 (14.8%) | 0.737 | ||
| C0/D>1.55ng/mL/mg | 17 (77.3%) | 43 (70.5%) | 0.593 | ||
| CV>30% | 3 (13.6%) | 11 (18%) | 0.751 | ||
| ABCB1 | CT | CC+TT | |||
| N (%) | 39 (46%) | 45 (54%) | |||
| C0D <1.05 ng/mL/mg | 3 (7.7%) | 10 (22.7%) | 0.075 | ||
| C0/D>1.55 ng/mL/mg | 30 (76.9%) | 30 (68.2%) | 0.464 | ||
| CV>30% | 6 (15.4%) | 8 (18.2%) | 0.483 |
Table 5.
Tacrolimus daily dosage and variability parameters for CYP3A5 AA and AG genotypes.
| CYP3A5 AA/AG | N=72 | N=12 | p |
|---|---|---|---|
| TAC (ng/mL) | 6.73±1.27 | 6.166 ± 1.28 | 0.157 |
| TAC SD | 1.526 ± 0.63 | 1.369 ± 0.59 | 0.502 |
| Dosage (mg) | 3.206 ± 1.78 | 5.107 ± 2.21 | 0.014 |
| Dosage SD | 0.338 ± 0.33 | 0.572 ± 0.438 | 0.096 |
| CV% TAC | 22.74 ± 8.38 | 23.00 ± 9.39 | 0.931 |
| C0/D (ng/mL/mg) | 2.627 ± 1.30 | 1.505 ± 0.98 | 0.003 |
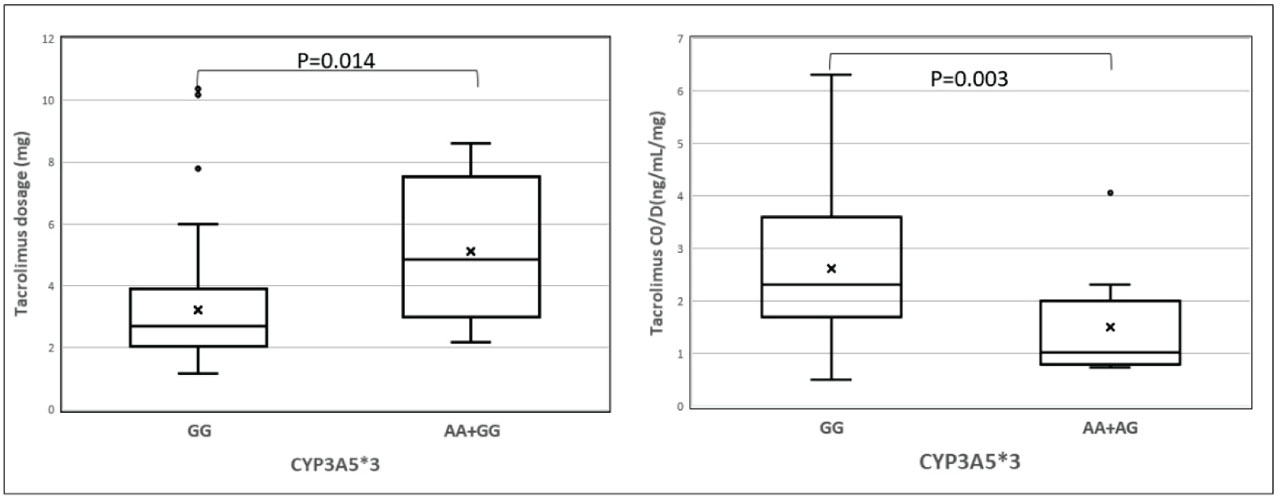
Figure 3
Illustrations of dose regimens for tacrolimus for CYP3A5 genotypes
Table 6.
Tacrolimus daily dosage and variability parameters for ABCB1 TT genotype.
| ABCB1 TT | N=61 | N=23 | p |
|---|---|---|---|
| TAC (ng/mL) | 6.678±1.26 | 6.598 ± 1.35 | 0.803 |
| TAC SD | 1.509 ± 0.58 | 1.504 ± 0.71 | 0.976 |
| Dosage (mg) | 3.279 ± 1.74 | 3.904 ± 2.35 | 0.254 |
| Dosage SD | 0.402 ± 0.33 | 0.443 ± 0.402 | 0.654 |
| CV% TAC | 22.94 ± 8.55 | 22.41 ± 8.45 | 0.795 |
| C0/D (ng/mL/mg) | 2.49 ± 1.26 | 2.40 ± 1.46 | 0.788 |