
INTRODUCTION
Transplantation remains the most favorable choice of renal replacement therapy in patients with end-stage renal disease, necessitating the obligatory use of immunosuppression. For decades, tacrolimus has been the foundation of standard immunosuppressive protocols and the preferred choice among calcineurin inhibitors, significantly improving allograft survival and reducing acute rejections [1]. Despite its well-defined safety and efficacy profile, tacrolimus exhibits narrow therapeutic index and substantially high variability, which can result in unpredictable drug exposure and thereby increase the risk for significant toxicity, adverse reactions or graft rejection [2]. The treatment challenges posed by tacrolimus variability are well recognized and have been extensively analyzed in numerous studies worldwide. The literature suggests that factors such as age, gender, anemia, albumin, drug interactions (azoles and Ca channel blockers), dietary factors and gastrointestinal conditions can influence variability [3,4]. However, many authors also emphasize the important role of genetic polymorphisms [3,4]. Polymorphisms in genes encoding cytochrome P450 3A enzymes and P-glycoprotein (CYP3A5 and ABCB1), which are involved in the metabolism of tacrolimus, are among the most extensively studied genetic factors related to this variability [4,5]. According to several studies, the involvement of CYP3A5 A>G transition et position 6986 in intron 3 (also known as CYP3A5*3 polymorphism) is recognized as a major factor influencing tacrolimus metabolism, contributing to differences in tacrolimus clearance and dose requirements among patients [5,6]. Consequently, based on the recommendation of Clinical Pharmacogenetics Implementation Consortium, genotyping of CYP3A5 has become important tool for optimizing dosing and enabling more personalized immunosuppressive treatment for these patients, even prior the act of transplantation [6,7]. The role of ABCB1 in tacrolimus pharmacokinetics remains controversial and appears to vary across different ethnicities and regions. While some studies suggest that ABCB1 affects drug absorption, distribution and contributes to inter-individual variability in treatment response, others conclude that its influence od tacrolimus metabolism is insignificant [8,9]. Two previous studies conducted in kidney transplanted patients in North Macedonia showed that approximately 12–15% of patients exhibited high variability for tacrolimus. These patients also presented with higher serum creatinine levels, indicating poorer kidney function. Despite age, both studies did not identify any clinical, laboratory factor, nor drug interactions as a causes of this variability. However, neither of these studies included genetic analysis [10,11].
The objective of this study was to assess tacrolimus variability in kidney transplanted recipients and its association with CYP3A5 and ABCB1 genetic polymorphisms in the Republic of North Macedonia.
MATERIALS AND METHODS
We conducted an observational, cohort, single-center study in the unique public kidney transplantation center in the Republic of North Macedonia. The inclusion criteria encountered age above 18 years, standard immunosuppressive protocol with calcineurin inhibitor-tacrolimus, mycophenolic acid, steroids, living and brain-death donor transplantation and signed informed consent-approved by the ethical committee. Patients with poor treatment adherence were excluded from the study. Only clinically stable patients after third month of transplantation were included. Patients that met the following criteria: stable graft function (with serum creatinine fluctuations <15% within the last 30 days), absence of biopsy-proven or suspected acute rejection episodes, no active viral (such as CMV or BK virus nephropathy) or systemic infectious requiring hospitalization, were considered clinically stable after the 3rd post-transplant month [12]. Participants in the study were analyzed for demographics, comorbidities, kidney disease etiology, pre-transplantation dialysis modality, laboratory and data associated with the act of transplantation. To assess intra- and inter-individual variability, whole blood tacrolimus trough concentrations and corresponding dosage prescriptions were sequentially analyzed for each individual patient beyond the third month post-transplantation at multiple consecutive time points. All patients included in the study were maintained on an oral, standard immediate-release formulation of tacrolimus. Blood samples for the determination of tacrolimus trough concentrations (C0) were collected in the morning under fasting conditions, immediately prior to the administration of the next scheduled dose. Therapeutic drug monitoring of tacrolimus was performed at the Institute of Clinical Biochemistry as part of routine clinical analysis using a chemiluminescent microparticle immunoassay (CMIA) for the quantitative determination of tacrolimus in whole blood on the ARCHITECT iSystem (Abbott Laboratories, Abbott Park, IL, USA). The initial dosing regimen was based on the patient’s actual body weight (0.1–0.2 mg/kg) divided into two doses administered every 12 hours. Subsequent dosages were titrated and adjusted until a target range of 5.0–8.0 ng/mL was reached [13]. Tacrolimus concentration values falling below 2.0 ng/mL or exceeding 10.0 ng/mL were either repeated or discarded as invalid.
The coefficient of variation was calculated as ratio between the standard deviation and arithmetic mean value of TAC (from at least 3 to 6 repeated measurements or samples) expressed in percentages, for the period between 6th and 12th month, after the date of transplantation [14]. The inter-patient variability, evaluated via the concentration-to-dose (C0/D) ratio, was analyzed at three specific time points for each patient (3-, 6-, and 12-months’ post-transplantation), and the mean C0/D value was calculated for subsequent statistical analysis across the genotype groups [15]. Peripheral whole blood samples were collected in ethylenediaminetetraacetic acid (EDTA) tubes from all participants for pharmacogenetic analysis, which was conducted anonymously. Single-nucleotide polymorphisms (SNPs) within the target genomic sequences were identified via Real-Time Polymerase Chain Reaction (PCR) based on allelic. All amplification reactions were performed using fluorescent Mx PRO 3005P thermal analyzer (Agilent technologies, Santa Clara, CA USA) utilizing specific TaqMan tests for genotyping of medication-metabolizing genes (TaqMan Drug Metabolism Genotyping Assay) and Taq-Man SNP Genotyping Assay, according to manufacturer’s protocols (Applied Biosystems, Life technologies; Grand Island, NY USA). Specifically, the PCR protocols for genotyping the ABCB1 (rs1045642; assay ID: C__7586657_20) and CYP3A5*3 (rs776746; assay ID: C__26201809_30) variant alleles consisted of an initial denaturation step at 95°C for 10 minutes, followed by 45 cycles of denaturation at 92°C and annealing/extension at 60°C for 60 seconds. All pharmacogenetic analyses were performed at the Center for Biomolecular and Pharmaceutical Analysis, Faculty of Pharmacy, Ss. Cyril and Methodius University in Skopje, North Macedonia.
Statistical analysis was obtained with SPSS version 27. The data was presented as mean, median, standard deviation and compared by Mann-Whitney and Fishers Exact test. Detected genotype distributions were assessed for the Hardy-Weinberg equilibrium with a Chi-Square test (Ӽ2). As cut off values for C0/D the value above 1.05ng/mL/mg indicated slow metabolizers and below 1.55ng/mL/mg - fast metabolizers [16]. For the tacrolimus variability, CV>30% was indicative for a high intra-patient variability [17].
RESULTS
Our study included 84 kidney transplant recipients. Table 1 presents the demographic, clinical, dialysis-related, tacrolimus variability, and transplantation-related characteristics of the study population. Male patients predominated (70%), and the mean age was 37.57 years. Regarding comorbidities, 10% of patients had diabetes, while 76% were diagnosed with hypertension prior to transplantation. According to the ERA registry classification for chronic kidney disease and underlying etiology, patients were classified into six groups (18). The most common cause of kidney disease was glomerulonephritis (40%), while 17% of patients had an undefined etiology. Most patients (88%) underwent dialysis prior to transplantation, with a mean dialysis vintage of 32 months. The number of patients who received a kidney from a living donor was slightly higher than those who underwent brain death donor transplantation ((49 (58%) vs 35 (42%)). Analysis of intra- and inter-individual variability showed low C0/D (<1.05 ng/mL/mg) in 15% of patients and high intra-patient variability (IPV), defined as CV > 30%, in 17% of the study population (Table 1).
Table 1.
Demographic, clinical, dialysis, variability and transplantation-related parameters.
| N=84 | Mean value ± SD N (%) |
|---|---|
| Age (years) | 37.57 ± 12.34 |
| Male (%) | 59 (70) |
| Hypertension (%) | 64 (76) |
| Diabetes (%) | 8 (9) |
| Preemtive transplantation (%) | 10(12) |
| Dialysis treatment prior transplantation (%) | 74( 88) |
| Dialysis vintage (months) | 32.26 ± 42.93 |
| hemodialysis (%) | 71 (95.94) |
| peritoneal dialysis (%) | 6 (8.1) |
| Brain death donor BDD (%) | 35 (42) |
| Living donor (%) | 49(58) |
| primary kidney disease | |
| Glomerulonephritis | 34 (40) |
| Hypertensive/vascular nephropathy | 7(8) |
| Diabetes Mellitus | 6(7) |
| Tubulointerstitial disease | 16(19) |
| ADPKD | 4(4) |
| Unknown/uncertain etiology | 17(20) |
| CV>30% | 14(17) |
| C0/D<1.05ng/mL/mg | 13(15) |
The results of the genetic analysis for the detection of SNP polymorphisms in the DNA sequences of CYP3A5 (6986A>G) and ABCB1 (3435C>T), along with the corresponding genotypes, are presented in Table 2. The majority of patients (86%) carried the CYP3A5 GG genotype (CYP3A5*3/*3), which is associated with a non-expresser phenotype. In contrast, 14% of the study population were carriers of at least one functional A allele, indicating active CYP3A5 enzyme expression. Among these, 13% were heterozygotes with genotype CYP3A5 AG (CYP3A5*3/*1) and 1% was homozygote with CYP3A5 AA genotype (CYP3A5*1/*1). Both hetero and homozygotes carriers of allele A are classified as expressers, reflecting an active metabolic phenotype. Regarding ABCB1 (3435 C>T), 26% of patients carried the CC (wild-type) genotype, associated with high P-gp expression, 46% CT genotype, corresponding to intermediate expression, while 27% were carriers of the TT genotype, linked with low P-gp expression.
Table 2.
Detected ABCB1 and CYP3A5* genotypes and functional phenotype.
| Gene | Nucleotide change (SNP) | Genotype | N(%) | Functional phenotype |
|---|---|---|---|---|
| CYP3A5* (rs776746) | 6986A>G | AA (CYP3A5*1/1*) | 1(1.2) | Expressers |
| AG (CYP3A5*1/*3) | 11(13.09) | Expressers | ||
| GG (CYP3A5*3/*3) | 72(86) | Non-expressers | ||
| ABCB1 (rs1045642) | 3435 C>T | CC | 22(26) | High P-gp expression |
| CT | 39(46) | Intermedium expression | ||
| TT | 23(27) | Low P-gp expression |
A graphical distribution display of detected genotypes for both examined CYP3A5 and ABCB1 genes (expressed in percentages) is presented in Picture 1. A marked predominance of the CYP3A5 GG genotype is evident (86%), indicative of absent or markedly reduced CYP3A5 enzymatic activity, compared with 14% of cohort carriers of at least one functional CYP3A5 AA/AG allele (Figure 1A). In figure 1B a relatively balanced distribution of ABCB1 genotypes is presented, whereas 27% of patients carried TT genotype.
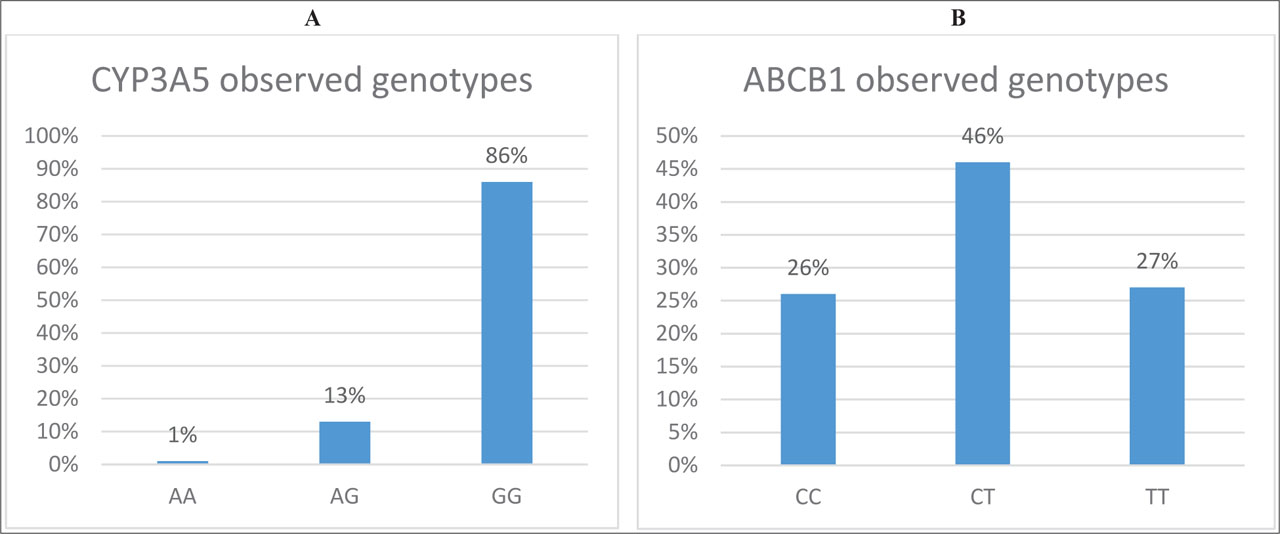
Figure 1.
Genotype distribution of the tested variants for both genes: А– CYP3A5*3 (rs 776746) 6986 A>G, frequencies of AA, AG and GG genotypes; B – ABCB1(rs 1045642) 3435C>T, frequencies of CC, CT and TT genotypes
The genotype distributions did not show deviation from the Hardy-Weinberg equilibrium (P>0.05), indicating a well-chosen representative pool of patients for the purpose of the study. (Figure 2-A and B)
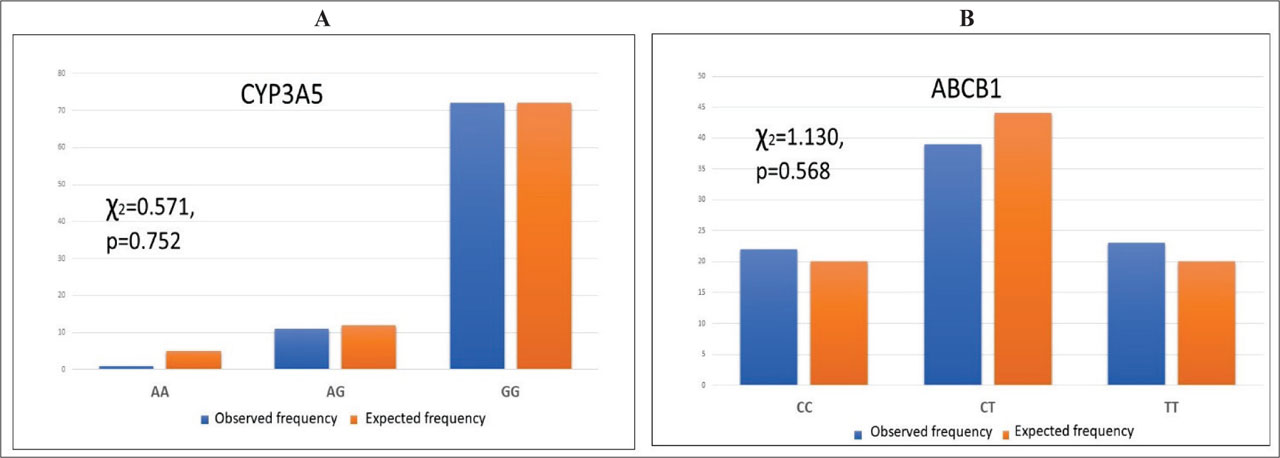
Figure 2.
Hardy-Weinberg equilibrium for genotype distributions А - CYP3A5 genotypes, B - ABCB1 genotypes
The comparative analysis for both CYP3A5* and ABCB1 examined variant genes regarding detected genotypes, age and gender (Table 3). No statistical significance was found in respect for age (47.19 vs 45.75, p=0.618; 46.23 vs 41.02, p=0.364), or gender (8(67) vs 51(70), p=0.744; 16(68) vs 43(70); p=0.567), respectively.
Table 3.
Comparative analysis of patients with each genotype for both genes regarding age and gender.
| N=84 | CYP3A5* | ABCB1 | ||||
|---|---|---|---|---|---|---|
| AA + AG (CYP3A5 *1/1*+*1/3*) | GG (CYP3A5 *3/3*) | p | TT+CT (ABCB1) | CC (ABCB1) | p | |
| N=72 Medium rank N0 (%) | N=12 Medium rank N0 (%) | N=61 Medium rank N0 (%) | N=23 Medium rank N0 (%) | |||
| Age (years) | 47.19 | 45.75 | 0.618 | 41.02 | 46.23 | 0.364 |
| Gender (male) | 8(67) | 51(70) | 0.744 | 43(70) | 16(68) | 0.567 |
When we analyzed the association between the observed genotypes for CYP3A5 and parameters for tacrolimus variability, patients with CYP3A5 AA an AG genotypes were more likely to present with C0/D<1.05ng/mL/mg. An assessment for the observed risk in these patients, performed with Mantel Haenszel test estimated twice higher risk for C0/D<1.05ng/mL/mg in patients’ carriers of A variant alleles (7(58%) vs (6(8%); OR=2.01; 95%CI (1.114–3.624) p=0.001). Although the percentage of patients with CV>30% was higher in those presented with AA/AG genotypes than those with GG, the difference did not reach statistical significance (3(25%) vs 11(15%), p=0.197). Regarding ABCB1 no significant relation was found between indicators of variability and observed genotypes. (Table 4)
Table 4.
Association between observed genotypes and tacrolimus variability.
| CYP3A5 | AA/AG | GG | p | ||
|---|---|---|---|---|---|
| N (%) | 12 (14%) | 72 (86%) | |||
| C0D <1.05ng/mL/mg | 7 (58%) | 6 (8%) | 0.001 | 2.01 | 1.114–3.624 |
| CV>30% | 3 (25%) | 11 (15%) | 0.197 | ||
| ABCB1 3435C>T | TT | CT+CC | |||
| N (%) | 23 (27%) | 61 (73%) | |||
| C0D <1.05 ng/mL/mg | 6 (27.3%) | 7 (11.5%) | 0.096 | ||
| C0/D>1.55 | 13 (59.1%) | 47 (77%) | 0.163 | ||
| CV>30% ng/ml/mg | 5 (22.7%) | 9 (14.8%) | 0.507 | ||
| ABCB1 | CC | CT+TT | |||
| N (%) | 22 (26%) | 62 (74%) | |||
| C0D <1.05 ng/mL/mg | 4 (18.2%) | 9 (14.8%) | 0.737 | ||
| C0/D>1.55ng/mL/mg | 17 (77.3%) | 43 (70.5%) | 0.593 | ||
| CV>30% | 3 (13.6%) | 11 (18%) | 0.751 | ||
| ABCB1 | CT | CC+TT | |||
| N (%) | 39 (46%) | 45 (54%) | |||
| C0D <1.05 ng/mL/mg | 3 (7.7%) | 10 (22.7%) | 0.075 | ||
| C0/D>1.55 ng/mL/mg | 30 (76.9%) | 30 (68.2%) | 0.464 | ||
| CV>30% | 6 (15.4%) | 8 (18.2%) | 0.483 |
In Table 5 are presented results of the comparative analysis between patients with CYP35A5 AA/AG and GG genotypes in respect of the tacrolimus blood concentration, the daily dose requirements for achieving therapeutic drug level and parameters for variability. In both groups patients reached the desired tacrolimus blood concentrations and in similar ranges (6.73±1.27 vs 6.166 ± 1.28, p=0.157), but the required daily doses of TAC for its achieving were remarkable higher in those with genotypes CYP3A5 AA/AG compared to those without (5.107± 2.21 vs 3.2066 ± 1.78; p=0.014). Also, the mean value of C0/D in patients with CYP3A5 AA/AG genotypes was noteworthy lower compared to others (1.505 ± 0.98 vs 2.627 ± 1.30, p=0.003), respectably, as shown on Figure 3.
Table 5.
Tacrolimus daily dosage and variability parameters for CYP3A5 AA and AG genotypes.
| CYP3A5 AA/AG | N=72 | N=12 | p |
|---|---|---|---|
| TAC (ng/mL) | 6.73±1.27 | 6.166 ± 1.28 | 0.157 |
| TAC SD | 1.526 ± 0.63 | 1.369 ± 0.59 | 0.502 |
| Dosage (mg) | 3.206 ± 1.78 | 5.107 ± 2.21 | 0.014 |
| Dosage SD | 0.338 ± 0.33 | 0.572 ± 0.438 | 0.096 |
| CV% TAC | 22.74 ± 8.38 | 23.00 ± 9.39 | 0.931 |
| C0/D (ng/mL/mg) | 2.627 ± 1.30 | 1.505 ± 0.98 | 0.003 |
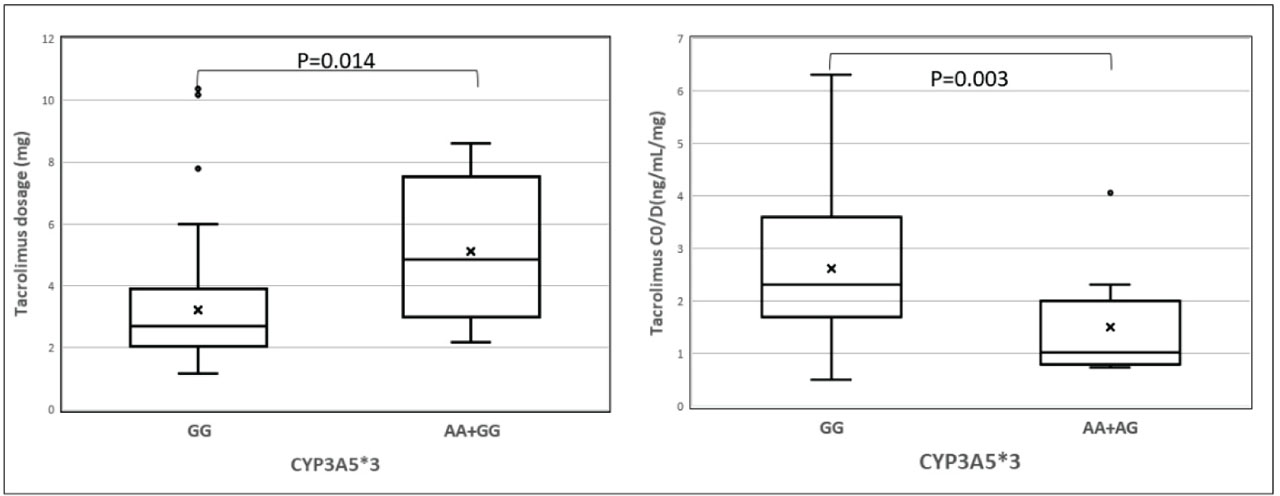
Figure 3
Illustrations of dose regimens for tacrolimus for CYP3A5 genotypes
A visual representation of significant difference for tacrolimus daily dose requirements between observed genotypes for CYP3A5 is exhibited in Figure 3.
The analysis for TAC blood concentration, daily dosing and variability for carriers of ABCB1 TT genotype linked with functional phenotype for low P-gp expression did not show statistical significance for neither parameter of interest related to any metabolic profile. (Table 6)
Table 6.
Tacrolimus daily dosage and variability parameters for ABCB1 TT genotype.
| ABCB1 TT | N=61 | N=23 | p |
|---|---|---|---|
| TAC (ng/mL) | 6.678±1.26 | 6.598 ± 1.35 | 0.803 |
| TAC SD | 1.509 ± 0.58 | 1.504 ± 0.71 | 0.976 |
| Dosage (mg) | 3.279 ± 1.74 | 3.904 ± 2.35 | 0.254 |
| Dosage SD | 0.402 ± 0.33 | 0.443 ± 0.402 | 0.654 |
| CV% TAC | 22.94 ± 8.55 | 22.41 ± 8.45 | 0.795 |
| C0/D (ng/mL/mg) | 2.49 ± 1.26 | 2.40 ± 1.46 | 0.788 |
DISCUSSION
Our study included 84 kidney transplant recipients, with a predominance of a mail patient (70%). This is consistent with the data from the latest European registry for patients with CKD requiring any kind of renal replacement therapy (ERA/EDTA 2022/published year 2024), which reports that 62% of patients with end-stage kidney disease and 59% of kidney transplant recipients are male [18]. The number of living-donor transplantations in our study population was higher than that of deceased-donor transplantation. Although this distribution differs from overall European data (deceased 66% vs 33% living), it is comparable with data for countries in our region, where living-donor transplantation remains predominant [18]. Despite ongoing improvements in healthcare and the increasing upper age limit for eligible transplant recipients, the mean age of our study population was approximately 37 years. This is in correlation with reports indicating that the highest proportion of transplantations is still performed in the middle-age patients [19]. Notably, the proportion of patients with glomerulonephritis as the primary kidney disease in our cohort was higher than that reported in regional studies, which may partly explain the younger age of our population. For the pharmacogenomic analysis, participants were tested for the distribution frequencies of CYP3A5 (rs776746) and ABCB1(rs1045642) genetic polymorphisms, which have been identified as key factors that influencing tacrolimus pharmacokinetics (5–9). The observed frequency of CYP3A5 expressers genotypes (AA/AG) was around 15%, consistent with data obtained from regional studies and studies conducted in healthy population in our country [20,21]. Similarly, the distribution of ABCB1genotypes (CC, TT, CT) was comparable to that reported in Caucasians populations globally, regionally and in local healthy cohorts [5,9,20,22]. The Hardy-Weinberg Equilibrium (HWE) for CYP3A5 and ABCB1 genotype distributions confirmed the genetic stability of the study population. Regarding interrelations between tacrolimus variability and detected genetic polymorphisms, a firm, statistically significant association was observed between a C0/D ratio <1.05ng/m/mg and carriers of CYP3A5 AA/AG genotypes, holding twofold higher risk of belonging to this group compared to non-expressers. This finding is in accordance with existing literature, which highlights the significant impact of CYP3A5 polymorphisms on tacrolimus pharmacokinetics and their potential implications for graft function and outcomes [2,4,23]. The tacrolimus concentration-to-dose (C0/D) ratio is widely used as an accessible pharmacokinetic marker reflecting inter-individual variability in drug clearance and enabling the identification of fast and slow metabolizers [2,24]. Patients with a C0/D ratio <1.05ng/ml/mg are considered fast metabolizers and typically require higher daily tacrolimus doses to achieve target blood concentration [6,23, 24]. In line with this, our study confirmed that carriers of CYP3A5 expressers genotypes with C0/D ratio <1.05ng/mL/mg required higher daily tacrolimus doses compared to non-expressers to reach therapeutic levels. When assessing the connection between CYP3A5 genotypes and intra-patient variability (IPV) expressed as CV>30%, a trend toward higher IPV in CYP3A5 expressers genotypes was noted, this did not reach statistical significance. This may be partly explained by the relatively small sample size, as well as the influence of additional factors such as drug interactions, dietary habits and adherence to therapy, which were not included in the analysis [25]. The most common studied ABCB1 C3435T (rs1045642) polymorphism, which may influence P-glycoprotein expression and by thereby affect tacrolimus absorption and tissues distribution, has not demonstrated consistent or strong proof of relevance for tacrolimus variability as CYP3A5 [8,9,26]. Although some studies have reported association between the ABCB1(3435) TT genotype and higher TAC C0/D ratios especially in the early post-transplant period [26], our results did not demonstrate a significant association between ABCB1 genotypes and TAC variability, dosing requirements, or blood concentration, consistent with findings from regional studies [8,20]. Nevertheless, the lack of an independent effect of ABCB1 does not exclude its role in tacrolimus pharmacokinetics. On the contrary, several studies suggest that the combined effect of CYP3A5 and ABCB1 polymorphisms (including 3435C>T) may be more relevant in explaining tacrolimus variability than the effect of ABCB1 alone [27,28].
A limitation of this study is the absence of a multivariate predictive analysis due to the relatively limited cohort size, which restricted our ability to fully control for potential confounding factors. Consequently, future studies with larger sample sizes should employ multivariate modeling to effectively adjust for confounders and establish more robust predictive frameworks.
CONCLUSION
This is the first study in Republic of North Macedonia that explored and verified the association between tacrolimus variability and genetic polymorphisms in kidney transplant recipients. It’s consistency with data from the region and international studies emphasizes its importance for both patients and clinicians involved in the transplantation process. This work contributes to ongoing efforts to tailor more personalized and patient-centered treatment strategies, with aim of minimizing adverse effects and improving clinical outcomes. Further studies are warranted to evaluate the impact of combined genetic polymorphisms on allograft function and long-term survival.