
Table 1.
The list of Chondrosarcoma cell lines
| Name of the cell lines | Diseases Subtype |
|---|---|
| CAL78 | Dedifferentiated Chondrosarcoma |
| CHSA0011 | Chondrosarcoma |
| CHSA0108 | Chondrosarcoma |
| CHSA8926 | Chondrosarcoma |
| CS1 | Chondrosarcoma |
| HEMCSS | Extraskeletal Myxoid Chondrosarcoma |
| OUMS27 | Chondrosarcoma |
| SW1353 | Chondrosarcoma |
Table 2.
CDS1 (CHEK2) expression public 23Q2 and drug sensitivity (PRISM repurposing primary screen)
| Compound | Pearson | Spearman | Slope | Intercept | p-value (linregress) |
|---|---|---|---|---|---|
| aminophylline | 0.127 | 0.131 | 3.78E-2 | −4.29E-1 | 2.69E-3 |
| levomepromazine | 0.125 | 0.124 | 2.94E-2 | −5.82E-2 | 3.26E-3 |
| chloropyramine | 0.117 | 0.127 | 7.68E-2 | −2.00E+0 | 6.23E-3 |
| chlorhexidine | 0.150 | 0.133 | 8.26E-2 | −8.63E-2 | 4.36E-4 |
| parbendazole | 0.123 | 0.124 | 1.21E-1 | −2.26E+0 | 3.81E-3 |
| bisacodyl | −0.217 | −0.190 | −7.49E-2 | 3.66E-1 | 2.76E-7 |
| anisomycin | 0.128 | 0.126 | 1.11E-1 | −3.16E+0 | 2.71E-3 |
| mepacrine | −0.141 | −0.131 | −4.70E-2 | 4.50E-1 | 1.02E-3 |
| trifluridine | 0.140 | 0.137 | 1.10E-1 | −1.21E+0 | 1.31E-3 |
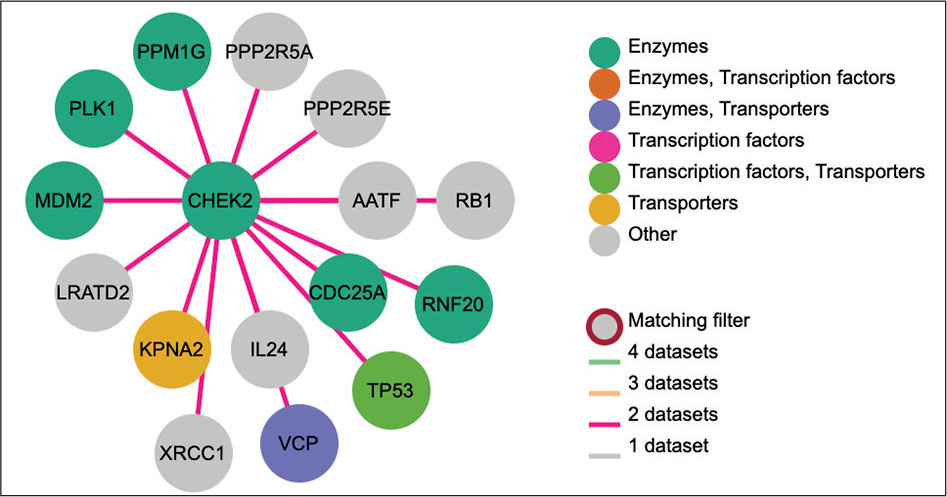
Figure 1.
Protein interactions of CDS1 (CHEK2)
The figure illustrates protein interactions of CDS1 (CHEK2).
The first-level consensus interactions for the nuclear protein CDS1 are colored according to subcellular location (left).
Yellow circles show genes related to transporters and green circles show enzyme interactions of CDS1.
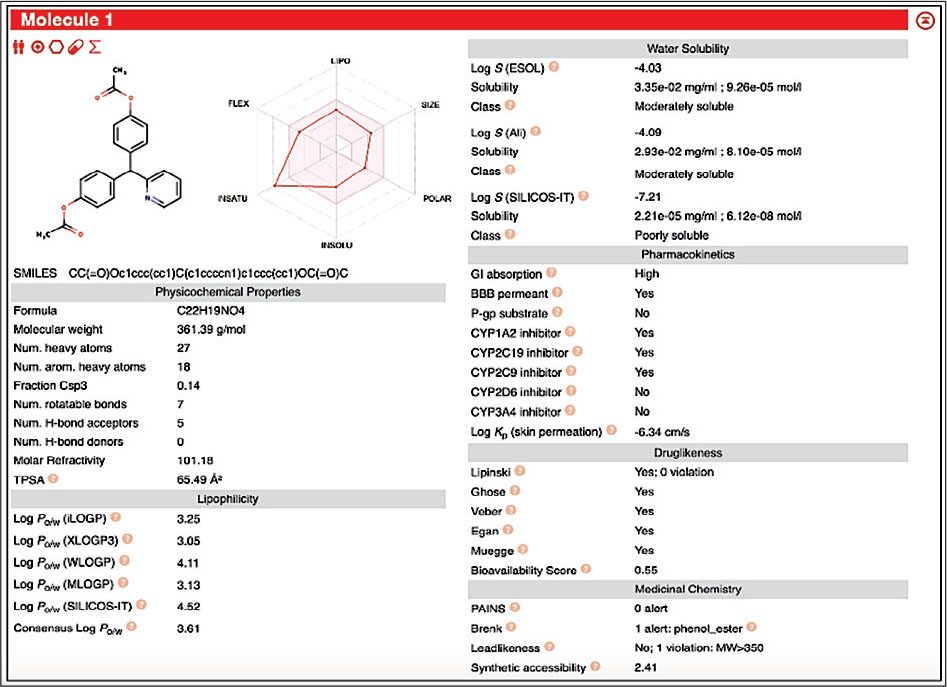
Figure 2.
The bioavailability radars for Bisacodyl produced by the SwissADME web application. These radars underscore its physicochemical characteristics, supporting its potential for high oral bioavailability.
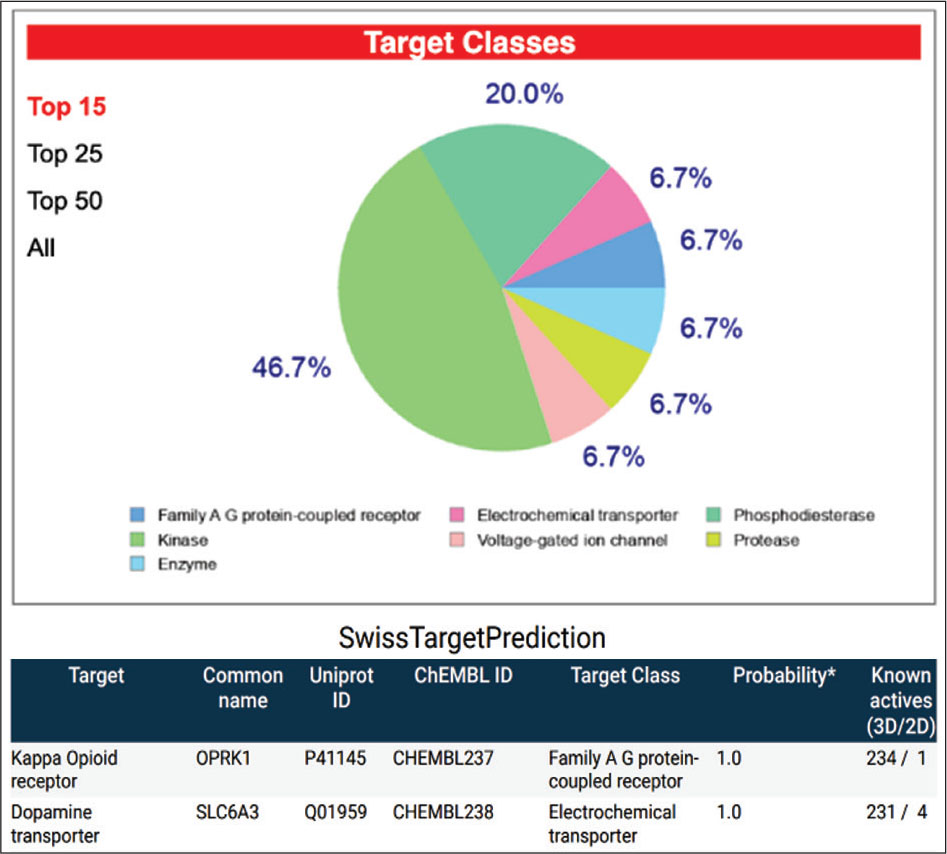
Figure 3.
SwissTargetPrediction predicts the protein target for Bisacodyl. The figure shows the results of the target prediction method, highlighting the proteins with the highest probability ratings for bisacodyl.