
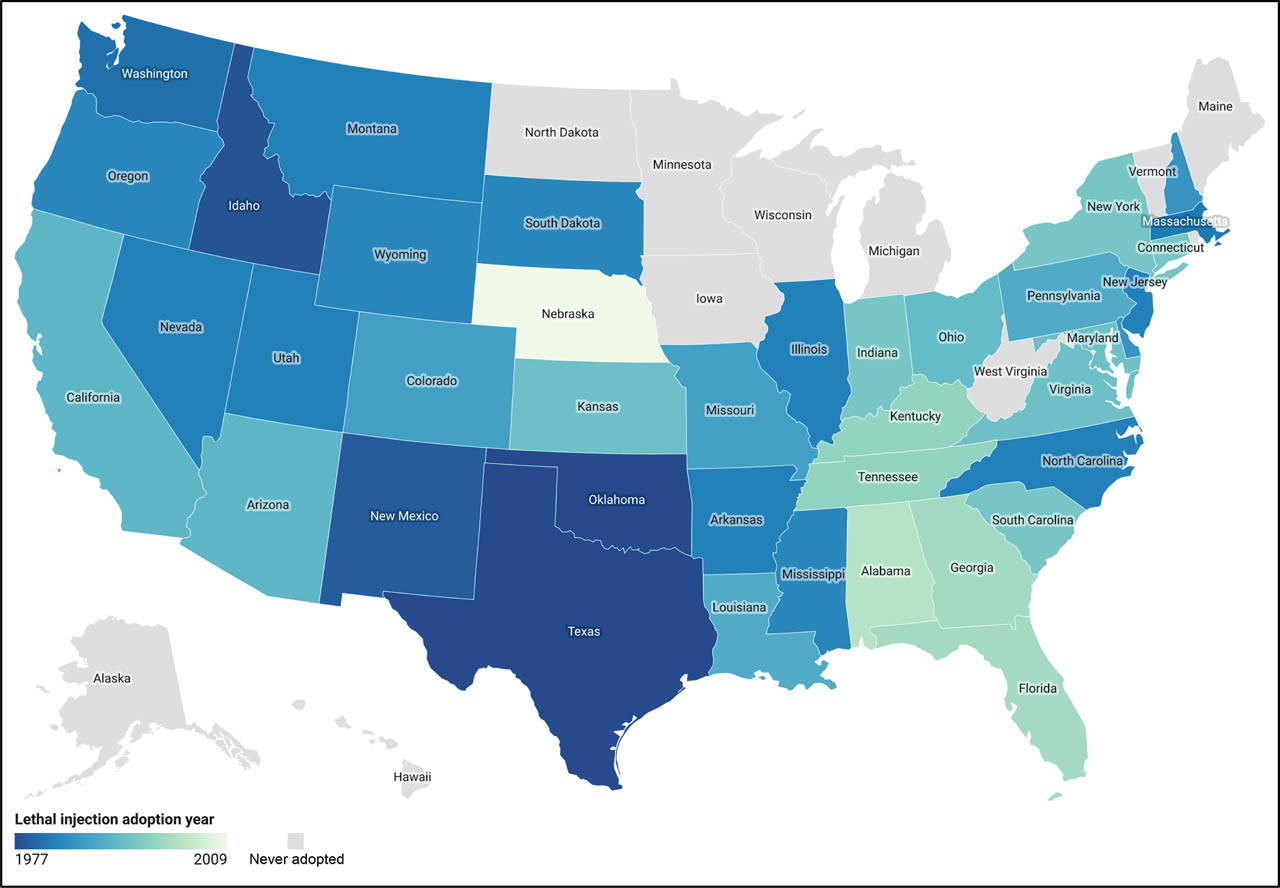
Figure 1
Lethal Injection Adoption by State.
Table 1
Drug protocols used between 2010 and 2013.
| One-drug | Three-drug | |
|---|---|---|
| Sodium thiopental | Ohio, Washington | Texas, Louisiana, Oklahoma, Florida, Mississippi, Virginia, Alabama, Georgia, Arizona |
| Pentobarbital | Ohio, Arizona, Idaho, Texas, South Dakota, Georgia, Missouri | Oklahoma, Texas, South Carolina, Mississippi, Alabama, Arizona, Georgia, Delaware, Virginia, Florida, Idaho |
[i] Drug protocols used in executions from January 2010 through September 2013, by state. In September 2013, states began to adopt even newer drug protocols that eschewed barbiturates, the class of drugs that contains both sodium thiopental and pentobarbital. States that held executions with multiple protocols are listed twice.
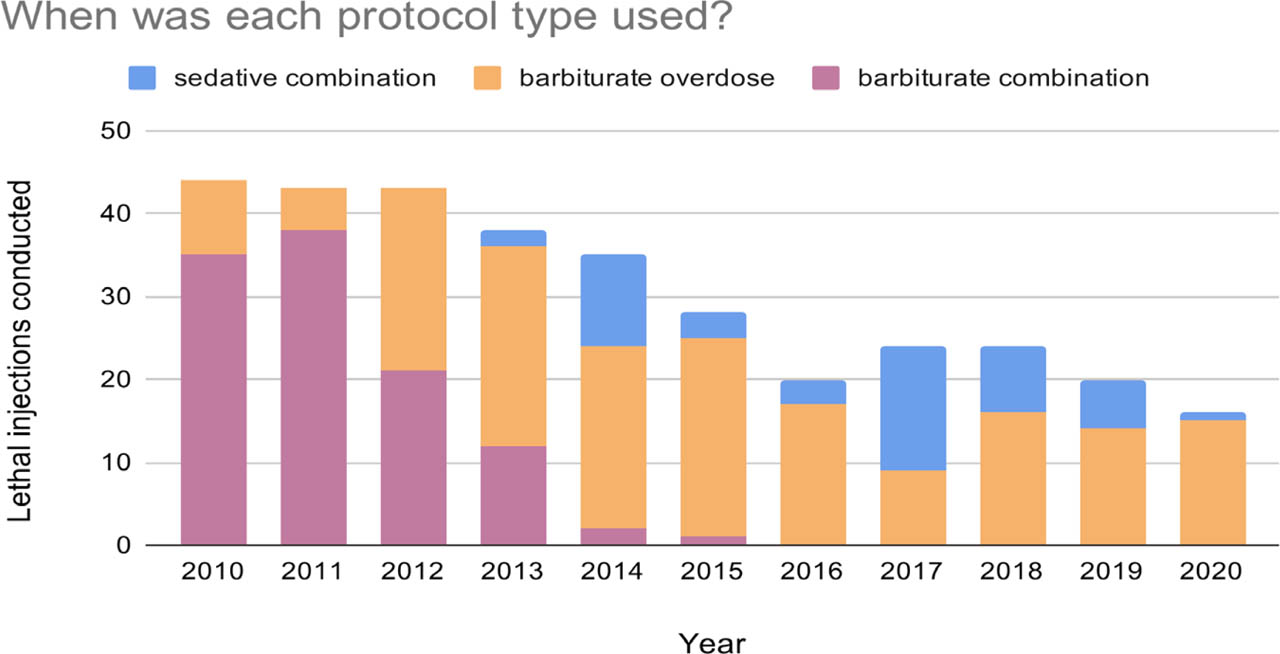
Figure 2
Protocol type by year of use.
Table 2
Classification of lethal injection drug protocols.
| Classification | Characteristics | Examples |
|---|---|---|
| Barbiturate combination | Sodium thiopental or pentobarbital in combination with a paralytic and a heart-stopper | Sodium thiopental, pancuronium bromide, and potassium chloride (traditional three-drug protocol) Pentobarbital, rocuronium bromide, and potassium chloride |
| Barbiturate overdose | Sodium thiopental or pentobarbital on their own | Sodium thiopental alone Pentobarbital alone |
| Sedative combination | Midazolam, etomidate, or diazepam in combination with other drugs | Midazolam and hydromorphone Etomidate, vecuronium bromide, and potassium acetate |
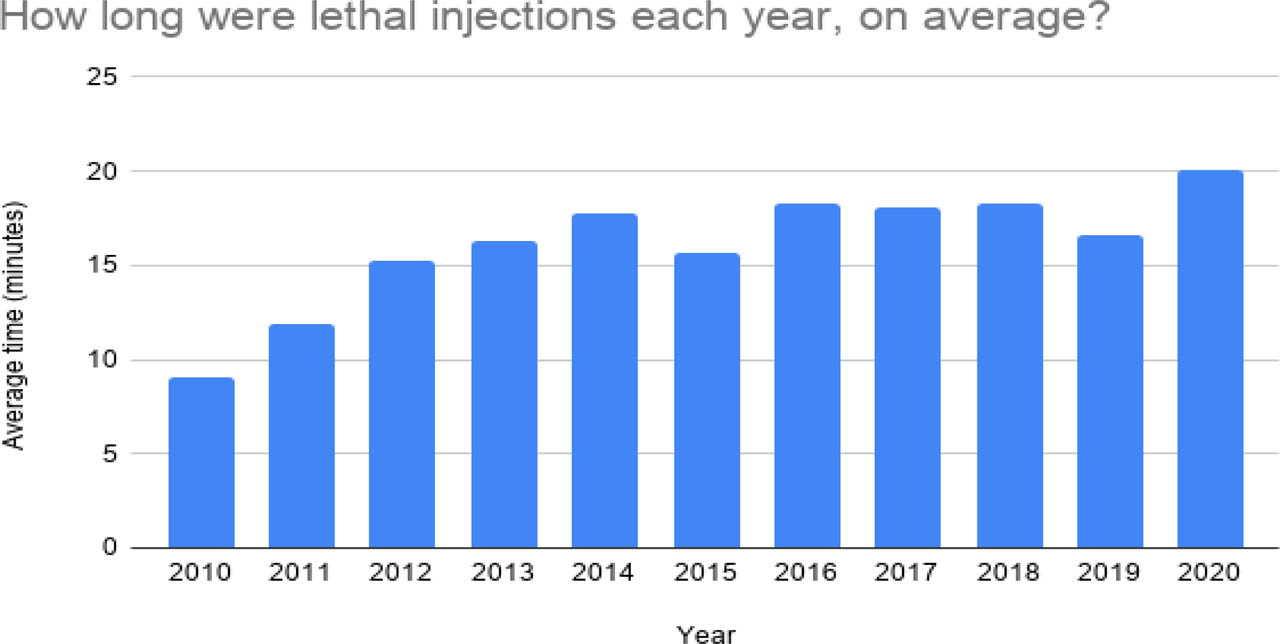
Figure 3
Average duration of lethal injections by year.
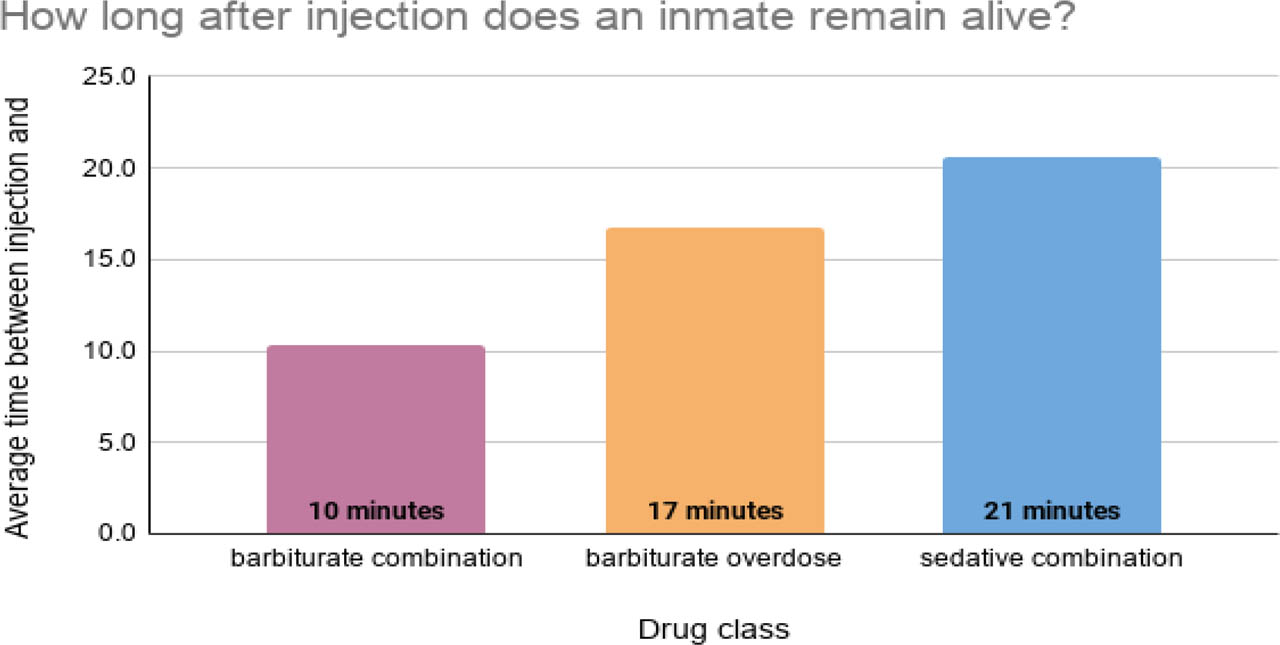
Figure 4
How long after injection does an inmate remain alive?
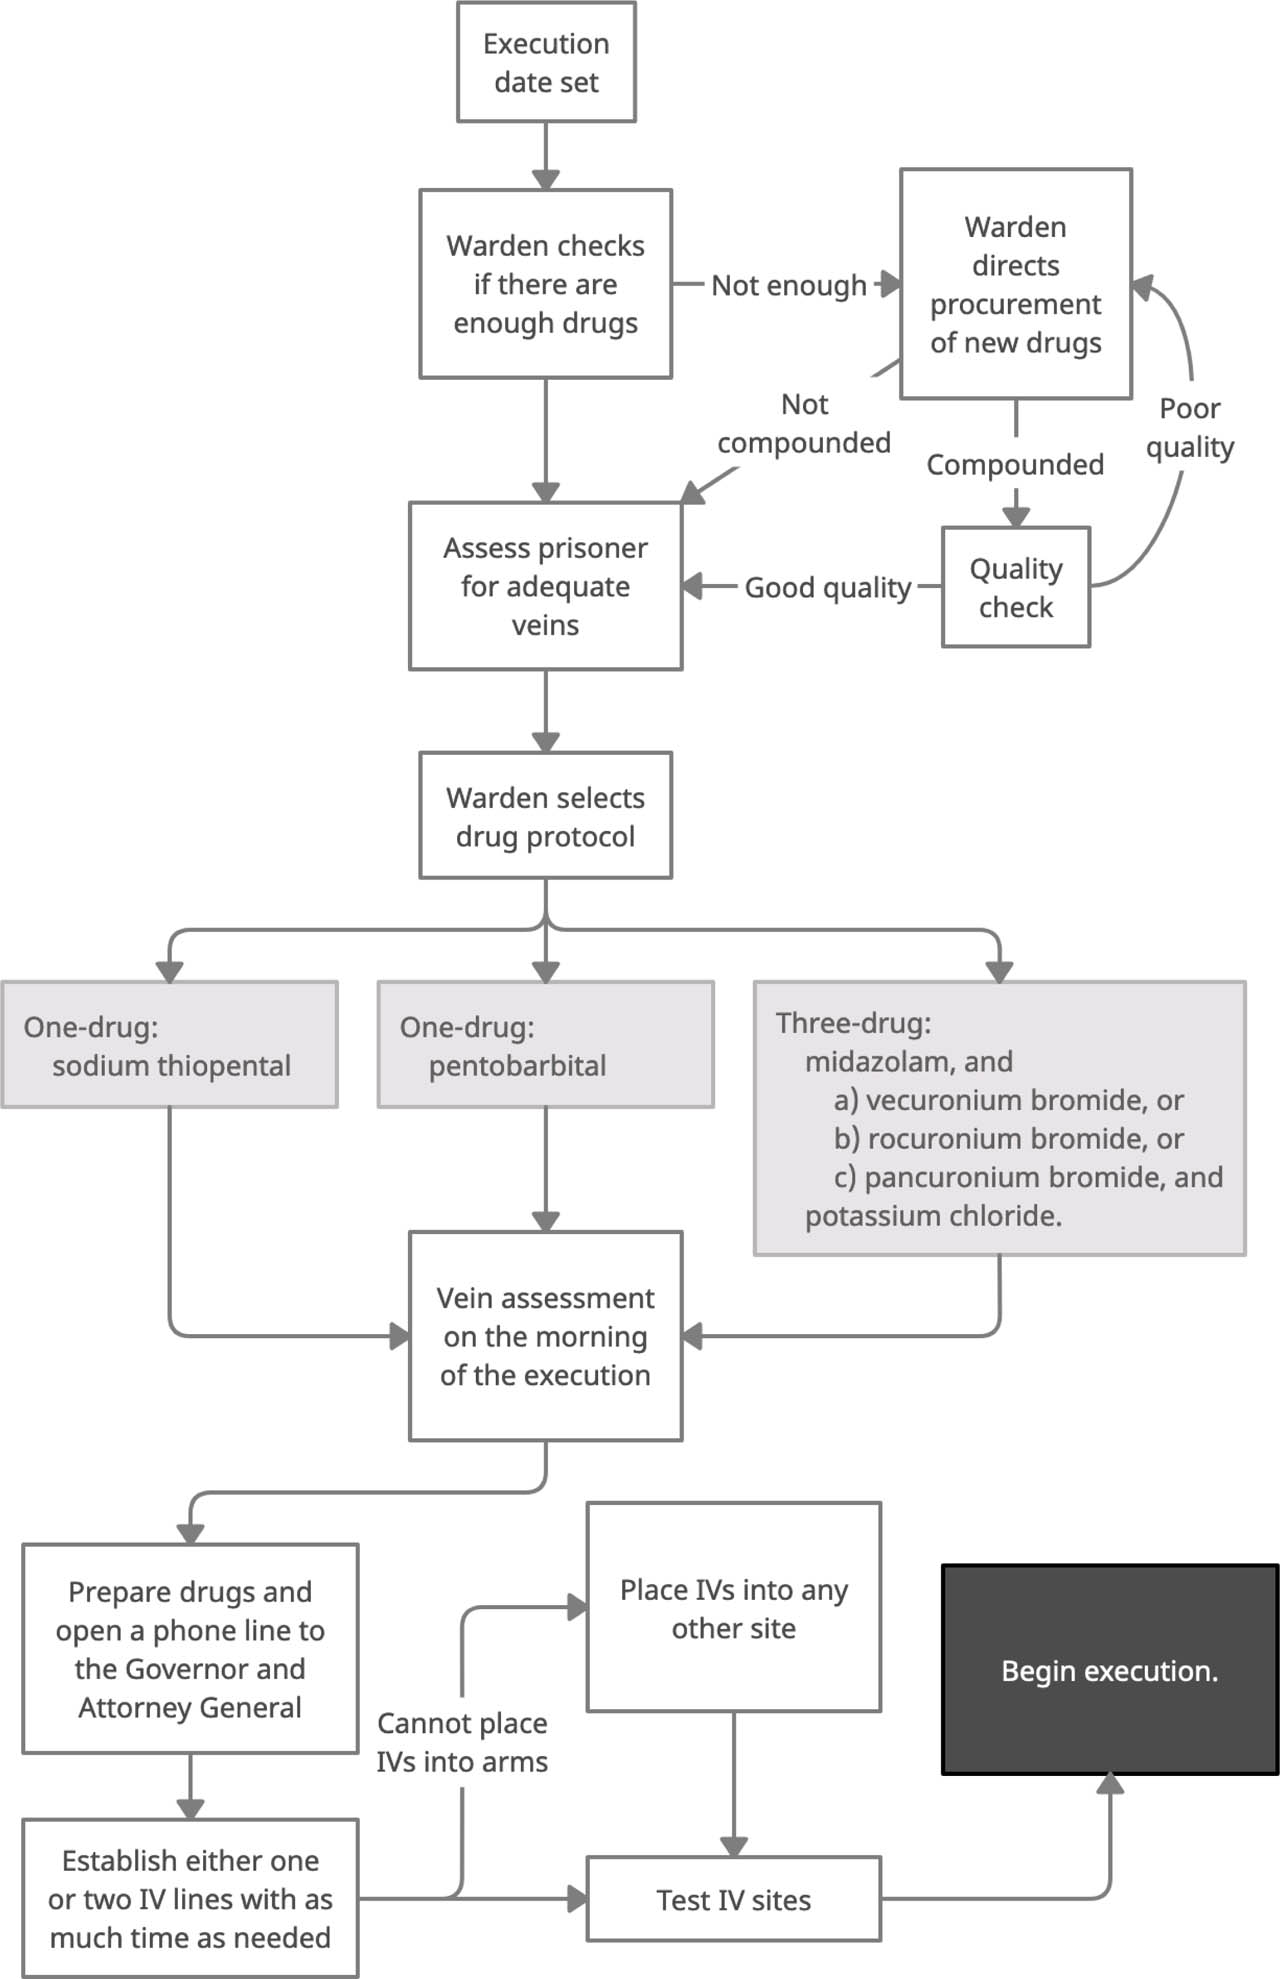
Figure 5
Branching in Ohio's lethal injection procedure.