
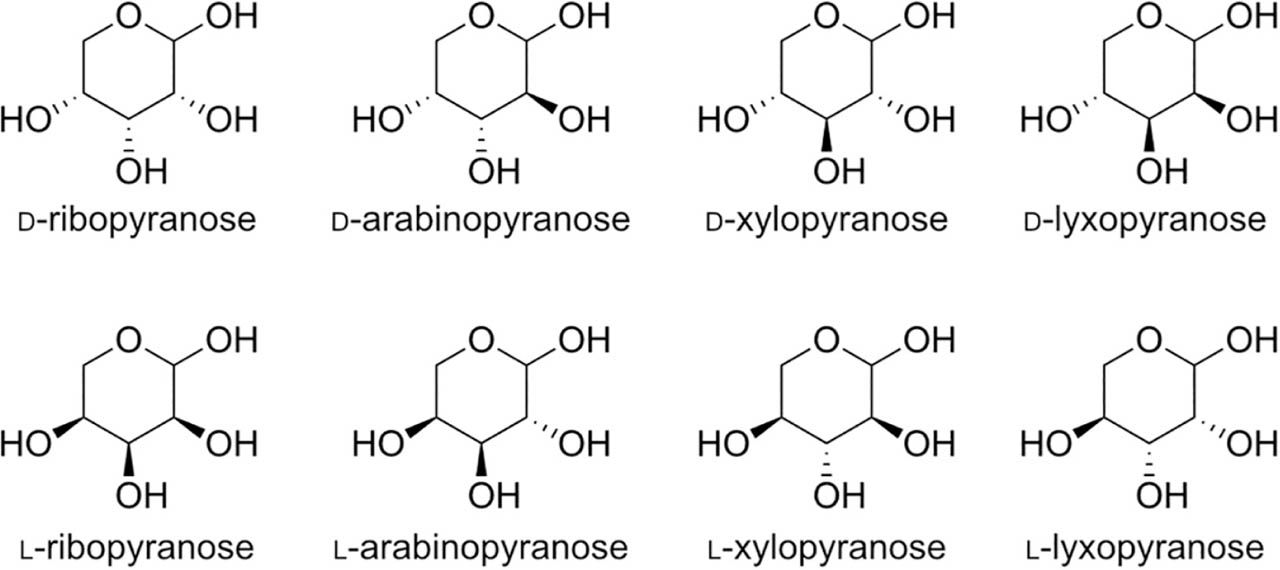
Figure 1.
Aldopentose stereoisomers.
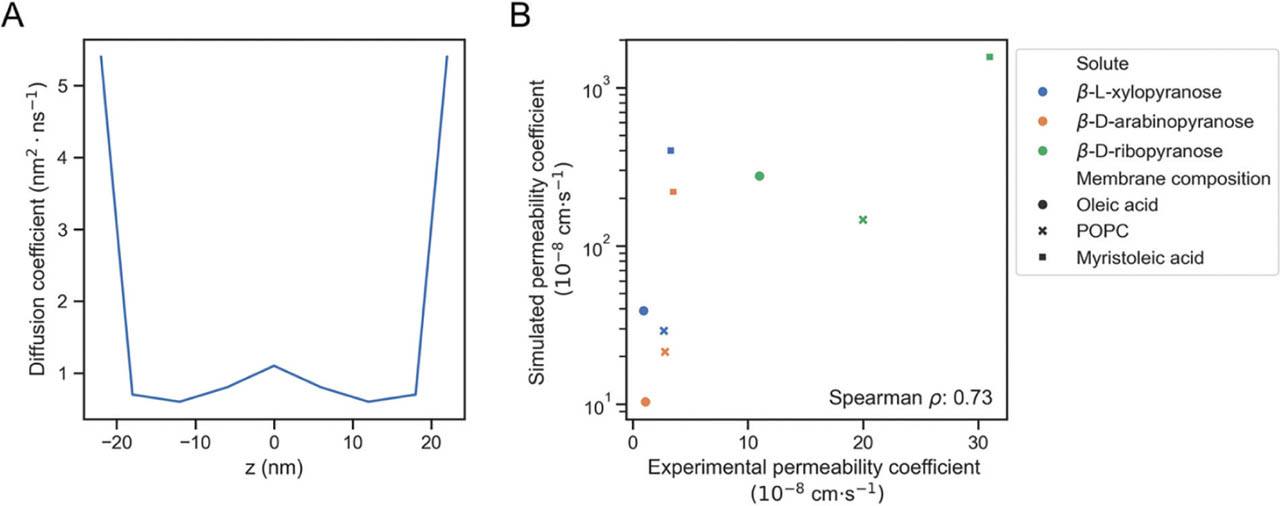
Figure 2.
Simulated permeability coefficients show a strong rank correlation to published permeability coefficients. (34) (A) Ribose diffusion coefficient profile used to calculate permeability coefficients for all solutes and membrane compositions. (35) (B) Correlation of experimental and simulated permeability coefficients, with Spearman ρ rank correlation value shown at the bottom right. Solutes are shown by color (blue, β-l-xylopyranose; orange, β-d-arabinopyranose; green, β-d-ribopyranose). Membrane composition shown by shape (circles, oleic acid; crosses, POPC; squares, myristoleic acid).
Table 1.
Simulated solute permeability coefficients for ribose and selected stereoisomers across fatty acid and phospholipid membranes.
| Oleic acid | Myristoleic acid | Lauric acid | Short chain (equimolar) | Short chain (excess lauric) | POPC | |
|---|---|---|---|---|---|---|
| β-d-ribopyranose | 276.5 | 1566 | 13.2 | 349.3 | 267.3 | 146.5 |
| β-d-arabinopyranose | 10.3 | 219.8 | 2.4 | 33.2 | 58.8 | 21.4 |
| β-l-xylopyranose | 39.0 | 400.4 | 14.2 | 172.1 | 99.3 | 29.1 |
| β-l-ribopyranose | 172.7 | 1552 | 40.9 | 1001 | 498.7 | n.d. |
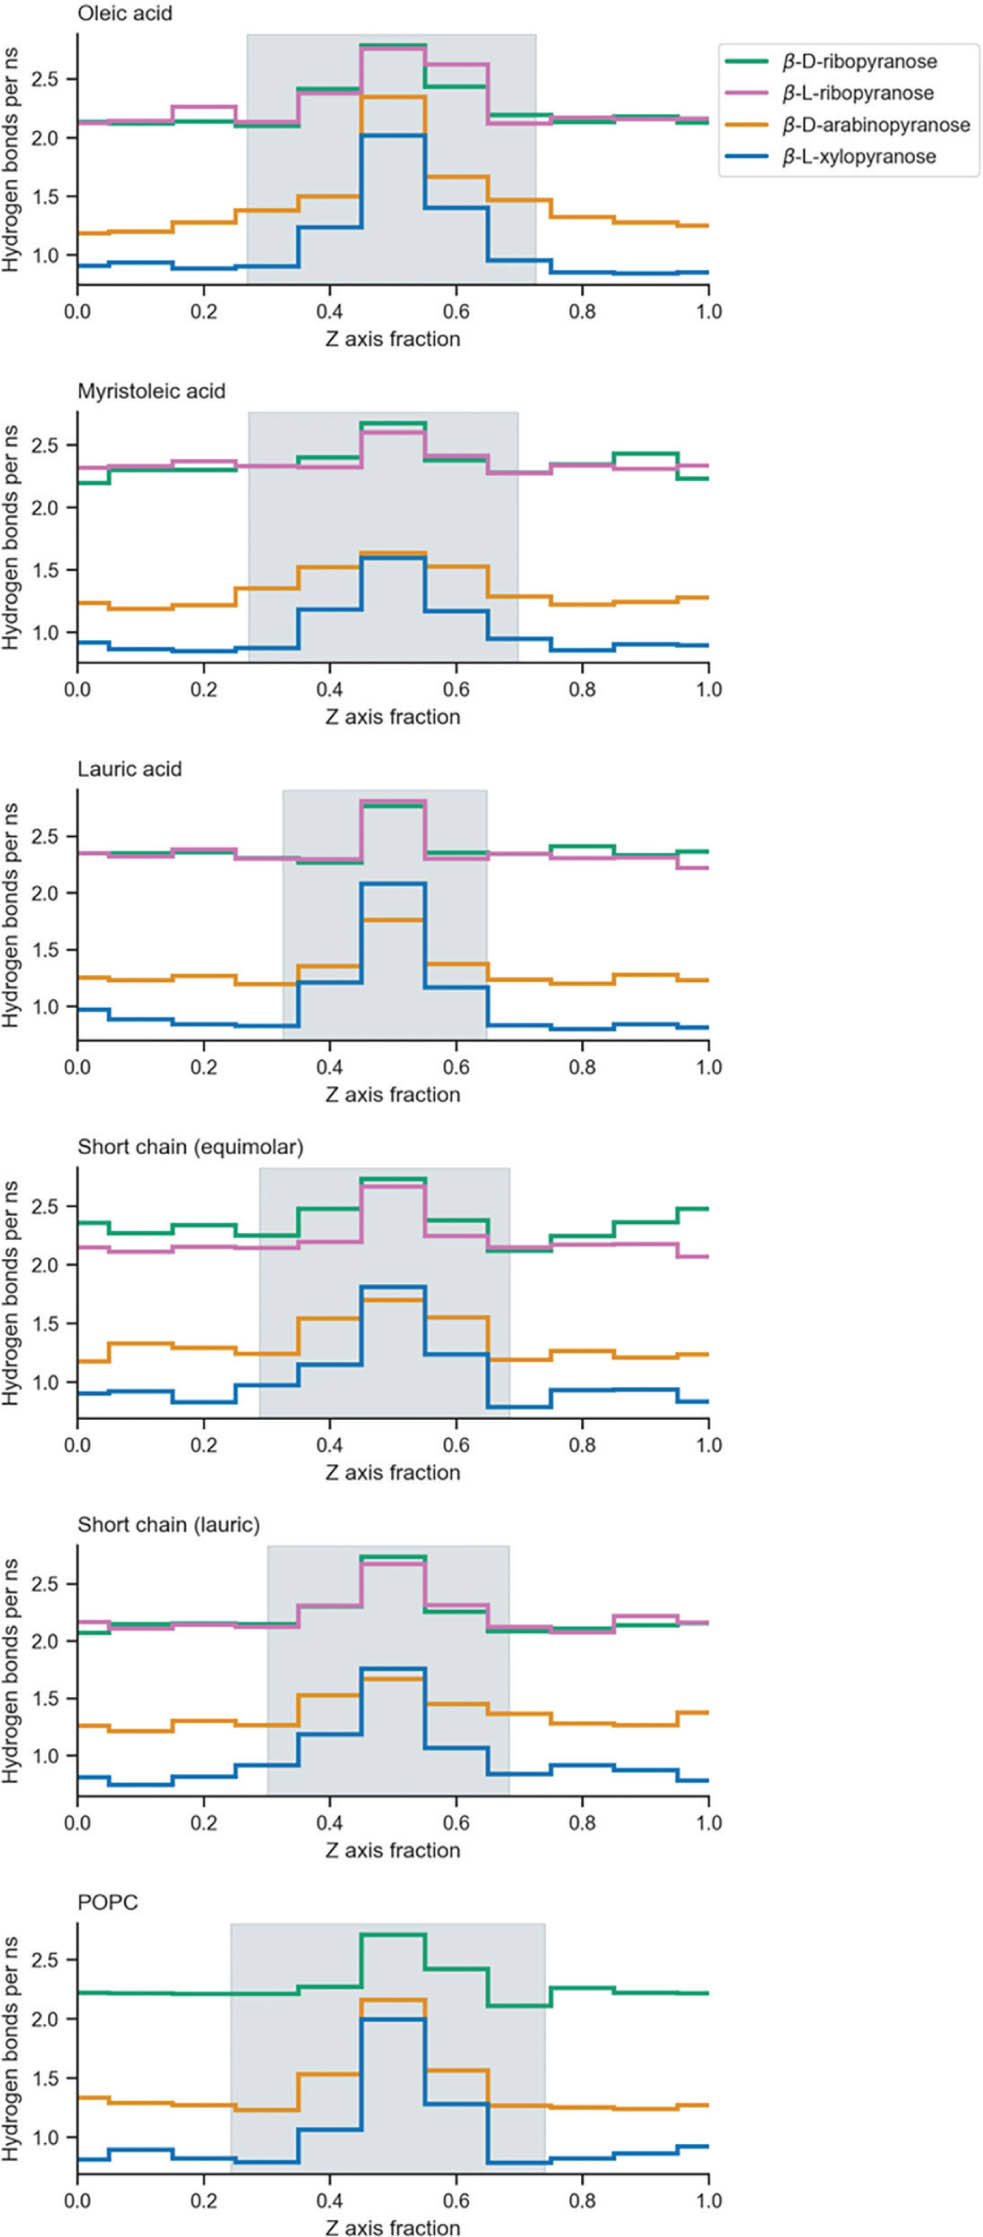
Figure 3.
Intramolecular hydrogen bonds formed per ns in different regions of the simulated system. The horizontal axis corresponds to the z-axis, that is, the axis along which solute permeation was sampled. The region of the permeation axis occupied by each bilayer is indicated by a grey rectangle. Bulk water is located at z-axis fractions of 0.0 and 1.0, and the bilayer core is located at a z-axis fraction of 0.5. Histograms are coloured by solute according to the legend.