
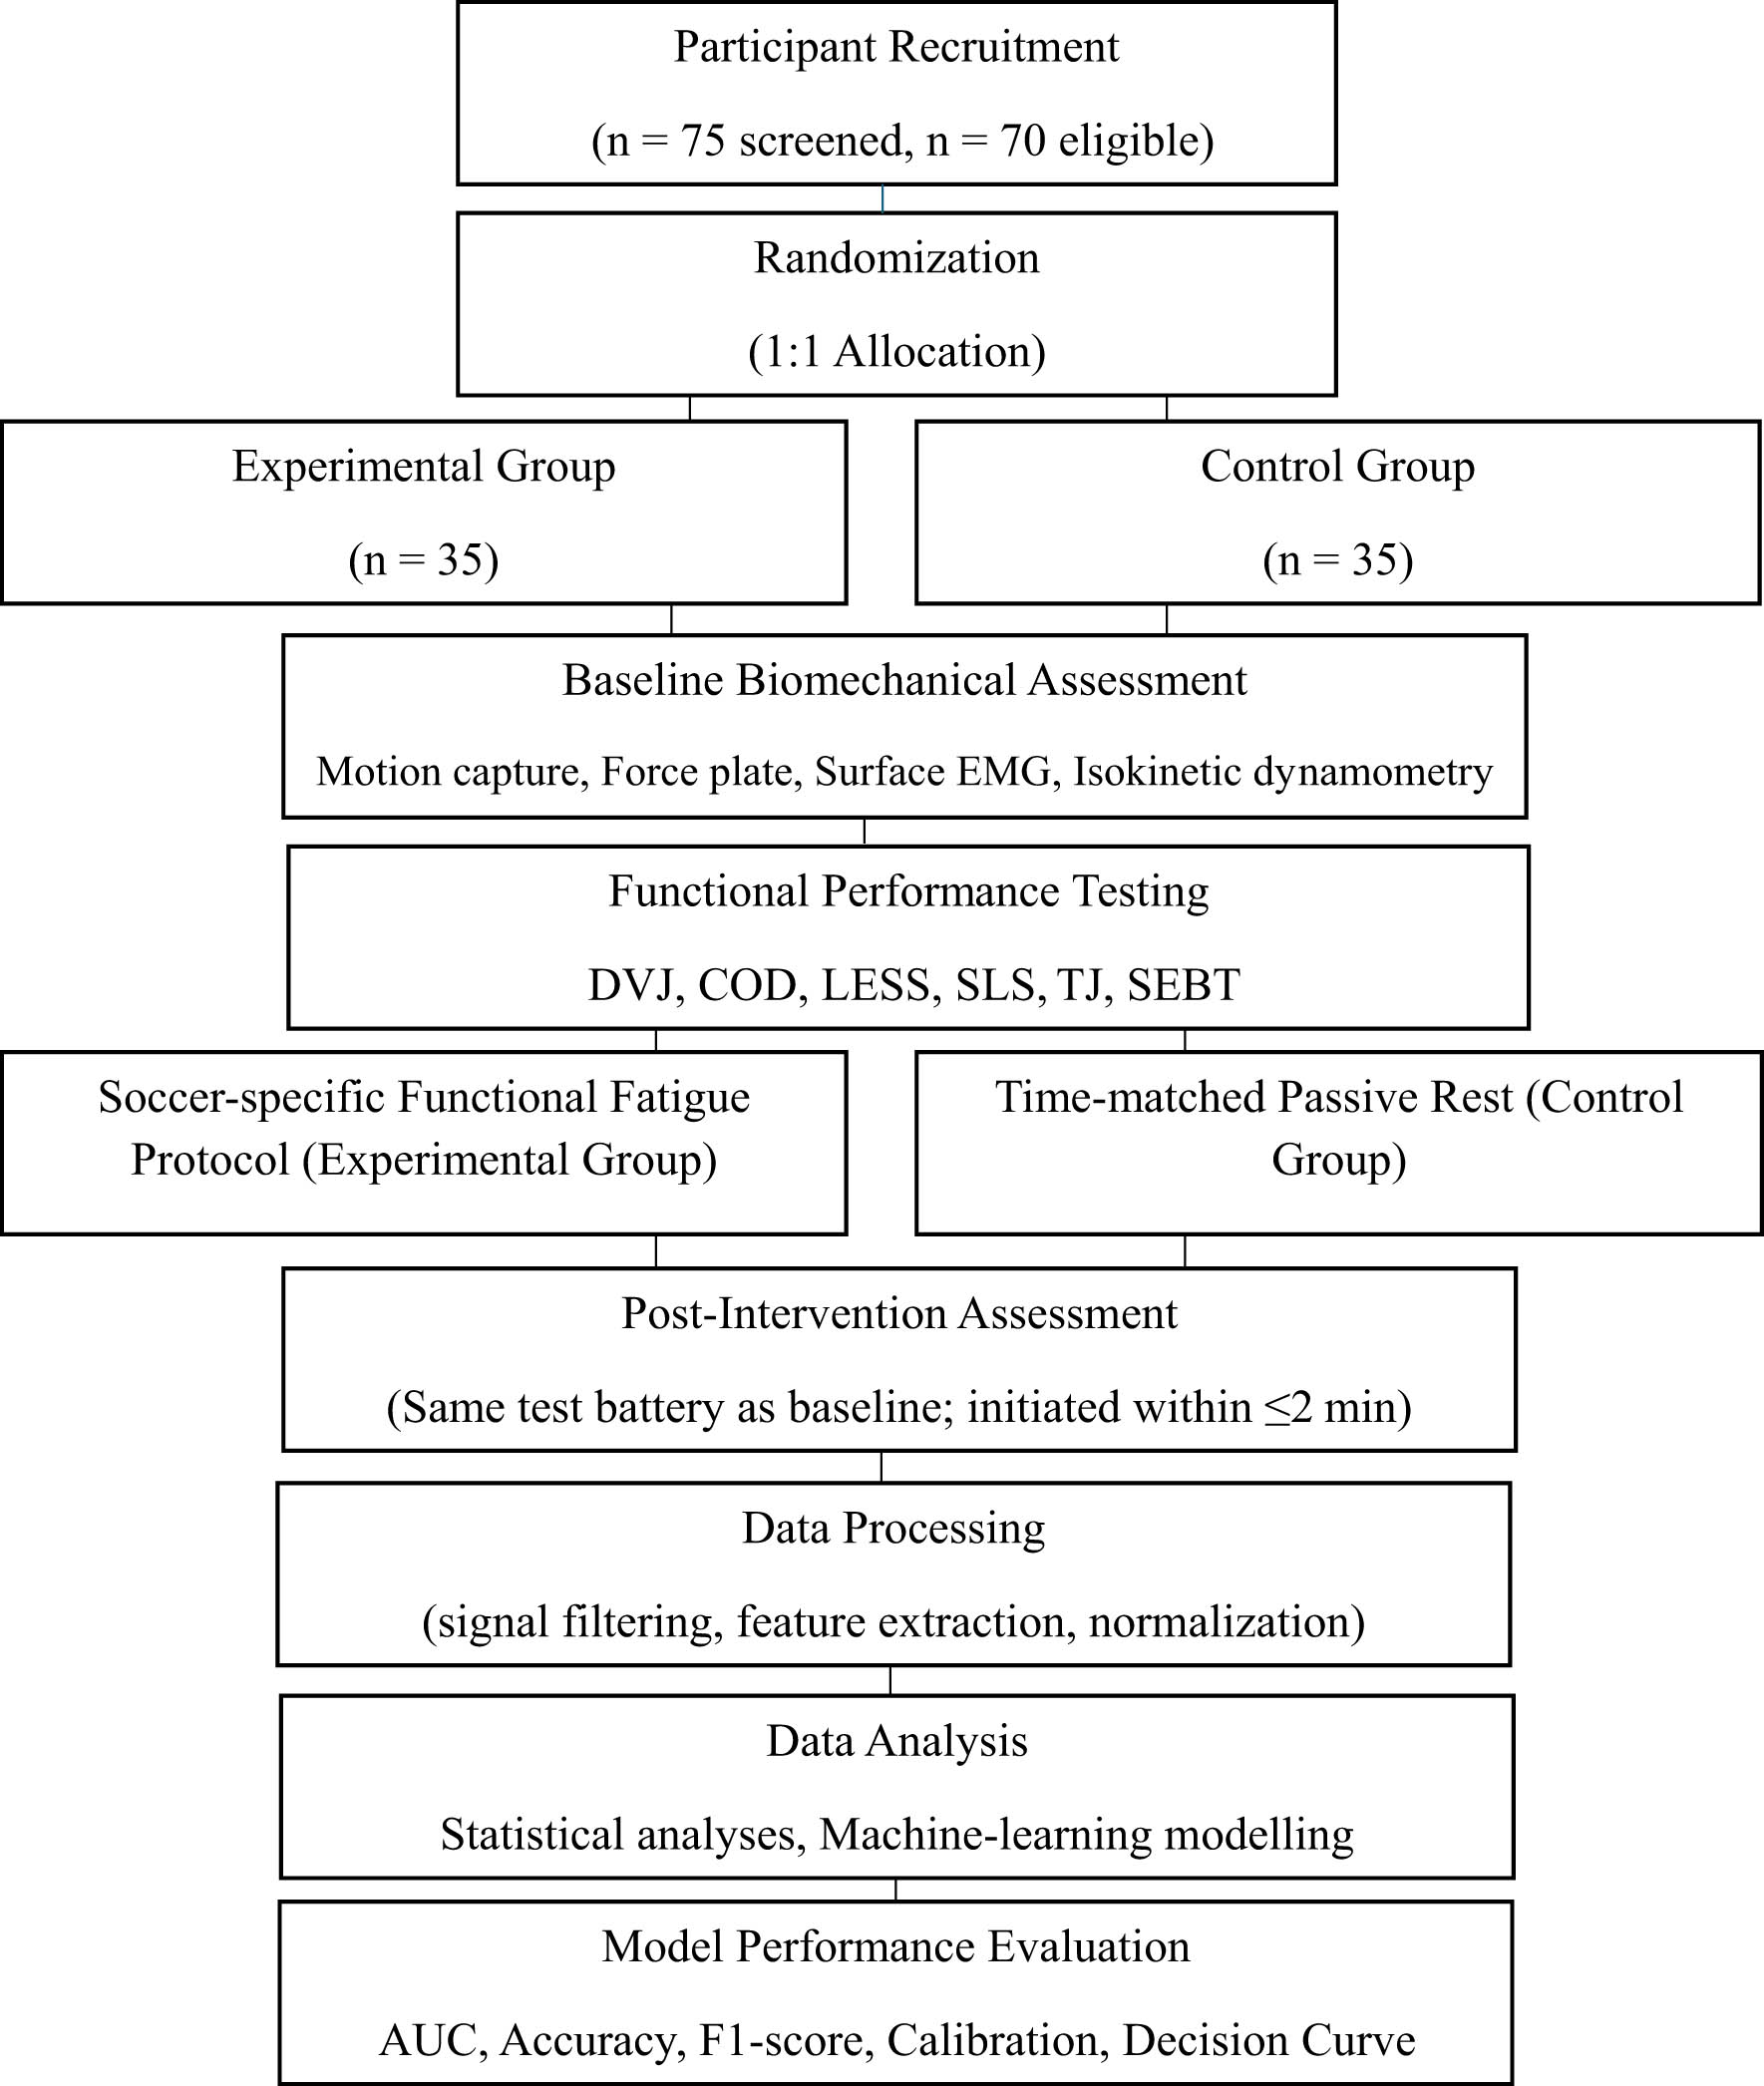
Figure 1
Overview of the study design and experimental workflow. DVJ, Drop Vertical Jump; COD, Change of Direction; LESS, Landing Error Scoring System; SLS, Single-Leg Squat; TJ, Tuck Jump; SEBT, Star Excursion Balance Test; EMG, electromyography; and AUC, area under the receiver operating characteristic curve
Source: Authors’ contribution
Table 1
Participant characteristics (n = 70)
| Variable | Control (mean ± SD) | Experimental (mean ± SD) | p-value |
| Age (years) | 25.1 ± 3.5 | 25.7 ± 3.0 | 0.34 |
| Body mass (kg) | 78.4 ± 6.8 | 77.9 ± 7.2 | 0.65 |
| Height (cm) | 181.6 ± 5.9 | 182.1 ± 6.1 | 0.52 |
| Playing experience (years) | 8.2 ± 2.1 | 8.4 ± 2.3 | 0.57 |
Note: Values are mean ± SD. Independent t-tests confirmed no baseline differences between groups (all p > 0.05).
Source: Authors’ contribution
Table 2
Multiple regression predicting post-fatigue knee valgus (°)
| Predictor | β ± SE | 95% CI | p |
| Peak vGRF (BW) | 0.48 ± 0.11 | 0.26–0.70 | <0.001 |
| Hamstring onset latency (ms) | 0.42 ± 0.10 | 0.22–0.62 | <0.001 |
| H:Q ratio | −0.31 ± 0.12 | −0.55 to −0.07 | 0.014 |
| Pelvic drop (°) | 0.25 ± 0.11 | 0.04–0.46 | 0.031 |
| CCI (%) | 0.24 ± 0.11 | 0.03–0.45 | 0.022 |
Values are standardised regression coefficients (β ± SE) with 95% confidence intervals (CI). H:Q, hamstring-to-quadriceps ratio; CCI, co-contraction index.
Source: Authors’ contribution
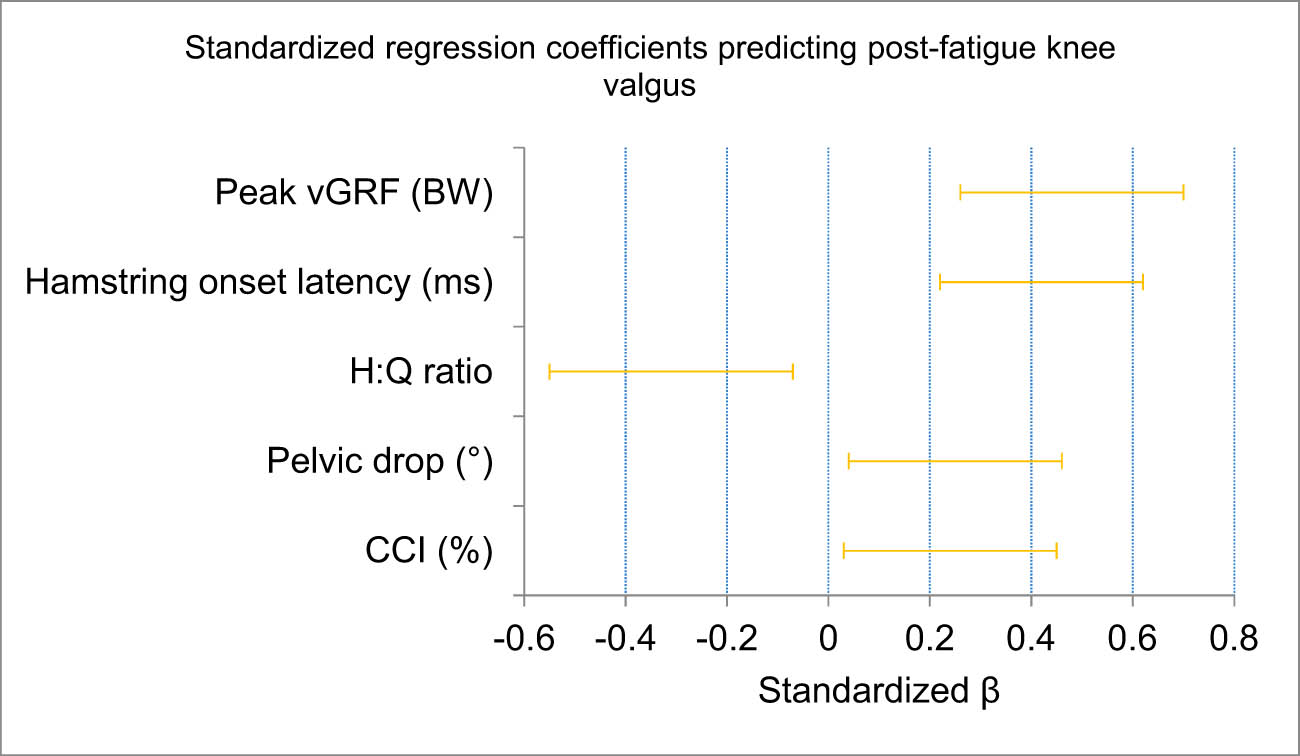
Figure 2
Forest plot of standardised regression coefficients (β) predicting post-fatigue knee valgus. Standardised regression coefficients (β) with 95% confidence intervals for the five prespecified predictors: peak vGRF, hamstring onset latency, pelvic drop, co-contraction index, and H:Q ratio. Peak vGRF and hamstring latency showed the strongest positive associations, while H:Q ratio exerted a protective effect
Source: Authors’ contribution
Table 3
Machine-learning model performance
| Model | Accuracy | Sensitivity | Specificity | Precision | Recall | F1 | AUC |
| Logistic regression | 0.86 | 0.84 | 0.87 | 0.83 | 0.84 | 0.84 | 0.90 |
| Random forest | 0.89 | 0.88 | 0.90 | 0.87 | 0.88 | 0.88 | 0.93 |
| Ensemble (voting) | 0.91 | 0.90 | 0.92 | 0.89 | 0.90 | 0.90 | 0.95 |
Reported metrics include accuracy, sensitivity, specificity, precision, recall, F1-score, and area under the receiver operating characteristic curve (AUC). Models were trained using fivefold cross-validation with approximately 80% training and 20% validation per fold.
Source: Authors’ contribution
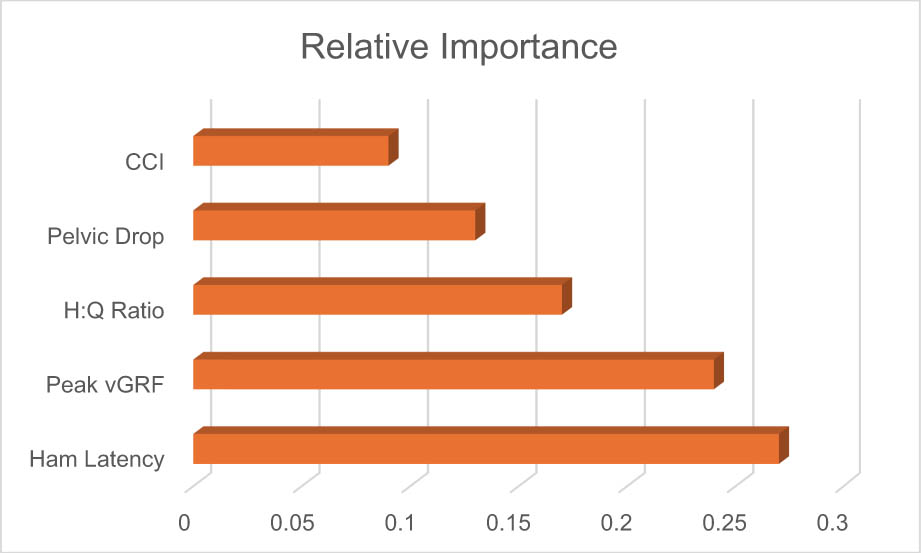
Figure 3
Feature-importance ranking for the ensemble classifier. Relative contribution of the predictors used in the ensemble model. Hamstring onset latency and peak vertical ground-reaction force (vGRF) were the strongest determinants of ACL-related neuromechanical classification, followed by H:Q ratio, pelvic drop, and co-contraction index
Source: Authors’ contribution
Table 4
Multimodal functional test classification performance summary
| Task | Accuracy | F1 | AUC | Ranking |
| Change of Direction (COD) | 0.90 | 0.90 | 0.95 | 1 |
| Drop Vertical Jump (DVJ) | 0.89 | 0.88 | 0.94 | 2 |
| Single-Leg Squat (SLS) | 0.88 | 0.87 | 0.92 | 3 |
| Landing Error Scoring System (LESS) | 0.87 | 0.86 | 0.91 | 4 |
| Tuck Jump (TJ) | 0.86 | 0.85 | 0.90 | 5 |
| Star Excursion Balance Test (SEBT) | 0.84 | 0.84 | 0.88 | 6 |
Accuracy, F1-score, and AUC values represent classification performance derived from task-specific feature sets.
Source: Authors’ contribution
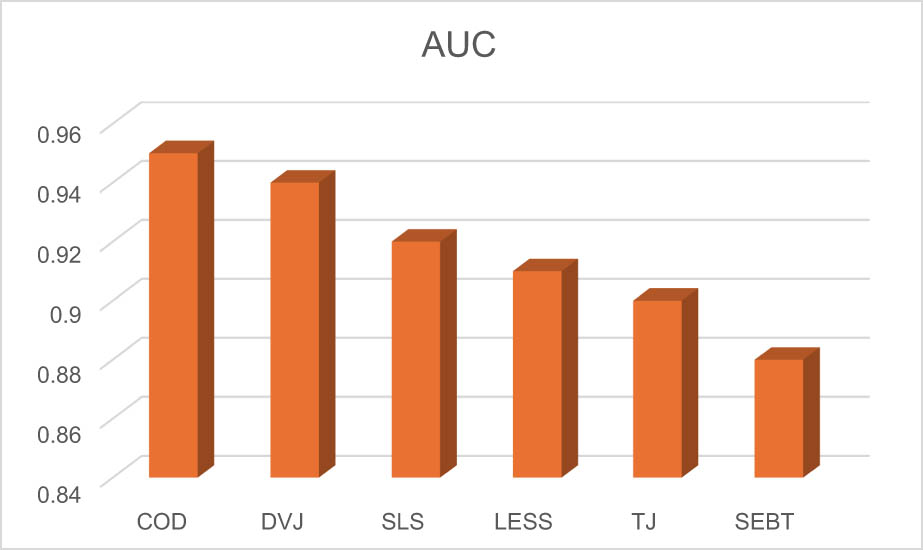
Figure 4
Functional test discriminative performance (AUC values). Area under the curve (AUC) values for the six individual functional tests. COD and DVJ demonstrated the strongest single-task discriminative performance (AUC = 0.95 and 0.94, respectively), followed by SLS, LESS, TJ, and SEBT
Source: Authors’ contribution
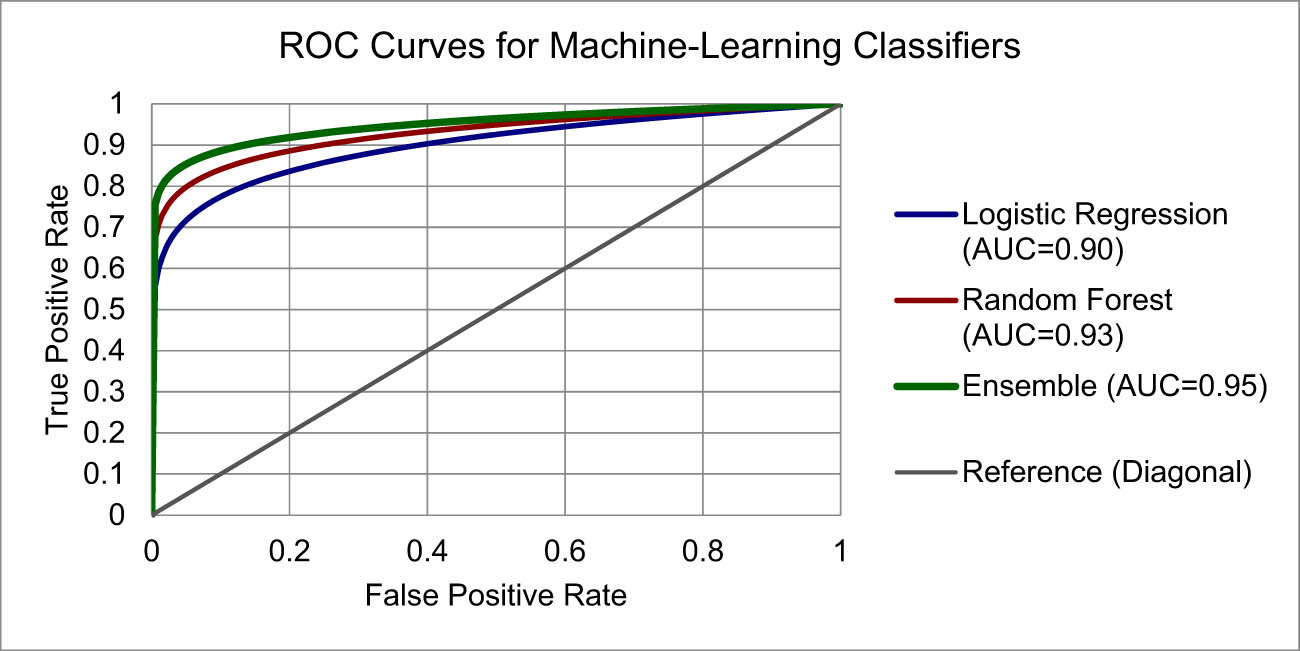
Figure 5
Receiver operating characteristic (ROC) curves for machine-learning classifiers. The ensemble voting classifier (AUC = 0.95) outperformed both the random forest (AUC = 0.93) and the logistic regression (AUC = 0.90) models. The diagonal line denotes the reference classifier
Source: Authors’ contribution