
1. Introduction
Anterior cruciate ligament (ACL) injury remains a major threat to performance, availability, and reinjury risk in soccer despite extensive prevention efforts (Della Villa et al., 2020; Ekstrand et al., 2020; Hägglund et al., 2013). Most ACL injuries arise from non-contact, game-speed movements that overload neuromechanical control during landings, decelerations, and directional changes (Bahr & Krosshaug, 2005; Cronström et al., 2020; Hewett et al., 2005). Consequently, there is increasing interest in field-feasible methods capable of identifying athletes who exhibit high-risk movement patterns during functional performance.
Functional performance tests, including the Drop Vertical Jump (DVJ), Landing Error Scoring System (LESS), Change of Direction (COD), Single-Leg Squat (SLS), Tuck Jump (TJ), and Star Excursion Balance Test (SEBT), provide a practical window into dynamic stability and movement quality (Dos’Santos et al., 2022; Hanzlíková & Hébert-Losier, 2020; Munro & Herrington, 2010; Oleksy et al., 2021; Padua et al., 2015; Smith et al., 2012). Each test targets specific components of sensorimotor control relevant to knee safety, including frontal-plane alignment, trunk-pelvic control, reactive coordination, and landing strategy. However, their predictive capacity is modest when used in isolation, suggesting that ACL-related neuromechanical risk identification requires multimodal integration rather than reliance on single-task metrics (Dallinga et al., 2012; Fältström et al., 2021; Hewett et al., 2005; Padua et al., 2015).
Fatigue is a critical match-relevant condition that systematically alters performance outcomes, magnifying deficits in landing quality, directional control, ground-reaction forces (GRFs), and neuromuscular timing (Alimoradi et al., 2024; Dingenen & Gokeler, 2017; Hewett et al., 2005; Silva et al., 2018; Taylor & Burkhart, 2025; Van Melick et al., 2019). However, most current ACL risk models do not include fatigue-state metrics, despite evidence that hazardous mechanics may become more apparent under fatigued conditions. This omission may reduce the ecological validity and applicability of existing assessment approaches.
Machine-learning (ML) methods can integrate multimodal performance features, movement quality, reactive control, stability, strength, and fatigue-induced changes while capturing nonlinear relations that exceed the limitations of traditional regression models (Collins et al., 2024; Nagendran et al., 2020; Van Eetvelde et al., 2021; Xu et al., 2023). However, prior ML studies in this domain often feature small sample sizes, limited external validation, or incomplete reporting transparency. To enhance transparency and methodological rigour, regression- and ML-based classification models should be transparently reported in accordance with relevant transparent reporting of a multivariable prediction model for individual prognosis or diagnosis (TRIPOD)-artificial intelligence (AI) principles, evaluated for potential sources of bias, and assessed using appropriate measures of discrimination, calibration, and decision-curve analysis (Collins et al., 2024; Jauhiainen et al., 2022; Liu et al., 2020; Van Calster et al., 2019; Van Calster et al., 2018; Vickers & Elkin, 2006; Vickers et al., 2016; Wolff et al., 2019).
This study aims to evaluate whether a combination of fatigue-inclusive multimodal functional tests and machine learning can enable accurate classification of ACL-related neuromechanical risk profiles in soccer players. We prioritised performance tests as the primary source of model features and incorporated fatigue-inclusive metrics to better reflect match-relevant neuromechanical demands. We hypothesised that a multimodal, test-centric ML model would achieve high discrimination (area under the receiver operating characteristic curve [AUC] ≥ 0.85) and strong internal classification performance, with indicators of reactive control, landing quality, and fatigue sensitivity emerging as important classification features. A secondary objective was to compare the task-specific discriminatory performance of the six functional tests to determine which assessments provide the strongest stand-alone classification signal under fatigued conditions within this cohort.
2. Material and methods
2.1. Participants
Seventy-five male soccer players were screened for eligibility; 70 eligible players were recruited and allocated in a 1:1 ratio to the experimental (n = 35) or control (n = 35) group using a computer-generated random sequence created by the first author in Microsoft Excel. Allocation concealment was maintained using sealed envelopes until group assignment. All participants completed testing. Inclusion criteria were first-team or reserve status and participation in five or more weekly training sessions. Exclusion criteria included lower-limb injury or surgery within 6 months, neurological or musculoskeletal disorders, and goalkeeper position (McLean et al., 2007; McLean & Samorezov, 2009). All athletes were pain-free at the time of testing. Ethical approval was obtained from an institutional research ethics committee, and all procedures adhered to the Declaration of Helsinki (World Medical Association 2025).
2.2. Sample size estimation and justification
An a priori sample size calculation was performed using G*Power 3.1, based on reliability considerations for key neuromechanical outcomes, assuming an intraclass correlation coefficient (ICC) of 0.85, α = 0.05, and 90% power, which indicated a minimum requirement of 30 participants per group (Kang, 2021). Accordingly, 70 players (35 per group) were recruited to exceed this threshold and to allow for potential data loss. This calculation was designed to support the experimental repeated-measures and measurement-reliability components of the study and was not intended to establish adequacy for definitive ML model development. Therefore, the ML analysis was prespecified as an exploratory, early-stage developmental classification analysis. To reduce model complexity and the risk of overfitting, the candidate predictor set was restricted a priori to no more than ten prespecified, biomechanically plausible, and interpretable variables, considering measurement reliability, multicollinearity, and interpretability. Model performance was estimated using stratified fivefold internal cross-validation. Therefore, the ML results should be interpreted as developmental internal-validation estimates that require confirmation through external validation in larger independent cohorts.
2.3. Study design and procedures
This controlled two-group, repeated-measures, fatigue-inclusive ML classification study was conducted indoors (22 ± 2°C; 45 ± 5% humidity; 09:00–14:00) to reduce potential circadian variability (Dambroz et al., 2022). Each athlete completed two identical biomechanical test batteries (pre and post). The experimental group performed a soccer-specific fatigue protocol between sessions, whereas the control group repeated testing without fatigue. A guidelines for reporting reliability and agreement studies (GRRAS)- and enhancing the quality and transparency of health research (EQUATOR)-aligned protocol and variable dictionary are provided in Appendices A and B. Task order across the six functional tests was randomised using a Latin-square schedule. Athletes refrained from strenuous activity for 24 h, slept ≥7 h, and avoided alcohol and caffeine. A standardised warm-up (5 min cycling + 5 min dynamic drills) preceded testing. Rest intervals were 60–90 s between trials and 3–5 min between tests. All players wore standardised footwear and performed on the same force-plate-integrated surface (Atkinson & Nevill, 1998; Behm & Chaouachi, 2011; Chtourou & Souissi, 2012; Hopkins, 2000). The overall study design and experimental workflow are summarised in Figure 1.
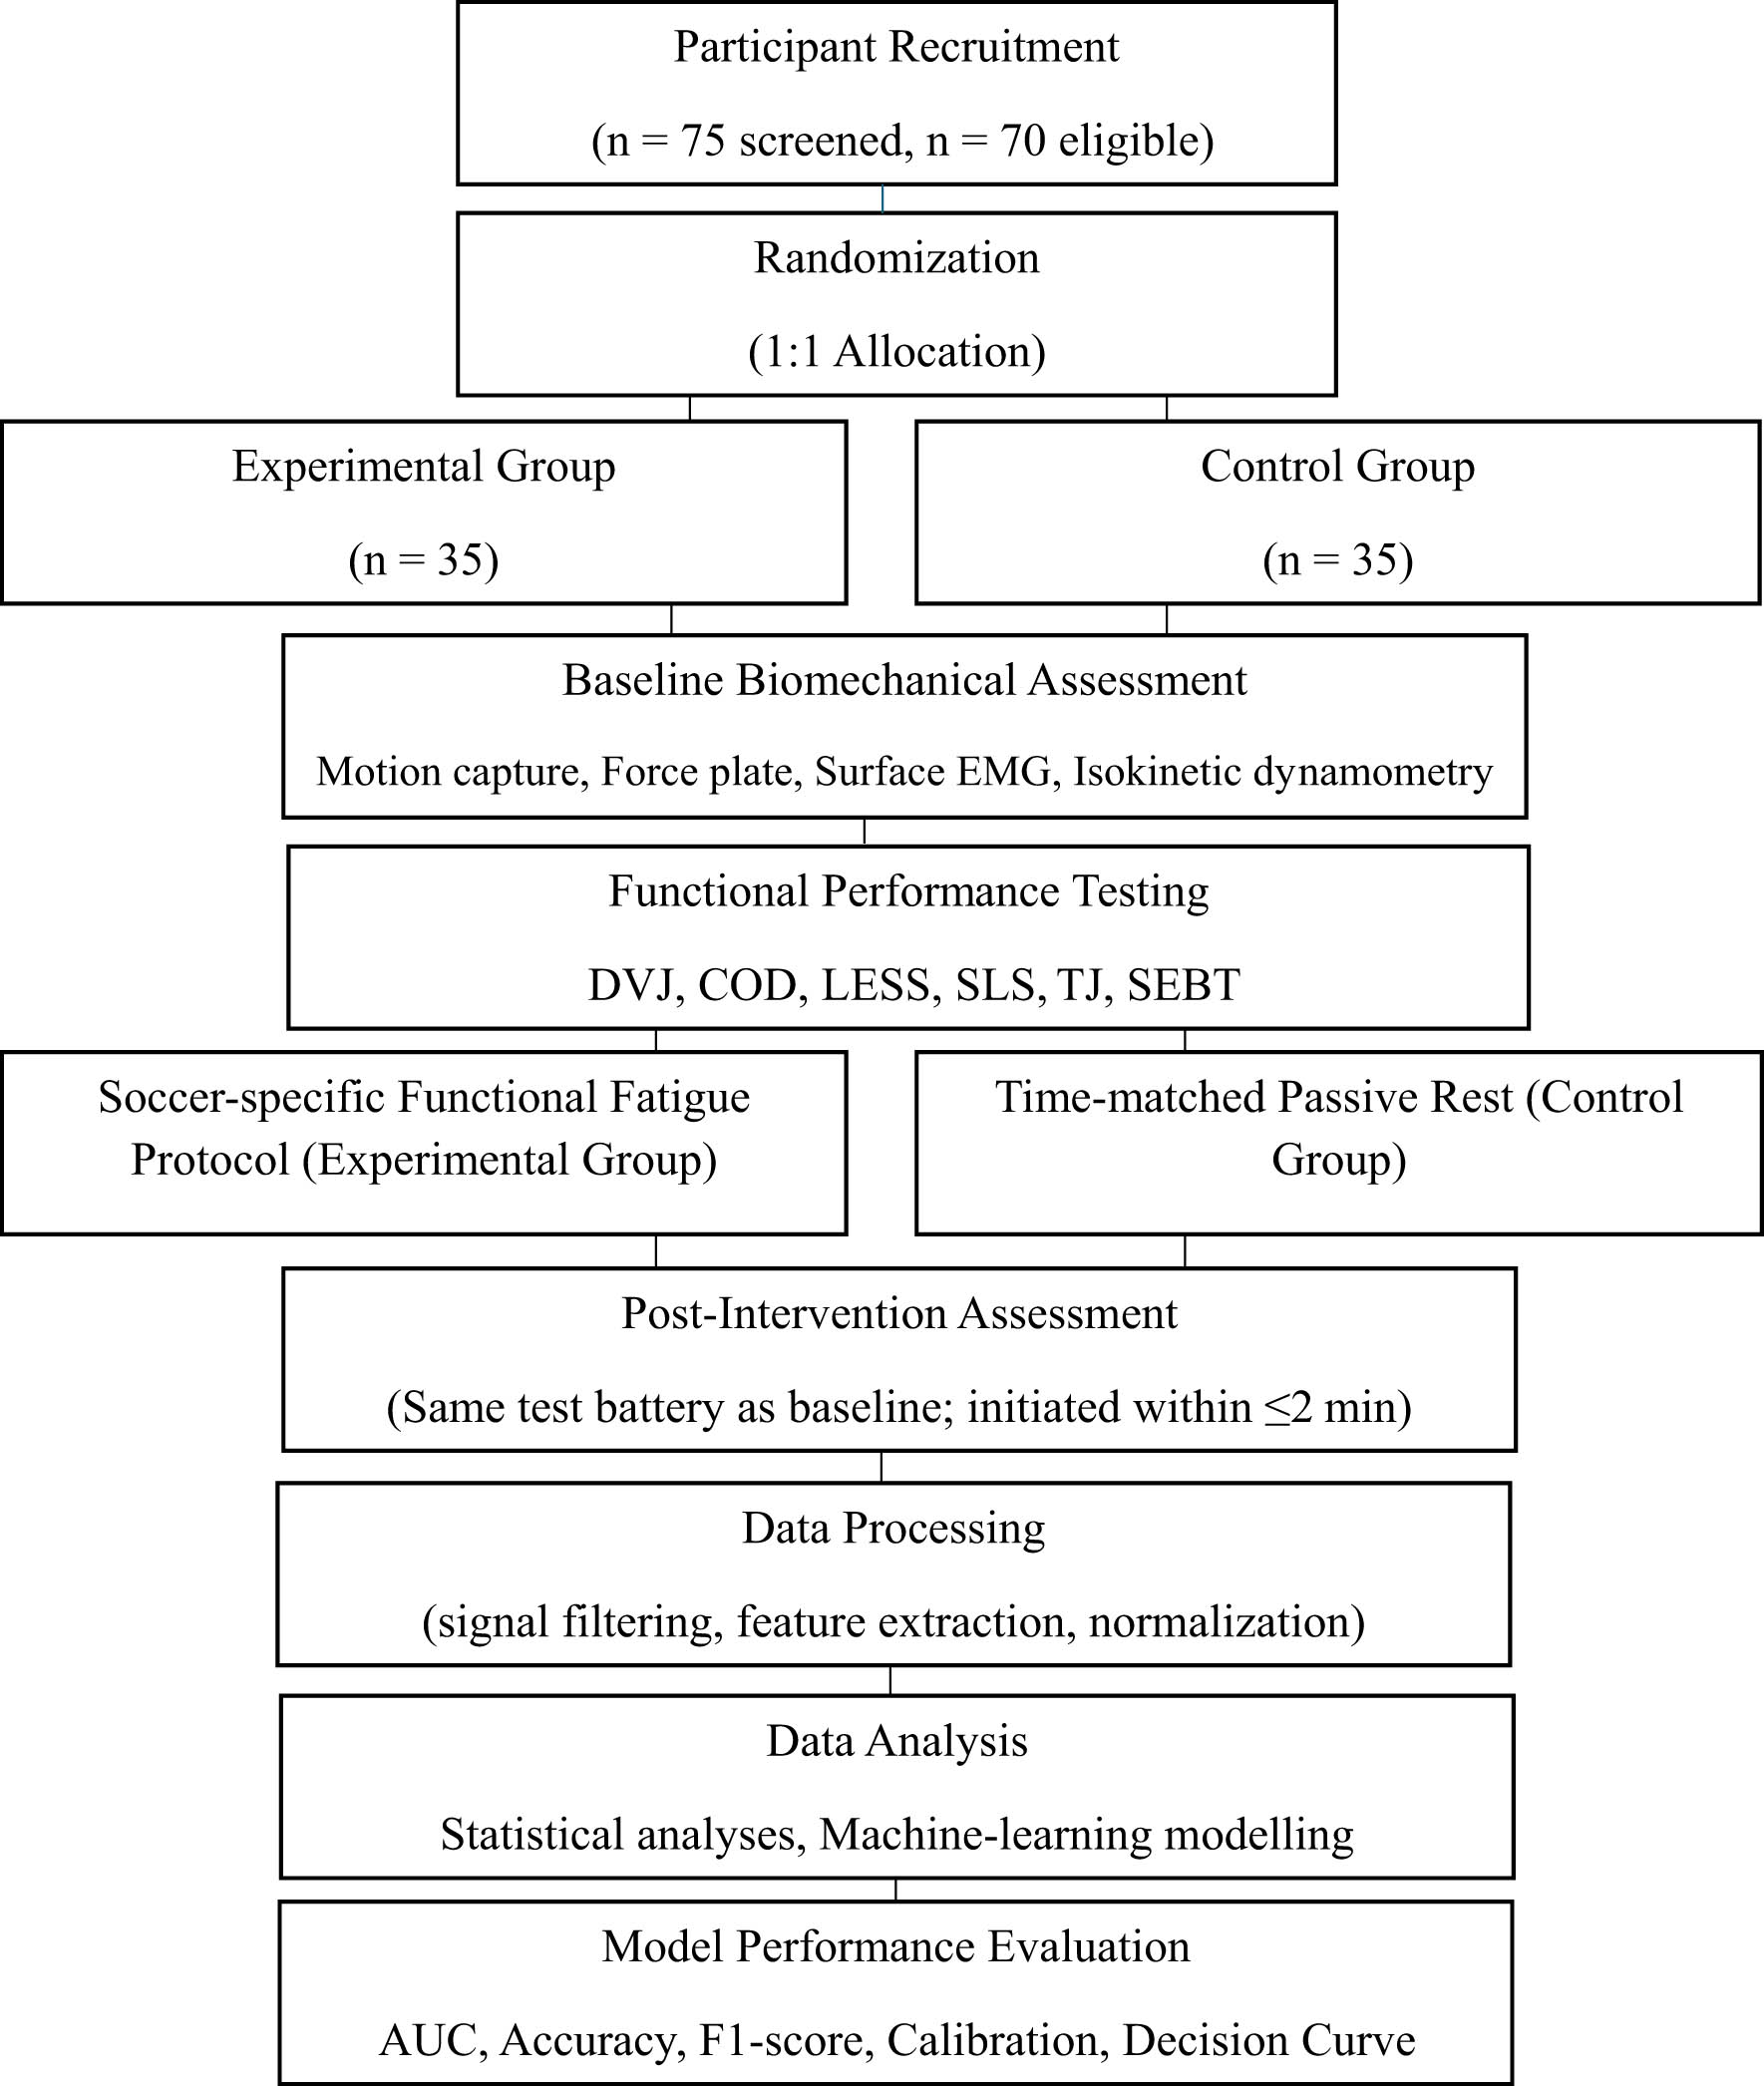
Figure 1
Overview of the study design and experimental workflow. DVJ, Drop Vertical Jump; COD, Change of Direction; LESS, Landing Error Scoring System; SLS, Single-Leg Squat; TJ, Tuck Jump; SEBT, Star Excursion Balance Test; EMG, electromyography; and AUC, area under the receiver operating characteristic curve
Source: Authors’ contribution
2.4. Functional test battery
Six soccer-relevant assessments, DVJ (Ford et al., 2003; Hewett et al., 2005), LESS (Hanzlíková & Hébert-Losier, 2020; Padua et al., 2009), COD (Dos’Santos et al., 2021; Nimphius et al., 2016), SLS (Crossley et al., 2011; Nakagawa et al., 2014), TJ (Myer et al., 2008), and SEBT (Gribble et al., 2012; Plisky et al., 2006), targeted ACL-related neuromechanical features, with operational definitions in Appendix C. These tests addressed complementary domains: bilateral landing mechanics (DVJ and LESS), multiplanar loading and reactive control (COD), unilateral alignment (SLS), plyometric control (TJ), and dynamic balance (SEBT). Collectively, they assessed dynamic knee valgus, GRF profiles, postural stability, and neuromuscular efficiency (Ageberg et al., 2010; Beyer et al., 2020; Lloyd et al., 2020; Redler et al., 2016). Limb dominance was defined as the preferred kicking leg (Ekstrand et al., 2020).
2.5. Fatigue protocol
Players in the experimental group completed a soccer-specific intermittent functional fatigue protocol comprising three 5 min blocks of repeated 15–20 m sprints, rapid directional changes, and jump-landing tasks at heart rate (HR) ≥85% maximum heart rate (HRmax) and rating of perceived exertion (RPE) ≥17 (da Silva & Lovell, 2020; Sládečková et al., 2019; Williams et al., 2010). Within the protocol, repeated functional cycles comprised eight squats (∼90° knee flexion), two maximal vertical jumps, and three single-leg drop landings from 30 cm, performed continuously with minimal recovery. HR was monitored continuously (HRmax = 220−age), and RPE was recorded after each cycle. The physiological-perceptual fatigue endpoint comprised HR remaining within ±3 beats min⁻1 of 85% HRmax for >2 min and RPE ≥18 (Borg, 1982), with performance-based fatigue additionally indicated by inability to maintain ≥90% of initial movement speed or complete five consecutive squats at ∼90° knee flexion. The protocol targeted repeated high-intensity, multidirectional, and landing-related soccer demands rather than full-match replication. The control group rested for an equivalent duration under the same conditions, and post-fatigue testing commenced within 2 min of protocol termination.
2.6. Instrumentation
Three-dimensional motion capture used a 10-camera system (Raptor-E, Motion Analysis Corp., USA) sampling at 250 Hz with a full-body Helen Hayes marker set. A 3D biomechanical model was created in CORTEX and Visual3D, with segment coordinate systems defined for the pelvis, thigh, shank, and trunk. Joint angles, including knee valgus, were calculated as 3D Cardan (x–y–z) angles. GRFs were recorded at 2,000 Hz using two embedded force plates (AMTI, USA). Surface electromyography (sEMG) signals were collected with an eight-channel wireless system (Myon AG, Switzerland) at 2,000 Hz. Bipolar electrodes were placed according to surface electromyography for the non-invasive assessment of muscles (SENIAM) guidelines on vastus medialis, vastus lateralis, biceps femoris, semitendinosus, gluteus maximus, gluteus medius, internal oblique, and multifidus. Skin was prepared to reduce impedance; inter-electrode spacing was 20 mm, aligned with muscle fibres, with impedance maintained <5 kΩ. Quadriceps and hamstring torque were measured concentrically and eccentrically at 60, 180, and 240°/s using a Biodex isokinetic dynamometer. Each player performed three maximal repetitions; peak torque was retained (Drouin et al., 2004; Tuominen et al., 2023). All devices were synchronised and calibrated according to the manufacturer’s procedures. Synchronisation was verified using an external pulse (jitter <1 ms), and initial contact (IC) was defined as vertical GRF >20 N. Motion-capture accuracy was <2 mm root mean square (RMS); force-plate calibration used static weight verification. Isokinetic alignment ensured joint-axis coincidence with gravity correction. A pilot test with five players confirmed setup feasibility and EMG preprocessing reliability (ICC >0.85) (Besomi et al., 2019; Staudenmann et al., 2010). All analyses were independently performed by two PhD-level biomechanists blinded to player identity and session order, and inter-rater reliability was calculated using repeated analyses of identical datasets (Koo & Li, 2016; Shrout & Fleiss, 1979).
2.7. Signal processing
Kinematic data were processed in CORTEX using the Helen Hayes marker set. Small gaps were interpolated, and trajectories were smoothed using a zero-lag, bidirectional, fourth-order Butterworth filter at 6 Hz. Cut-off frequencies (6 Hz kinematics, 30 Hz kinetics) followed residual analysis (Davis et al., 1991). GRFs were low-pass filtered at 30 Hz. EMG signals were band-pass filtered (20–450 Hz; fourth-order, zero-lag Butterworth), rectified, and smoothed with a 50-ms RMS window, consistent with sEMG guidelines. EMG amplitude was normalised to maximum voluntary isometric contraction (MVIC) (Besomi et al., 2019; Burden, 2010; De Luca, 1997; Hermens et al., 2000). EMG onset latency was defined as the first point exceeding baseline mean + 3 standard deviation (SD) for ≥25 ms within the task-specific window (Merrigan et al., 2020). Trials with excessive noise or electrode detachment were repeated. Data were reoriented in C3D Tools for OpenSim import (Delp et al., 2007), processed in Mokka and Visual3D, and exported to Microsoft Excel. For landing and cutting tasks (DVJ, LESS, COD, and TJ), knee valgus and associated kinematic variables were defined as 3D frontal-plane angles at peak vertical GRF within 0–200 ms after IC. For quasi-static tasks (SLS and SEBT), knee valgus, hip adduction/internal rotation, pelvic drop, and trunk kinematics were taken at mid-stance, corresponding to the deepest squat (SLS) or peak reach (SEBT). Peak and mediolateral GRF were computed over the same stance windows and normalised to body weight (BW). Co-contraction indices were calculated over the task-specific stance phase as described in Appendix B (Bahr & Krosshaug, 2005; Cronström et al., 2020). Trials with >10-frame marker loss or EMG artefacts >2 SD were excluded; remaining missing data were handled via listwise deletion (Schreven et al., 2015).
2.8. Software and computational environment
Motion-capture, force-plate, and EMG data were processed in CORTEX v7.1, Visual3D v6.01, and Mokka v0.6.2. Musculoskeletal analysis used OpenSim v4.4. Statistical computations were performed in SPSS v27.0.1 and Python 3.11 (NumPy, pandas, SciPy, and scikit-learn). All steps were executed as batch workflows; manual interventions were limited to ≤10-frame gap-filling and predefined artefact rejection rules. Analysis scripts are given in Appendix D (Wilkinson et al., 2016).
2.9. Outcomes
The primary mechanistic outcome was post-fatigue knee valgus (degrees), defined as the 3D frontal-plane angle between the thigh and shank at peak vertical GRF during stance for landing and cutting tasks and at mid-stance for SLS and SEBT (Appendix B). The prespecified regression predictor set included peak vertical ground-reaction force (vGRF) (BW), hamstring onset latency, pelvic drop, co-contraction index (CCI), and the hamstring-to-quadriceps strength ratio (H:Q). The H:Q ratio was derived from isokinetic dynamometer tests as peak hamstring to peak quadriceps torque at each velocity (60, 180, and 240°/s). For all regression and ML analyses, the H:Q ratio at 180°/s was used as the primary strength–balance predictor, as this angular velocity provides a functionally relevant and widely reported index of concentric hamstring-quadriceps balance in soccer players. Binary classification labels were derived from the predefined Surrogate ACL-Risk Index (SARI), a laboratory-derived composite neuromechanical surrogate profile. The index was calculated from fatigue-induced within-subject changes (Δ = post-fatigue − pre-fatigue) in knee valgus, peak vGRF, and hamstring onset latency, selected a priori to represent complementary ACL-related loading and neuromuscular-control domains (Cronström et al., 2020; Hewett et al., 2005; Zebis et al., 2009). Each Δ-variable was standardised using z-scores, and the composite score was calculated as follows:
Equal weighting was applied because no established clinically validated weighting scheme was available for these surrogate neuromechanical components. Participants were dichotomised into high- and low-risk surrogate profiles using a median split of the post-fatigue SARI distribution. The SARI was used solely to generate surrogate classification labels and was not interpreted as a measure of prospective ACL injury risk. Because some SARI components were also included as candidate ML predictors, predictor–outcome profile overlap was present. Although the index was predefined independently of model fitting and participant-level separation was maintained during cross-validation, this overlap may have inflated internal discrimination and should be considered a source of potential optimism rather than evidence of independent predictive validity. External validation against prospective ACL injury outcomes is therefore required. This composite index reflects ACL-related neuromechanical surrogate risk rather than clinical ACL injury incidence.2.10. Composite index explanation
The SARI was predefined as a laboratory-derived composite neuromechanical construct based on fatigue-induced changes in knee valgus, peak vGRF, and hamstring onset latency. Each component was standardised using z-scores and combined with equal weighting because no clinically validated weighting scheme exists for these surrogate neuromechanical variables. The index was specified before model development and was not optimised using ML algorithms, regression coefficients, or participant-derived weighting procedures, thereby preserving methodological transparency and minimising data-driven optimisation. Accordingly, the SARI represents a predefined surrogate neuromechanical profile rather than a clinical ACL injury prediction model (Cronström et al., 2020; Hewett et al., 2005).
2.11. Statistical and ML analyses
Data are presented as mean ± SD. Normality was assessed using the Shapiro–Wilk test and homogeneity using the Levene test. Outliers (|z| > 3) were winsorised or, where justified, removed, with full justification reported in the Supplementary material. Within-group paired comparisons quantified pre- and post-changes, and between-group comparisons contrasted experimental versus control responses. Effect sizes (Cohen’s d) were categorised as small (<0.5), moderate (0.5–0.8), or large (≥0.8). Statistical significance was set at p < 0.05 (two-tailed). Multiple linear regression identified independent predictors of post-fatigue knee valgus, including peak vGRF, hamstring onset latency, pelvic drop, H:Q ratio, and CCI. Assumptions were checked using variance inflation factors (≤2.5) and the Durbin–Watson statistic (≈2.0). Three ML models – logistic regression, random forest, and an ensemble voting classifier – were trained using experimental-group data. The ensemble used equal-weight (1:1) soft voting, averaging class probabilities from logistic regression and random forest and assigning the class with the highest mean probability. To minimise overfitting, the predictor set was restricted to no more than ten prespecified variables, and model performance was evaluated using stratified fivefold internal cross-validation. In each fold, approximately 80% of participants were used for training, and the remaining 20% were used exclusively for validation within the cross-validation procedure rather than as an independent hold-out test set. No independent external test cohort was available; therefore, all reported performance estimates should be interpreted as internally validated developmental estimates requiring confirmation in larger independent cohorts. All observations from the same participant were retained within the same fold to prevent information leakage between training and validation datasets. Performance metrics included accuracy, precision, recall, F1 score, and AUC. Task-wise models were trained using features from each functional test separately. Feature importance was computed using permutation-based importance with 95% confidence intervals (CIs), and decision-curve analysis was performed as an exploratory assessment of potential utility within the developmental cohort. Reporting followed TRIPOD+AI and prediction model risk of bias assessment tool (PROBAST)+artificial intelligence (AI) recommendations, with a completed checklist given in Appendix E. These models represent early-stage developmental frameworks requiring external validation.
2.12. Data and reproducibility statement
All workflows operated as automated batch pipelines; manual operations followed predefined artefact-handling rules. Preprocessing, feature extraction, modelling, and validation pipelines are provided in Appendix D. De-identified data and analysis pipelines will be made publicly available in a findable, accessible, interoperable, and reusable (FAIR)-compliant repository upon publication.
3. Results
3.1. Participant characteristics
Seventy male soccer players completed all sessions. There were no significant baseline differences between groups for age, body mass, height, or playing experience (all p > 0.05; Table 1). All players were injury-free at the time of testing. Based on the SARI, within the experimental group, 14 players (40%) were classified as high-risk and 21 players (60%) as low-risk.
Table 1
Participant characteristics (n = 70)
| Variable | Control (mean ± SD) | Experimental (mean ± SD) | p-value |
| Age (years) | 25.1 ± 3.5 | 25.7 ± 3.0 | 0.34 |
| Body mass (kg) | 78.4 ± 6.8 | 77.9 ± 7.2 | 0.65 |
| Height (cm) | 181.6 ± 5.9 | 182.1 ± 6.1 | 0.52 |
| Playing experience (years) | 8.2 ± 2.1 | 8.4 ± 2.3 | 0.57 |
Note: Values are mean ± SD. Independent t-tests confirmed no baseline differences between groups (all p > 0.05).
Source: Authors’ contribution
3.2. Task-specific performance responses to fatigue
Across all six functional tests, the experimental group showed significant pre-post fatigue-related changes, whereas the control group exhibited only minimal time-matched changes. Changes in the experimental group reflected increased knee valgus, altered hip and pelvic kinematics, elevated GRFs, delayed hamstring activation, and impaired neuromuscular coordination.
3.3. DVJ
Knee valgus increased by +5.3° (+66%, p < 0.001; d = 1.05), hip internal rotation by +3.1° (+48%, p = 0.002), and pelvic drop by +1.2° (+52%, p = 0.006). Peak vGRF increased by +25% to 4.0 ± 0.5 BW (p < 0.001). Hamstring RMS decreased by 15% (p = 0.003), quadriceps RMS increased by 16% (p = 0.002), and hamstring onset latency was delayed by +28 ms (+70%, p < 0.001). CCI increased by +6% (p = 0.020).
3.4. LESS
Knee valgus increased by +3.2° (+46%, p = 0.001; d = 0.80), hip internal rotation increased by +2.5° (+45%, p = 0.002), and pelvic drop increased by +1.3° (+65%, p = 0.006). Peak vGRF increased by +0.7 BW (+24%, p < 0.001). Hamstring onset latency increased by +21 ms (+53%, p < 0.001), with reductions in hamstring RMS (−14%) and increases in quadriceps RMS (+14%), yielding a +6% rise in CCI (p = 0.020).
3.5. COD
Knee valgus increased by +4.8° (+56%, p < 0.001; d = 1.05), hip internal rotation increased by +4.1° (+41%, p < 0.001), pelvic drop increased by +1.6° (+64%, p = 0.005), and trunk lateral flexion increased by +1.7° (+55%, p = 0.006). Peak vGRF and ML GRF increased 24–33% (p ≤ 0.002). Hamstring onset latency increased by +26 ms (+65%, p < 0.001). H:Q ratio and hamstring RMS both showed reductions.
3.6. SLS
Knee valgus increased by +3.8° (+41%, p < 0.001; d = 0.90), hip adduction/internal rotation increased by +3.5° (+26%, p = 0.004), and pelvic drop increased by +2.1° (+84%, p = 0.002). Loading rate increased by +15% (p = 0.008). Hamstring onset latency increased by +26 ms (+70%, p < 0.001), and CCI increased by +6% (p = 0.030).
3.7. TJ
Knee valgus increased by +3.1° (+42%, p = 0.001), hip adduction/internal rotation increased by +3.0° (+25%, p = 0.004), and pelvic drop increased by +79% (p = 0.010). vGRF and ML GRF increased by 23–32% (p ≤ 0.002). Hamstring onset latency increased by +24 ms (+60%, p < 0.001), with reduced hamstring RMS (−16%) and increased quadriceps RMS (+15%). CCI increased by +7% (p = 0.015).
3.8. SEBT
Knee valgus increased by +2.9° (+38%, p < 0.001; d = 0.75), hip adduction/internal rotation increased by +2.7° (+27%, p = 0.004), and pelvic drop increased by +1.2° (+52%, p = 0.010). Peak vGRF increased by +0.4 BW (+21%, p < 0.001). Hamstring onset latency increased by +22 ms (+59%, p < 0.001), with hamstring RMS reduced by approximately 15%.
3.9. Across tests
Across the six tests in the experimental group, knee valgus increased by 38–66%, hip internal rotation/adduction increased by approximately 25–48%, pelvic drop increased by 43–84%, and peak vGRF increased by 21–25%. Hamstring onset latency increased by 59–70%. In contrast, corresponding changes in the control group remained ≤6% across all variables.
3.10. Regression analysis
Peak vGRF (β = 0.48 ± 0.11, p < 0.001), hamstring onset latency (β = 0.42 ± 0.10, p < 0.001), pelvic drop (β = 0.25 ± 0.11, p = 0.031), and CCI (β = 0.24 ± 0.11, p = 0.022) were positively associated with post-fatigue knee valgus, whereas H:Q ratio was negatively associated (β = −0.31 ± 0.12, p = 0.014). The model explained 68% of variance (R 2 = 0.68; Adj R 2 = 0.65; F (5, 64) = 17.1; p < 0.001), with acceptable multicollinearity (VIF ≤ 2.5) and residual independence (Durbin-Watson = 2.01) (Table 2 and Figure 2).
Table 2
Multiple regression predicting post-fatigue knee valgus (°)
| Predictor | β ± SE | 95% CI | p |
| Peak vGRF (BW) | 0.48 ± 0.11 | 0.26–0.70 | <0.001 |
| Hamstring onset latency (ms) | 0.42 ± 0.10 | 0.22–0.62 | <0.001 |
| H:Q ratio | −0.31 ± 0.12 | −0.55 to −0.07 | 0.014 |
| Pelvic drop (°) | 0.25 ± 0.11 | 0.04–0.46 | 0.031 |
| CCI (%) | 0.24 ± 0.11 | 0.03–0.45 | 0.022 |
Values are standardised regression coefficients (β ± SE) with 95% confidence intervals (CI). H:Q, hamstring-to-quadriceps ratio; CCI, co-contraction index.
Source: Authors’ contribution
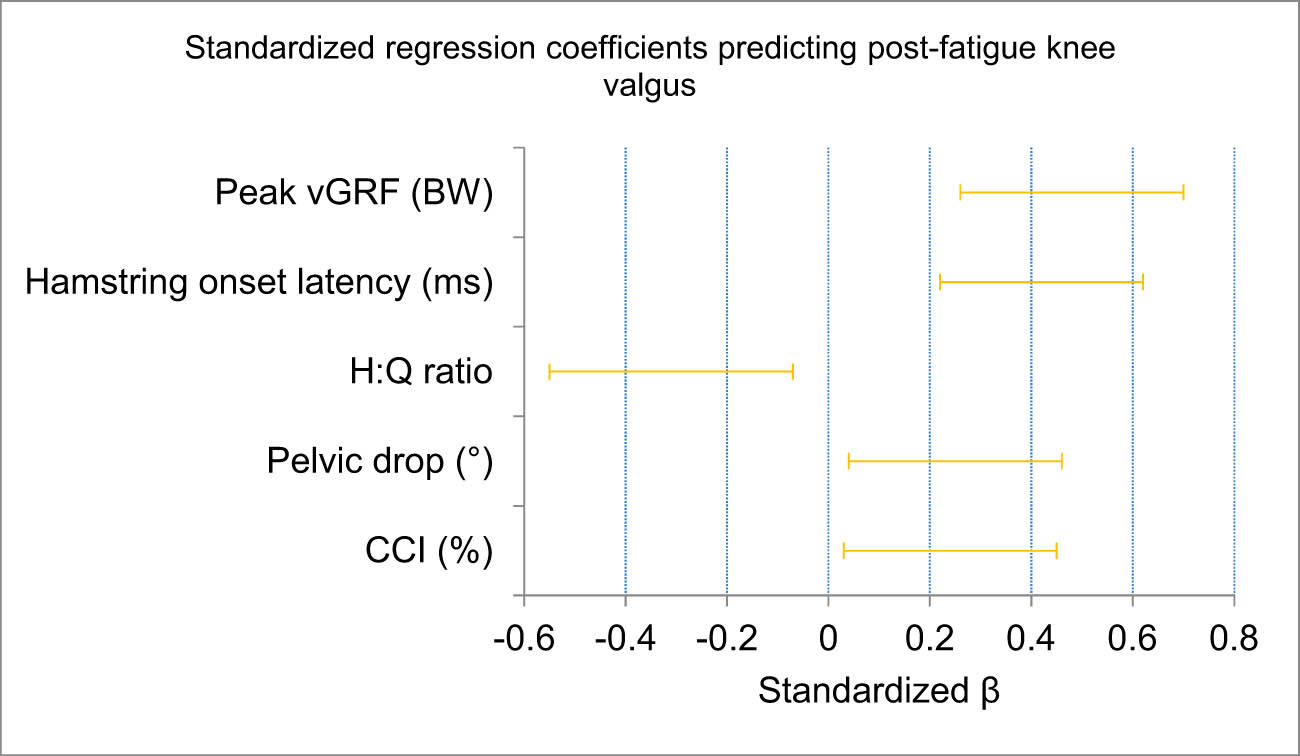
Figure 2
Forest plot of standardised regression coefficients (β) predicting post-fatigue knee valgus. Standardised regression coefficients (β) with 95% confidence intervals for the five prespecified predictors: peak vGRF, hamstring onset latency, pelvic drop, co-contraction index, and H:Q ratio. Peak vGRF and hamstring latency showed the strongest positive associations, while H:Q ratio exerted a protective effect
Source: Authors’ contribution
3.11. Multivariate association model
In an exploratory multivariate analysis of the predefined composite, Δ-knee valgus (β = 0.42, η 2 = 0.29), Δ-hamstring onset latency (β = 0.38, η 2 = 0.26), and Δ-peak vGRF (β = 0.31, η 2 = 0.20) showed the strongest associations with the composite score, while hip adduction/internal rotation (β = 0.27, η 2 = 0.15) and H:Q ratio (β = −0.24, η 2 = 0.13) showed additional associations. The exploratory model explained 61% of the total variance (R 2 = 0.61).
3.12. ML model performance
The ensemble voting classifier achieved an accuracy of 0.91, an F1 score of 0.90, and an AUC of 0.95 (Table 3 and Figure 3). The ensemble classifier yielded a sensitivity of 90.1% and specificity of 92.6%; the normalised confusion matrix showed 90.1%/9.9% predicted high/low risk among actual high-risk cases and 7.4%/92.6% predicted high/low risk among actual low-risk cases, respectively. Random forest achieved an AUC of 0.93, and logistic regression achieved an AUC of 0.90. Internal calibration estimates of the ensemble model included slope (0.98) and intercept (−0.02). Feature importance, ranked from highest to lowest, was as follows: hamstring onset latency (27%), peak vGRF (24%), H:Q ratio (17%), pelvic drop (13%), and CCI (9%). The observed internal calibration estimates were favourable within this cohort, with a calibration slope of 0.98, an intercept of −0.02, and a Brier score of 0.07. These estimates were obtained from internal validation within the single-centre developmental cohort and should not be interpreted as externally validated model performance.
Table 3
Machine-learning model performance
| Model | Accuracy | Sensitivity | Specificity | Precision | Recall | F1 | AUC |
| Logistic regression | 0.86 | 0.84 | 0.87 | 0.83 | 0.84 | 0.84 | 0.90 |
| Random forest | 0.89 | 0.88 | 0.90 | 0.87 | 0.88 | 0.88 | 0.93 |
| Ensemble (voting) | 0.91 | 0.90 | 0.92 | 0.89 | 0.90 | 0.90 | 0.95 |
Reported metrics include accuracy, sensitivity, specificity, precision, recall, F1-score, and area under the receiver operating characteristic curve (AUC). Models were trained using fivefold cross-validation with approximately 80% training and 20% validation per fold.
Source: Authors’ contribution
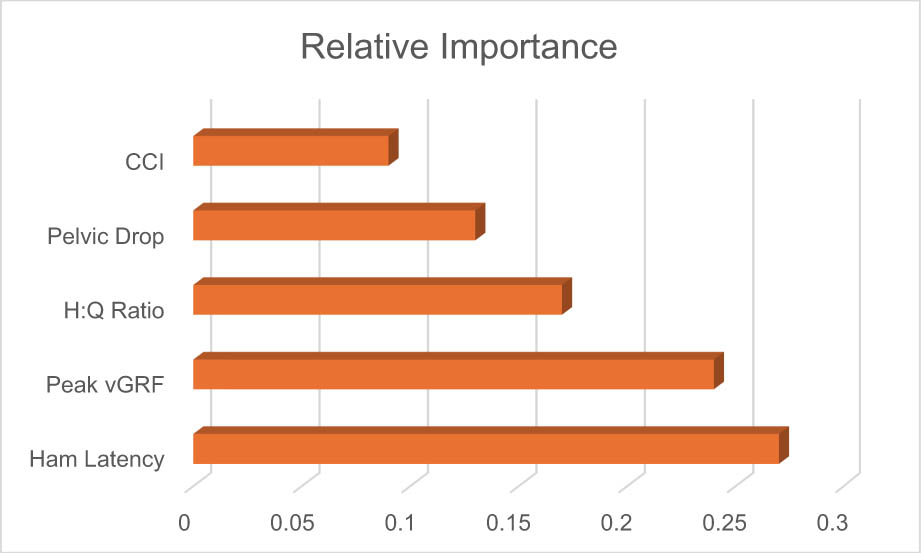
Figure 3
Feature-importance ranking for the ensemble classifier. Relative contribution of the predictors used in the ensemble model. Hamstring onset latency and peak vertical ground-reaction force (vGRF) were the strongest determinants of ACL-related neuromechanical classification, followed by H:Q ratio, pelvic drop, and co-contraction index
Source: Authors’ contribution
3.13. Functional test classification performance
COD produced the highest AUC (0.95; 95% CI: 0.89–0.99), followed by DVJ (0.94; 95% CI: 0.87–0.98), SLS (0.92; 95% CI: 0.85–0.97), LESS (0.91; 95% CI: 0.84–0.96), TJ (0.90; 95% CI: 0.82–0.95), and SEBT (0.88; 95% CI: 0.80–0.94). COD and DVJ offered the strongest single-test discrimination (Table 4 and Figure 4).
Table 4
Multimodal functional test classification performance summary
| Task | Accuracy | F1 | AUC | Ranking |
| Change of Direction (COD) | 0.90 | 0.90 | 0.95 | 1 |
| Drop Vertical Jump (DVJ) | 0.89 | 0.88 | 0.94 | 2 |
| Single-Leg Squat (SLS) | 0.88 | 0.87 | 0.92 | 3 |
| Landing Error Scoring System (LESS) | 0.87 | 0.86 | 0.91 | 4 |
| Tuck Jump (TJ) | 0.86 | 0.85 | 0.90 | 5 |
| Star Excursion Balance Test (SEBT) | 0.84 | 0.84 | 0.88 | 6 |
Accuracy, F1-score, and AUC values represent classification performance derived from task-specific feature sets.
Source: Authors’ contribution
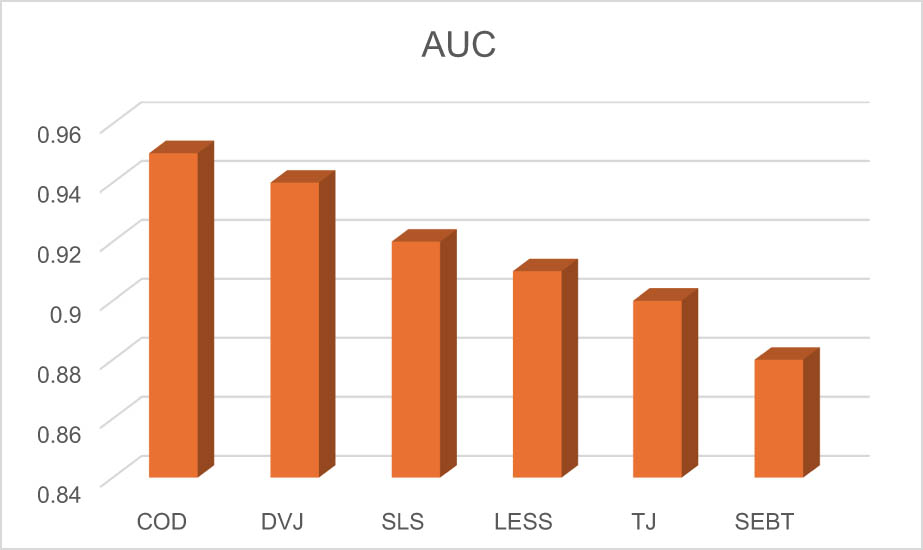
Figure 4
Functional test discriminative performance (AUC values). Area under the curve (AUC) values for the six individual functional tests. COD and DVJ demonstrated the strongest single-task discriminative performance (AUC = 0.95 and 0.94, respectively), followed by SLS, LESS, TJ, and SEBT
Source: Authors’ contribution
3.14. Receiver operating characteristic and decision-curve analyses
Receiver operating characteristic curves reflected the discriminative hierarchy across models (Figure 5). Calibration curves showed close agreement between predicted and observed probabilities. Decision-curve analysis demonstrated higher model-derived net benefit compared with treat-all and treat-none reference strategies across thresholds of 0.25–0.60 within the developmental cohort.
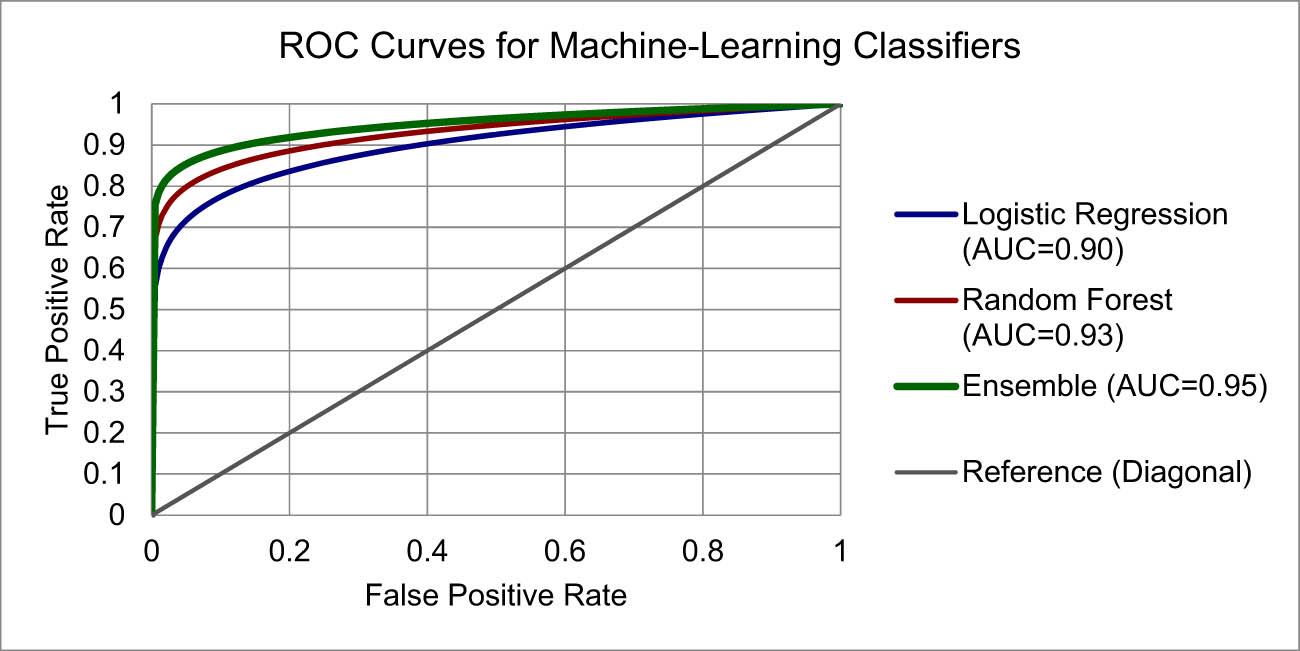
Figure 5
Receiver operating characteristic (ROC) curves for machine-learning classifiers. The ensemble voting classifier (AUC = 0.95) outperformed both the random forest (AUC = 0.93) and the logistic regression (AUC = 0.90) models. The diagonal line denotes the reference classifier
Source: Authors’ contribution
4. Discussion
4.1. Principal findings
The present study provides preliminary evidence that a multimodal, performance-test-centric ML approach can classify laboratory-derived ACL-related surrogate neuromechanical profiles under fatigue within this cohort. Across six functional tests, fatigue was associated with deterioration in performance-linked neuromechanical control in the experimental group, whereas the control group exhibited only minimal time-matched changes. COD and DVJ yielded the strongest single-task classification signals (0.95 and 0.94; Table 4), potentially reflecting their greater demands on rapid force absorption and reactive movement control. Post-fatigue knee valgus was independently associated with peak vGRF, hamstring onset latency, pelvic drop, and CCI, while H:Q was protective (Table 2). The ensemble internally validated discrimination (AUC = 0.95; F1 = 0.90), with favourable internal calibration estimates and exploratory decision-curve findings within the developmental cohort (Table 3). Feature contribution analysis highlighted reactive control and loading-related variables, consistent with the proposed neuromechanical framework. Collectively, this study demonstrates that integrating fatigue-inclusive neuromechanical features may provide additional information for classification of surrogate neuromechanical profiles compared with non-fatigued assessment conditions. However, these performance estimates reflect internal validation only; external validation is essential to estimate true generalisability.
4.2. Comparison with prior work
The present findings are consistent with previous evidence that fatigue can alter knee-loading patterns and impair hamstring timing during high-demand tasks (Dingenen & Gokeler, 2017; McLean et al., 2007; McLean & Samorezov, 2009; Silva et al., 2018). The observed pattern of increased knee valgus, elevated vGRFs, prolonged hamstring onset latency, and reduced hamstring-to-quadriceps strength ratio aligns with mechanistic and applied field literature (Bahr & Krosshaug, 2005; Cronström et al., 2020; Hewett et al., 2005; Xu et al., 2023). These findings should be interpreted as consistent with established neuromechanical patterns rather than direct evidence of ACL injury mechanisms. In contrast to earlier studies that typically evaluated one task or one modality, this study provides a methodological contribution through (i) synchronised multimodal assessment across six functional performance tests within the same experimental framework; (ii) explicit integration of fatigue-inclusive features within the same testing frameworks; and (iii) transparent developmental ML reporting with internal discrimination, calibration assessment, and exploratory decision-curve analysis (Collins et al., 2024; Jauhiainen et al., 2022; Van Calster et al., 2019). The stronger single-task classification signals observed for COD and DVJ are consistent with their high mechanical and reactive-control demands, which appear to elicit fatigue-sensitive neuromechanical changes more strongly than balance-dominant tasks such as SEBT (Dos’Santos et al., 2021; Ford et al., 2003; Lloyd et al., 2020).
4.3. Mechanistic interpretation
A multi-component neuromechanical pattern emerged: (i) external loading demands (represented by peak vGRF) increased; (ii) hamstring onset latency lengthened, reflecting altered reactive neuromuscular timing during demanding movement phases; (iii) strength-related capacity and coordination characteristics changed (H:Q decreases, CCI increases); and (iv) pelvic/trunk control alterations occurred alongside changes in lower-limb movement coordination. Taken together, these fatigue-associated changes represent a coordinated pattern of altered movement control and loading demands that may contribute to increased multiplanar knee-loading potential during high-demand tasks. The ML models integrated these multidomain features to classify the predefined surrogate neuromechanical profile. These mechanistic interpretations are consistent with, but do not establish, causal pathways (Cronström et al., 2020; Dambroz et al., 2022; David & Barton, 2023; Hewett et al., 2005). This interpretation aligns well with established ACL-related neuromechanical frameworks.
4.4. Clinical and performance implications
Fatigue-inclusive assessment may provide additional information regarding neuromechanical control under match-relevant conditions by identifying differences in laboratory-derived surrogate neuromechanical profiles that may not be apparent during non-fatigued testing. The presence of a non-fatigued control group supports the interpretation that observed changes were more likely related to fatigue exposure rather than solely to temporal or learning effects (Alimoradi et al., 2024; Taylor & Burkhart, 2025; Van Melick et al., 2019). When logistical constraints limit the number of assessments, COD and DVJ may represent candidate tasks for future validation studies evaluating more efficient fatigue-inclusive assessment batteries, given their superior discriminative performance and sensitivity to fatigue-related deficits (Dos’Santos et al., 2022; Ford et al., 2003; Lloyd et al., 2020). The features contributing most strongly to classification included hamstring onset latency, H:Q ratio, peak vGRF, and pelvic/trunk control, which represent potential mechanistic targets for future investigation. Enhancing reactive hamstring timing, improving hamstring-quadriceps strength balance, reducing excessive loading rates, and stabilising lumbopelvic mechanics may be associated with favourable shifts in the modelled risk profile (Cronström et al., 2020; Dingenen & Gokeler, 2017; Hewett et al., 2005). Decision-curve analysis provided an exploratory assessment of model-derived utility within the developmental cohort. Because the classified outcome represented a surrogate neuromechanical profile rather than observed ACL injury, these findings should not be interpreted as evidence of established clinical benefit or decision-support readiness (Van Calster et al., 2018; Vickers & Elkin, 2006; Vickers et al., 2016). These implications align with applied priorities in strength and conditioning, performance monitoring, and return-to-play decision-making, highlighting the importance of fatigue-specific assessments.
4.5. Strengths
Key strengths of this study include a homogeneous elite cohort, tightly standardised testing conditions, synchronised multimodal measurement across six functional tests, and within-session fatigue assessment. Reporting adhered closely to TRIPOD+AI and PROBAST+AI guidelines, with complete documentation of model discrimination, calibration, and exploratory decision-curve analysis. The inclusion of a time-matched non-fatigued control group further enhanced internal validity by enabling separation of fatigue effects from temporal or learning effects.
Although this implementation relied on laboratory-grade equipment (3D motion capture, force plates, and EMG), the key mechanistic markers identified – knee valgus, pelvic/trunk control, reactive hamstring timing, and loading responses – can be approximated using more field-feasible tools such as 2D video, inertial sensors, or portable force platforms. These findings, therefore, provide a laboratory-based foundation for the future development of field-deployable assessment frameworks. Moreover, pre-specification of predictors, analyst blinding, and independent processing further strengthened methodological rigour.
4.6. Limitations
This study has several limitations. First, although two groups were studied, both originated from a single elite male population, limiting generalisability to other sexes, age groups, and competitive levels and sporting contexts. Model transportability may also be influenced by centre-specific factors, including testing procedures, instrumentation, and data-processing workflows. Second, although the composite neuromechanical risk index was predefined based on established mechanisms, it serves as an indirect surrogate neuromechanical outcome rather than observed ACL injury events, limiting direct inferences about prospective ACL injury incidence. It should therefore not be interpreted as an absolute injury probability, clinically validated injury-risk category, or intervention threshold. Third, all models underwent internal validation only; therefore, the reported performance estimates may be subject to optimism, sampling variability, and model instability despite the use of prespecified predictors and cross-validation. Although the overall study included 70 participants, the ML analyses were developed using only the 35 fatigue-group participants, including 14 participants classified within the high-risk surrogate profile. These estimates should be interpreted as developmental performance pending external validation. Independent external validation and prospective evaluation against ACL injury outcomes are required to determine generalisability and potential future applicability. Fourth, the fatigue protocol and laboratory-grade instrumentation may not fully reflect field conditions. Furthermore, the laboratory-based assessment approach may limit immediate field implementation despite providing detailed neuromechanical characterisation. Finally, although predictors were restricted to no more than ten prespecified variables in accordance with TRIPOD+AI guidance, the event-per-variable ratio inherent to elite-cohort samples may still influence model stability.
4.7. Future directions
Future research should first establish external and temporal validation across independent squads, leagues, sexes, age groups, and competitive tiers to determine the framework’s generalisability and transportability. In addition, incorporating multi-centre elite sport data harmonisation will be critical for scaling these findings. Prospective impact studies are also needed to evaluate whether future intervention strategies informed by neuromechanical patterns identified here meaningfully improve return-to-play progression or reduce ACL injury incidence. Continued model updating and monitoring will be essential to track calibration drift over time and under varying workload or season-cycle conditions. Integrating contextual workload and exposure variables may further enhance classification accuracy and explain within-athlete variability. In parallel, developing field-deployable versions of this framework using markerless motion capture, wearable sensors, or surrogate measures of hamstring timing and landing mechanics may facilitate future evaluation of scalable field-oriented approaches. Finally, incorporating explainability tools, such as explainability dashboards (e.g. shapley additive explanations (SHAP)-based), may improve interpretation of model outputs and support future investigations into athlete-specific applications. Overall, this framework and its findings should be considered hypothesis-generating and developmental, requiring confirmation and updating in larger, prospective, multi-centre cohorts with longitudinal follow-up of ACL injuries.
5. Conclusion
In soccer players, multimodal features from functional performance tests conducted under fatigue enable promising internally validated classification of a laboratory-derived ACL-related surrogate neuromechanical profile. Hamstring onset latency, peak vGRF, and H:Q ratio were the most influential features contributing substantially to classification, complemented by pelvic/trunk control and co-contraction indices. COD and DVJ demonstrated the strongest single-test classification signals. This fatigue-inclusive, performance-centric framework represents a methodologically structured approach as an early-stage developmental model and now warrants external validation and prospective impact evaluation in larger, multi-centre cohorts with prospective injury outcomes. This model provides a developmental framework for the future evaluation of practical, field-oriented assessment approaches.
Acknowledgements
The authors sincerely thank the soccer players and participating clubs for their cooperation and commitment throughout the study.
Funding information
The authors received no financial support for the research, authorship, or publication of this article.
Author contributions
Conceptualisation, data curation, and visualization: Himan Ebrahimi and Ali Asghar Norasteh. Methodology and investigation: Himan Ebrahimi, Ali Asghar Norasteh, and Hassan Daneshmandi. Software and formal analysis: Himan Ebrahimi and Ali Sharifnezhad. Supervision: Ali Sharifnezhad and Mostafa Zarei. Writing – original draft: Himan Ebrahimi. Writing – review and editing: Himan Ebrahimi, Ali Asghar Norasteh, Hassan Daneshmandi, Ali Sharifnezhad, and Mostafa Zarei. All authors approved the final manuscript.
Conflict of interest statement
The authors declare that they have no known competing financial or personal interests that could have influenced the work reported in this article.
Data availability statement
All supplementary materials associated with this study (including tables, figures, Appendices A–D, the whole variable dictionary, and the analytical workflow) are available via the Open Science Framework (OSF) project linked to this preregistration (https://osf.io/r2zak). The whole de-identified dataset will be deposited in a FAIR-compliant public repository upon publication. Until public release, de-identified data and analysis scripts are available from the corresponding author for academic use upon reasonable request.
Ethics approval and informed consent
The study was approved by the Research Ethics Committee of the Physical Education and Sports Sciences Research Institute (approval no. SSRI.REC-2311-2550). All participants provided written informed consent in accordance with the Declaration of Helsinki.
AI statement
Generative artificial intelligence tools were used solely for language editing and formatting. No AI tools were used for study design, data collection, statistical analysis, scientific interpretation, or the generation of scientific content. All scientific content, analyses, and interpretations were produced and verified by the authors.
Supplementary material
Supplementary files associated with this article, including extended tables, figures, Appendices A–E, the complete variable dictionary, and the full analytical workflow, are available via the Open Science Framework project (https://osf.io/r2zak).