
1. Introduction
Football talent development systems in Southeastern Europe have expanded considerably over the past decade, with an increasing number of clubs investing in structured youth academies. The scientific literature supporting these programmes, however, remains uneven in its geographic coverage. The majority of published physical performance data for youth football players derive from Western and Northern European academies (Deprez et al., 2015; Valente-dos-Santos et al., 2012). Data from Central and Eastern European cohorts, particularly from the Balkans, are sparse, which limits the ability of practitioners in the region to benchmark their players against comparable populations.
Linear speed and lower-limb explosive power are among the most frequently studied physical qualities in youth football, as they underpin many decisive actions in match play (Hulse et al., 2013; Soós et al., 2022). It should be acknowledged, however, that short linear sprints over 5–20 m capture predominantly the initial acceleration phase and therefore provide only a partial representation of the speed demands of football, which also require the attainment and repeated expression of high running velocities over longer distances (Lovell et al., 2019). Short-distance sprint tests were nevertheless selected in the present study because they reflect the acceleration distances most frequently encountered in youth match play and are feasible within the constraints of an academy monitoring programme.
The under-13 age category is of particular developmental interest, as it typically coincides with the onset of the adolescent growth spurt. During this period, players of the same chronological age may differ markedly in biological maturity, and these differences influence anthropometric characteristics, muscular strength, and motor performance (Peña-González et al., 2018; Toselli et al., 2021). Longitudinal observations in this age group must therefore be interpreted against a background of ongoing growth, which may itself account for part of any observed change in performance (Valente-dos-Santos et al., 2012).
Inter-limb asymmetry has attracted growing attention in youth football, both as a descriptive characteristic and as a candidate screening variable. Evidence indicates that asymmetry magnitudes vary substantially between assessment modalities within the same players (Ascenzi et al., 2022; Raya-González et al., 2021) and that asymmetry appears largely independent of maturity status (Asimakidis et al., 2022; Bouafif et al., 2024). Its behaviour across a competitive season in pre-adolescent players, however, has received limited attention.
The aim of this study was therefore to assess changes in linear speed, lower-limb explosive power, and inter-limb isokinetic force asymmetry in male under-13 academy football players across a 5-month period of the competitive season.
2. Material and methods
2.1. Participants
Twenty-three male football players from the 2012 age group of a single football academy participated in the study. At baseline, mean body height was 154.7 ± 6.8 cm (range 142–169) and body mass was 40.8 ± 4.7 kg (range 33–49). Nineteen players (83%) reported right-limb dominance, and four players (17%) reported left-limb dominance. All players were free from injury at the time of the baseline assessment and had been training within the academy for at least one full season.
Throughout the observation period, players followed the standard academy training programme, consisting of four field-based sessions per week of approximately 90 min each – three technical–tactical sessions and one conditioning session – plus one competitive match per week. No structured resistance training or dedicated sprint training programme was implemented. Training load was not quantified using session rating of perceived exertion (session-RPE) or global positioning system (GPS) monitoring; this is addressed in Section 5. The flow of participants through the study is presented in Figure 1.
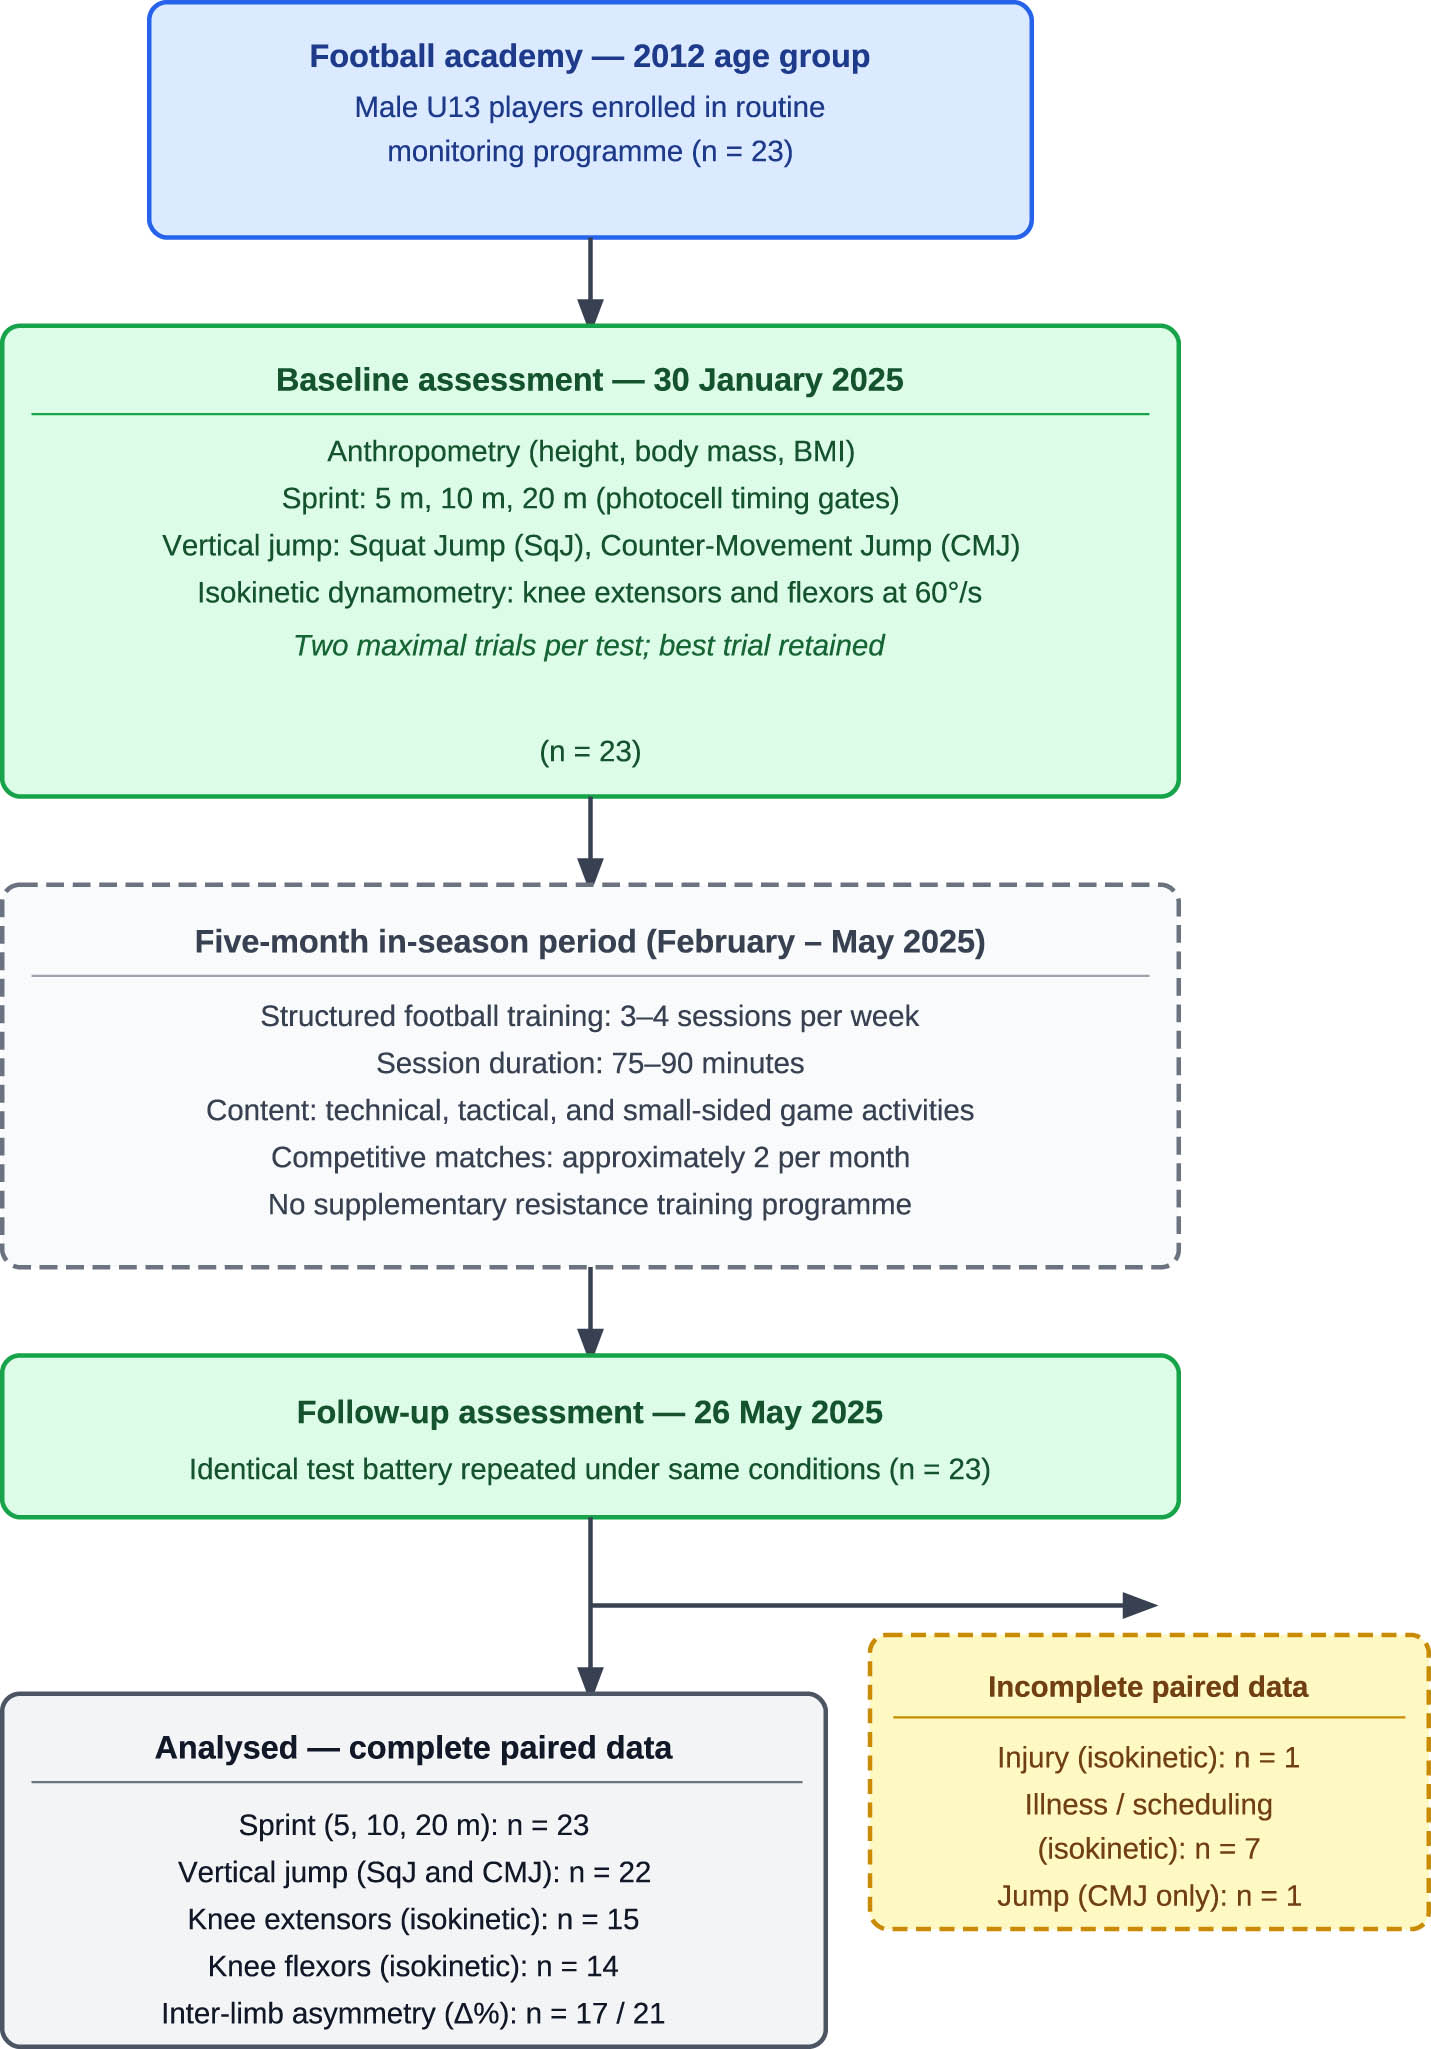
Figure 1
Flow of participants through the study. SqJ, squat jump
Source: Author’s contribution.
2.2. Anthropometric assessment
Body height was measured to the nearest 0.1 cm using a portable stadiometer, with participants standing barefoot, heels together, and the head aligned in the Frankfort horizontal plane. Body mass was measured to the nearest 0.1 kg using a calibrated digital scale, with participants wearing light sportswear and no footwear. All anthropometric measurements were taken by the same investigator at both testing sessions, prior to any physical testing. Sitting height was not recorded, and consequently somatic maturity status could not be estimated using the algorithm of Mirwald et al. (2002).
2.3. Testing procedures
All tests were conducted on 30 January 2025 and repeated on 26 May 2025 at the same time of day, on an indoor athletics track, and under comparable environmental conditions. The test order was identical at both sessions: anthropometry, warm-up, sprint testing, vertical jump testing, and isokinetic assessment. Testing was preceded by a standardised 15-min warm-up comprising jogging, dynamic mobility exercises, and three progressive submaximal accelerations.
The selected tests are well established in youth football. Field test batteries incorporating 10 and 20 m linear sprints and vertical jump assessments have demonstrated logical and construct validity, as well as acceptable test–retest reliability in elite young football players of comparable age (Hulse et al., 2013). Standardised vertical jump protocols, including the countermovement and squat jump, have shown excellent relative reliability (intraclass correlation coefficient [ICC] = 0.969–0.995) with low coefficients of variation (CV; 1.54–4.82%) across age categories in football and basketball players, including under-15 groups (Rodríguez-Rosell et al., 2017), and comparable reliability has been reported for sprint and jump assessments in football populations more broadly (Mainer-Pardos & Gonzalo-Skok, 2025). These tests are routinely applied in youth football research to characterise physical development, evaluate training programmes, and inform talent identification (Nobari et al., 2022; Soós et al., 2022; Valente-dos-Santos et al., 2012).
2.3.1. Linear sprint
Sprint performance was assessed over 5, 10, and 20 m using the Witty photocell timing system (Microgate, Bolzano, Italy). Gates were positioned at the start line and at 5, 10, and 20 m, with the beams set at a height of 80 cm, corresponding to approximately hip height in this age group. Players adopted a standing split-stance starting position with the front foot placed 0.7 m behind the first gate to prevent premature triggering. Sprints were initiated from a self-selected start rather than in response to an auditory command, with timing triggered automatically as the player broke the first beam. Each player performed two maximal trials separated by 3 min of passive recovery, wearing running shoes. The mean of the two trials was used for analysis.
2.3.2. Vertical jump
Lower-limb explosive power was assessed using the squat jump (SqJ) and countermovement jump (CMJ), measured with the Optojump optical measurement system (Microgate, Bolzano, Italy). The system comprises transmitting and receiving bars positioned parallel to one another at ground level, which detect interruptions of the infrared beams and thereby determine flight time, from which jump height is derived. The Optojump system has demonstrated excellent concurrent validity against force plate measurements (ICC = 0.997–0.998) and excellent test–retest reliability (ICC = 0.982–0.989; CV = 2.7%) for the estimation of vertical jump height (Glatthorn et al., 2011).
For the SqJ, players began from a static semi-squat position with the knees flexed at approximately 90°, held this position for 2 s, and jumped vertically without any preparatory countermovement. For the CMJ, players began from an upright standing position and performed a rapid downward movement immediately followed by a maximal vertical jump. In both tests, the hands were kept on the hips throughout to eliminate the contribution of arm swing, and players were instructed to land in an extended position on the same spot. Each player performed two trials of each jump separated by 3 min of recovery, and the highest jump was retained for analysis. Trials involving a visible countermovement during the SqJ or leg flexion during flight were discarded and repeated.
2.3.3. Isokinetic strength and inter-limb asymmetry
Unilateral isokinetic peak force of the knee extensors and knee flexors was assessed using the Kineo Intelligent Load system (Globus, Codognè, Italy), an electromechanical device that applies a controlled load and records force output for each limb separately. Players were seated with the trunk and pelvis secured by restraining belts, and the seat position was standardised for each player and reproduced identically at both sessions. Testing was performed in isokinetic mode at a constant angular velocity of 60°/s. Each limb was assessed separately, beginning with the dominant limb, with 1 min of passive recovery between limbs. A single measurement was recorded for each limb and each exercise, consisting of three consecutive maximal repetitions, from which the device derived peak force in kilograms. Standardised verbal encouragement was provided during each attempt.
Inter-limb asymmetry was calculated for each exercise as the difference between the stronger and weaker limb expressed as a percentage of the stronger limb: Asymmetry (%) = (stronger − weaker)/stronger × 100. In the absence of established thresholds for this age group and device, asymmetry values were additionally categorised using the 10, 15, and 20% cut-offs commonly applied in the applied sport science literature and are reported as a descriptive screening indicator rather than as an index of injury risk. Peak force values obtained during knee extension and knee flexion are not directly comparable in absolute terms, as the two exercises differ in machine set-up and effective lever arm; between-exercise comparisons of absolute force were therefore not performed.
2.4. Missing data
Not all participants completed the full test battery at both timepoints. One player sustained an injury during the January session after completing the sprint assessment and was subsequently unable to perform vertical jump testing at either timepoint, although he was cleared to complete seated isokinetic assessment in May. A further eight players missed isokinetic testing at one of the two sessions owing to illness at the time of testing or scheduling constraints within the club’s monitoring programme. Complete paired data were therefore available for 23 players for sprint performance, 22 for vertical jump performance, 15 for knee extension, and 14 for knee flexion. All analyses were conducted on available cases; the sample size is reported for each analysis, and no imputation was performed.
2.5. Statistical analysis
Data are presented as means ± standard deviations, with medians and ranges additionally reported for asymmetry variables owing to their skewed distribution. Changes between the two testing sessions were analysed using paired-samples t-tests. Effect sizes were calculated as Cohen’s d for paired samples and interpreted as trivial (<0.20), small (0.20–0.49), medium (0.50–0.79), and large (≥0.80). Statistical significance was set at p < 0.05. All analyses were conducted on available cases for each variable.
2.6. Ethical approval
The data analysed in this study were originally collected as part of the routine physical monitoring programme of the football club and were not gathered for research purposes. Written informed consent for participation in club fitness testing, including the use of anonymised data for analytical and scientific purposes, is obtained annually from the parents or legal guardians of all academy players and was in place for all participants prior to the first testing session. Retrospective approval for the secondary analysis of these anonymised data was granted by the Ethics Committee of the National Sports Academy “Vassil Levski,” Sofia, Bulgaria (approval no. EC-NSA-2026-004, April 2026). All procedures were conducted in accordance with the ethical standards of the Declaration of Helsinki. All data were fully anonymised prior to analysis, and no individually identifying information is reported.
3. Results
3.1. Linear speed
Sprint results are presented in Table 1. Acceleration performance declined over the observation period. Sprint times increased significantly over both 5 m (p = 0.034; d = 0.47) and 10 m (p = 0.015; d = 0.55), corresponding to small-to-medium effects. Over 20 m, times were essentially unchanged (p = 0.697; d = −0.08). Linear speed abilities therefore showed no improvement across the 5-month period, with the deterioration confined to the shorter distances that most closely reflect initial acceleration.
Table 1
Sprint times at baseline and follow-up (n = 23)
| Distance (m) | January | May | Δ (s) | t(22) | p | d |
|---|---|---|---|---|---|---|
| 5 | 1.23 ± 0.09 | 1.27 ± 0.09 | +0.033 | 2.27 | 0.034 | 0.47 |
| 10 | 2.06 ± 0.13 | 2.11 ± 0.10 | +0.053 | 2.64 | 0.015 | 0.55 |
| 20 | 3.57 ± 0.12 | 3.56 ± 0.13 | −0.008 | −0.39 | 0.697 | −0.08 |
Notes: Values are means ± standard deviations of two trials. Δ, mean change (positive values indicate slower times); d, Cohen’s d. Significance was set at p < 0.05.
Source: Author’s contribution.
3.2. Explosive power
Vertical jump results are presented in Table 2. In contrast to the sprint results, lower-limb explosive power improved. Both SqJ (p = 0.047; d = 0.45) and CMJ (p = 0.036; d = 0.48) increased significantly, with small effect sizes and comparable magnitudes of approximately 1 cm.
Table 2
Vertical jump performance at baseline and follow-up (n = 22)
| Variable (cm) | January | May | Δ (cm) | t(21) | p | d |
|---|---|---|---|---|---|---|
| SqJ | 26.9 ± 4.4 | 27.9 ± 4.6 | +1.02 | 2.11 | 0.047 | 0.45 |
| CMJ | 27.6 ± 4.1 | 28.5 ± 4.0 | +0.92 | 2.24 | 0.036 | 0.48 |
Notes: Values are the best of two trials. d, Cohen’s d; SqJ, squat jump. One player was unable to perform jump testing at either timepoint owing to injury (Figure 1). Significance was set at p < 0.05.
Source: Author’s contribution.
3.3. Inter-limb asymmetry
Isokinetic peak force and asymmetry values are presented in Table 3. Inter-limb asymmetry followed divergent patterns in the two exercises. For the knee extensors, mean asymmetry decreased from 14.7 ± 13.1 to 9.4 ± 6.4% (d = −0.37), and the proportion of players exceeding the 10% threshold fell from 60 to 33%. For the knee flexors, the pattern was reversed: mean asymmetry increased from 7.1 ± 5.6 to 13.5 ± 13.3% (d = +0.46), with the proportion exceeding 10% rising from 29 to 57%.
Table 3
Isokinetic peak force and inter-limb asymmetry at 60°/s
| Knee extension (n = 15) | January | May |
|---|---|---|
| Peak force, stronger limb (kg) | 26.3 ± 6.0 | 23.9 ± 5.2 |
| Asymmetry, M ± SD (%) | 14.7 ± 13.1 | 9.4 ± 6.4 |
| Asymmetry, median (range) (%) | 11.0 (0.4–49.4) | 7.8 (1.4–26.3) |
| Players >10% | 9 (60%) | 5 (33%) |
| Players >15% | 5 (33%) | 2 (13%) |
| Players >20% | 4 (27%) | 1 (7%) |
| Knee flexion (n = 14) | January | May |
|---|---|---|
| Peak force, stronger limb (kg) | 13.5 ± 2.6 | 18.2 ± 8.1 |
| Asymmetry, M ± SD (%) | 7.1 ± 5.6 | 13.5 ± 13.3 |
| Asymmetry, median (range) (%) | 6.8 (0.0–16.7) | 11.4 (2.0–54.4) |
| Players >10% | 4 (29%) | 8 (57%) |
| Players >15% | 2 (14%) | 5 (36%) |
| Players >20% | 0 (0%) | 1 (7%) |
Notes: M, mean; SD, standard deviation. Asymmetry = (stronger limb − weaker limb)/stronger limb × 100. Sample sizes differ between exercises owing to incomplete paired data (Figure 1). Absolute peak force values from the two exercises are not directly comparable owing to differences in machine set-up and effective lever arm; between-exercise comparisons were therefore not performed.
Source: Author’s contribution.
Considerable individual variability was evident, and the distributions were positively skewed at both timepoints; medians were consequently lower than means. Three players displayed asymmetries exceeding 40% at a single timepoint. These values were verified against the original device reports and retained in the analysis. Given the absence of published reliability data for the measurement device, the extent to which such extreme values reflect biological asymmetry rather than measurement variability or submaximal effort cannot be determined, and the asymmetry findings are therefore presented as descriptive screening data rather than as evidence of systematic change.
4. Discussion
This study examined changes in selected motor abilities in male under-13 academy football players across a 5-month period of the competitive season. The principal finding was a dissociation between qualities: lower-limb explosive power improved modestly, whereas acceleration performance over 5 and 10 m declined, and performance over 20 m remained unchanged. Inter-limb isokinetic asymmetry showed divergent patterns, decreasing for the knee extensors and increasing for the knee flexors.
The contrast between improved vertical jump performance and slower sprint times merits consideration, as the two qualities are commonly assumed to develop in parallel. Several explanations are plausible. Vertical jumping and short-distance acceleration are both expressions of lower-limb power, but they differ substantially in their mechanical demands. A vertical jump requires force to be directed mainly downwards into the ground, through a single concentric extension of the legs. Acceleration, by contrast, requires force to be directed backwards as well as downwards, and must be applied within ground contact times that become progressively shorter as running speed increases. Training content during the observation period was predominantly technical and tactical, with a single weekly conditioning session and no dedicated sprint training, which may have been sufficient to maintain or slightly improve general lower-limb power output while providing insufficient specific stimulus for the horizontal force application underpinning acceleration.
A second consideration concerns growth. Rapid increases in stature and limb length during this developmental window may transiently disrupt coordination and force application, with effects that are more pronounced in tasks requiring complex intersegmental coordination such as sprint acceleration than in comparatively simpler vertical jumps (Toselli et al., 2021). Without maturity offset data, this interpretation remains speculative in the present cohort and should be examined in studies incorporating maturity assessment.
A third possibility relates to accumulated fatigue and the timing of testing. The follow-up assessment was conducted at the end of the competitive season, when residual fatigue may have been greater than at the mid-season baseline. In the absence of training load monitoring, this explanation cannot be evaluated (Nobari et al., 2022), and it is acknowledged as a limitation.
An important consideration when interpreting these findings is the potential confounding influence of biological maturation. At approximately 12–14 years of age, many players are approaching or passing peak height velocity (PHV), a period characterised by rapid increases in stature, body mass, and muscle mass, accompanied by spontaneous improvements in muscular strength, power, acceleration, and neuromuscular coordination (Toselli et al., 2021; Valente-dos-Santos et al., 2012). Chronological age is a poor proxy for biological maturity: two players of identical chronological age may differ substantially in maturity status, and such differences translate directly into measurable differences in motor performance (Peña-González et al., 2018). Consequently, the improvements observed in SqJ and CMJ between January and May cannot be attributed exclusively to training exposure or competitive participation and may, in part, reflect ongoing growth and maturation.
The influence of maturation is not uniform across qualities. Lovell et al. (2019) reported that estimated age at PHV significantly predicted high-speed and very high-speed running during match play in U15 players, whereas peak speed and total sprint distance were unaffected. Valente-dos-Santos et al. (2012), using multilevel modelling in Portuguese youth players aged 11–13 years at baseline, demonstrated that maturity status contributed significantly to the development of repeated-sprint performance, with early-maturing players outperforming later-maturing peers by a margin that stabilised from approximately 13 years of age. In contrast, inter-limb asymmetry appears largely independent of maturity status: neither change-of-direction asymmetry (Asimakidis et al., 2022) nor unilateral strength asymmetry (Bouafif et al., 2024) differs meaningfully between pre- and post-PHV players. This distinction is relevant here, as it suggests that, while the observed jump improvements may be partly maturation-driven, the asymmetry values reported in this study can reasonably be interpreted as independent of maturity stage.
The divergent behaviour of asymmetry in the two exercises is noteworthy. Knee extensor asymmetry decreased, whereas knee flexor asymmetry increased, with the proportion of players exceeding the 10% threshold approximately doubling for the knee flexors while nearly halving for the knee extensors. This dissociation is consistent with evidence that asymmetry is task- and modality-specific rather than a stable individual characteristic. Ascenzi et al. (2022), assessing elite youth players using both isokinetic knee flexor and extensor testing and loaded split-squat tests, reported that the magnitude and direction of inter-limb imbalance were inconsistent across assessment modalities and loading conditions within the same players. Raya-González et al. (2021) similarly observed that asymmetry magnitudes differed significantly between jumping, change-of-direction, and range-of-motion tests in young players. Taken together, these findings indicate that a single asymmetry value cannot be treated as representative of a player’s overall lateral balance and support the practice of reporting asymmetry separately for each test rather than pooling across measures.
From an applied perspective, the increase in knee flexor asymmetry is the more relevant observation, as the knee flexors are the muscle group most frequently implicated in non-contact injuries in football. However, the present data do not permit any inference regarding injury risk. The study was not designed to record injuries; the sample was small; and evidence linking asymmetry thresholds to subsequent injury in youth populations remains limited and inconsistent (Raya-González et al., 2021). The asymmetry data reported here should therefore be regarded as a descriptive screening indicator that may inform individualised monitoring, not as a risk classification. Where practitioners wish to address such imbalances, unilateral training approaches have been shown to reduce inter-limb differences in youth players, particularly when the weaker limb is trained first (Gonzalo-Skok et al., 2019; Moreno-Azze et al., 2021).
An important interpretative caveat concerns measurement. Three players exhibited asymmetries exceeding 40% at a single timepoint. Because no independent reliability data have been published for the measurement device used, the proportion of this variability attributable to measurement error, day-to-day biological variation, or submaximal effort in one limb cannot be determined. The divergent group-level trends should accordingly be interpreted as preliminary observations warranting confirmation with a validated device rather than as established findings.
Regional comparisons remain limited. Soós et al. (2022) provided anthropometric and physiological profiles of Hungarian academy players across the U14–U18 categories, reporting progressive increases in anthropometric parameters with age and superior performance in the oldest groups; their U14 group represents the closest available Central and Eastern European reference point to the present cohort, although the 1-year age difference and differences in testing protocols preclude direct numerical comparison. Comparable multi-age reference data have been reported for Czech academy players by Mala et al. (2020), who additionally documented morphological lower-limb asymmetries, observing significant inter-limb differences only from the U17 category onwards.
5. Strengths and limitations
The main strengths of this study are its longitudinal design within a defined competitive period; the use of a standardised and consistently administered test battery; the inclusion of sprint, jump, and isokinetic strength assessments; and the reporting of effect sizes alongside significance tests. To our knowledge, these are among the first such data reported for an under-13 academy cohort in Southeastern Europe.
Several limitations must be acknowledged. First, somatic maturity status was not assessed, as sitting height was not recorded; maturity offset and age at PHV could therefore not be estimated, and the relative contributions of training and biological maturation to the observed changes cannot be disentangled. Future studies in this population should incorporate this measurement, which requires minimal additional time and equipment.
Second, body composition was not assessed. Neither bioelectrical impedance analysis nor dual-energy X-ray absorptiometry was available, and therefore, changes in skeletal muscle mass, fat mass, and regional lean tissue distribution could not be quantified. This is a meaningful limitation, as body composition parameters are associated with sprint and jump performance in youth football players (Martins et al., 2021), and regional lean mass distribution would have provided a morphological complement to the functional asymmetry measured here (Mala et al., 2020).
Third, training load was not quantified. In the absence of session-RPE or GPS monitoring, the relationship between accumulated workload and performance change could not be examined, and the possibility that differences in individual training exposure influenced the results cannot be excluded (Nobari et al., 2022).
Fourth, to our knowledge, no independent validation studies of the isokinetic device used have been published in the peer-reviewed literature. Consequently, the measurement error associated with the isokinetic values reported here cannot be quantified, and the proportion of the observed between-session variability attributable to measurement rather than biological change is unknown.
Fifth, complete paired isokinetic data were available for fewer than two-thirds of the cohort, reducing statistical power for these comparisons.
Finally, the study was conducted in a single academy cohort of 23 players without a control group over a 5-month period within one competitive season. The sample size limits power to detect small effects, and the single-club design restricts generalisability. Longer follow-up across multiple seasons would provide a more complete picture of developmental trajectories in this age group.
6. Conclusions
Over a 5-month period of the competitive season, male under-13 academy football players showed modest improvements in lower-limb explosive power, whereas acceleration performance over the shorter sprint distances declined and 20 m performance remained unchanged. This dissociation suggests that participation in a predominantly technical–tactical training programme, with limited dedicated physical preparation, may be sufficient to maintain general lower-limb power output but insufficient to develop the horizontally oriented force application underpinning acceleration. Practitioners working with this age group may therefore wish to consider whether the in-season programme provides an adequate stimulus for speed development, while recognising that the changes observed here were small and occurred against a background of ongoing growth and maturation that could not be quantified in this study.
Inter-limb isokinetic asymmetry showed opposing patterns in the two exercises assessed: decreasing for the knee extensors and increasing for the knee flexors. This dissociation reinforces the view that asymmetry is task-specific and should be reported and monitored separately for each test rather than expressed as a single value. These asymmetry data are offered as descriptive screening information and do not support inferences regarding injury risk.
Normative physical performance data for under-13 academy players from Southeastern Europe are scarce. The present values are offered as a preliminary reference point rather than as normative standards, given the single-club design, the modest sample size, and the absence of maturity assessment. Confirmation in larger multi-club samples incorporating maturity offset and body composition assessment is required before reference values for this population can be established.
Acknowledgements
The authors thank the coaching and fitness staff of the participating football academy for their assistance with data collection, and the players and their families for their cooperation.
Funding information
This research received no specific grant from any funding agency in the public, commercial, or not-for-profit sectors.
Author contributions
D.I.: conceptualisation, methodology, formal analysis, data curation, writing – original draft, writing – review and editing, supervision. P.P.: investigation, data curation, methodology, writing – review and editing. Both authors have read and approved the final version of the manuscript.
Conflict of interest statement
The authors declare no conflict of interest.
Ethical approval
Ethics Committee of the National Sports Academy “Vassil Levski”, Sofia, Bulgaria (approval No. EC-NSA-2026-004, April 2026).
Data availability statement
The anonymised dataset analysed during the current study is available from the corresponding author upon reasonable request. The data were collected as part of the routine monitoring programme of a football academy and cannot be shared publicly without the consent of the club.