
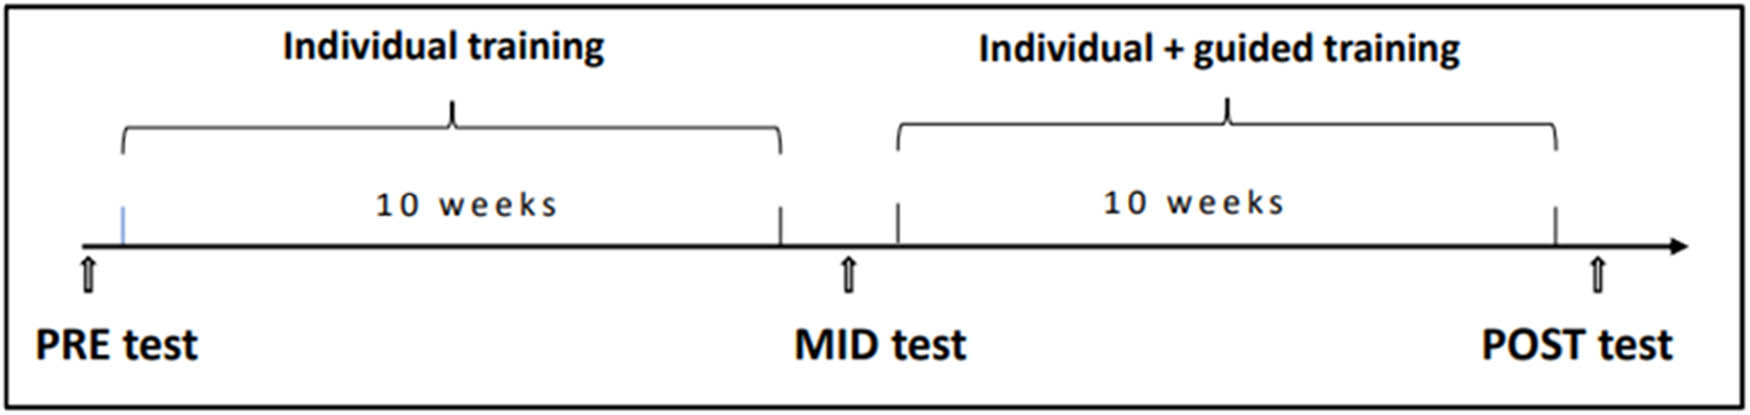
Figure 1
Study schedule
Source: Authors’ contribution.
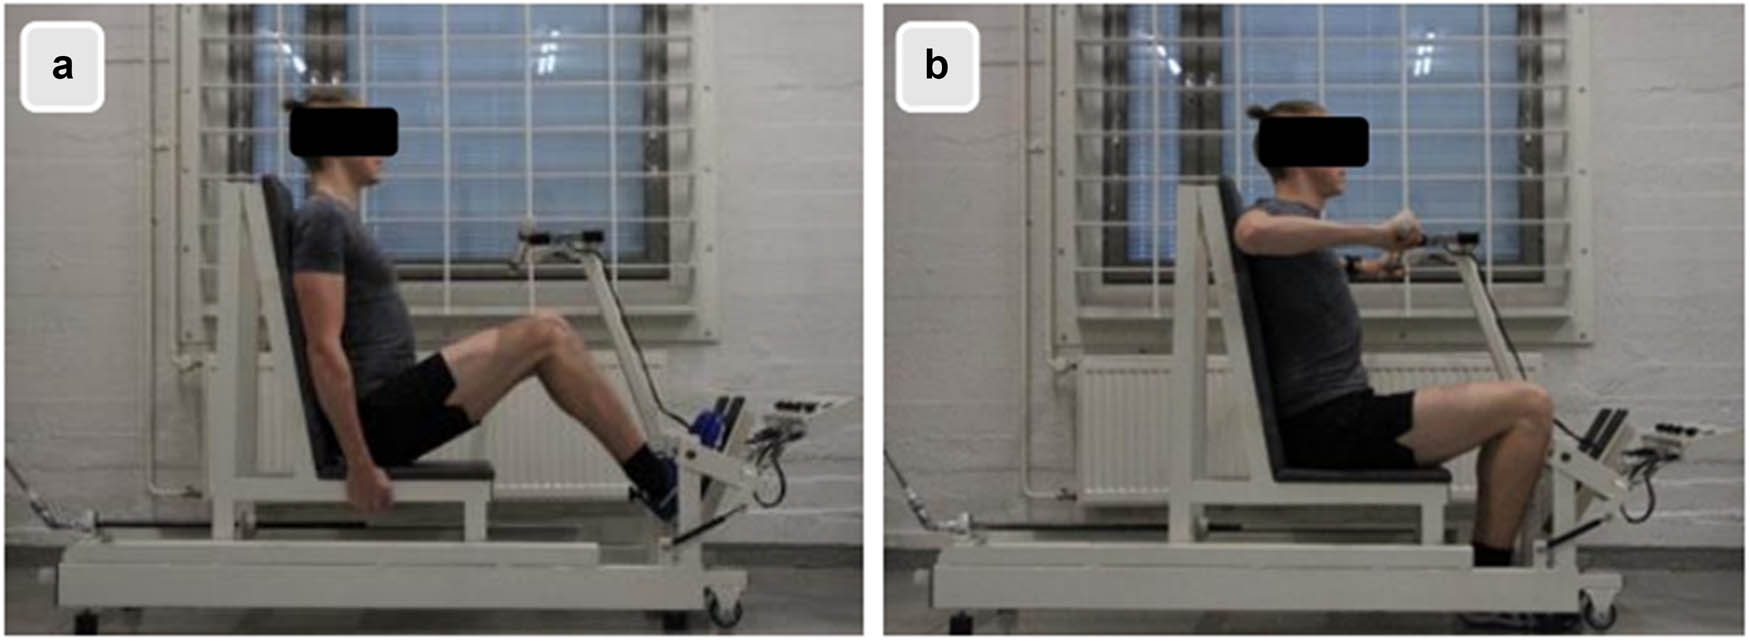
Figure 2
Maximal isometric force of upper (a) and lower (b) extremities
Source: Authors’ contribution.
Table 1
MVC, power, and endurance test results
| Pre-test (n = 29) | Mid-test (n = 26) | Post-test (n = 19) | |||||
|---|---|---|---|---|---|---|---|
| Test | Mean value ± SD | Mean value ± SD | ∆ MID (%) | p-value | Mean value ± SD | ∆ POST (%) | p-value |
| MVClegs (kg) | 348 ± 66 | 364 ± 67 | 7.8*** | <0.001 | 365 ± 82 | −4,7* | 0.011 |
| MVCarms (kg) | 109 ± 21 | 107 ± 19 | 0.3 | 0.588 | 113 ± 22 | 1.7 | 0.220 |
| SLJ (cm) | 242 ± 19 | 240 ± 18 | 0.2 | 0.670 | 242 ± 19 | −0.2 | 0.875 |
| Medicine ball throw (cm) | 678 ± 72 | 671 ± 70 | −0.2 | 0.850 | 674 ± 67 | 0.5 | 0.795 |
| Sit-ups (reps/min) | 44 ± 12 | 46 ± 14 | 6.0* | 0.012 | 51 ± 13 | 13.7** | 0.008 |
| Isometric back extension (s) | 159 ± 28 | 155 ± 32 | 0.0 | 0.778 | 171 ± 18 | 13.3* | 0.050 |
Table 2
MAP360 mobility test result
| Pre-test (n = 29) | Mid-test (n = 26) | Posttest (n = 22) | |||||
|---|---|---|---|---|---|---|---|
| Test | Mean value ± SD | Mean value ± SD | ∆ MID (%) | p-value | Mean value ± SD | ∆ POST (%) | p-value |
| LEFT R45 (cm) | 85 ± 7 | 84 ± 8 | −0.5 | 0.554 | 88 ± 7 | 3.5* | 0.040 |
| RIGHT L45 (cm) | 86 ± 8 | 85 ± 8 | −0.7 | 0.279 | 87 ± 7 | 2.3 | 0.127 |
| LEFT L45 (cm) | 74 ± 10 | 76 ± 9 | 1.9 | 0.251 | 78 ± 8 | 1.6 | 0.587 |
| RIGHT R45 (cm) | 75 ± 9 | 75 ± 9 | 0.4 | 0.940 | 77 ± 8 | 2.3 | 0.459 |
| LEFT L135 (cm) | 85 ± 12 | 83 ± 11 | −1.0 | 0.351 | 94 ± 12 | 12.9*** | 0.001 |
| RIGHT R135 (cm) | 85 ± 12 | 84 ± 10 | 0.8 | 0.806 | 91 ± 12 | 6.9 | 0.012* |
| LEFT R135 (cm) | 63 ± 14 | 66 ± 14 | 5.5 | 0.094 | 68 ± 14 | 2.5 | 0.568 |
| RIGHT L135 (cm) | 68 ± 16 | 69 ± 14 | 2.3 | 0.421 | 72 ± 13 | 5.8 | 0.147 |
| LEFT Rot R (deg) | 110 ± 15 | 107 ± 14 | −1.0 | 0.277 | 134 ± 11 | 30.1*** | < 0.001 |
| LEFT Rot L(deg) | 111 ± 18 | 108 ± 16 | −2.2 | 0.111 | 130 ± 14 | 23.4*** | < 0.001 |
| RIGHT Rot R(deg) | 110 ± 15 | 105 ± 14 | −2.6 | 0.089 | 131 ± 14 | 26.6*** | < 0.001 |
| RIGHT Rot L (deg) | 110 ± 15 | 108 ± 13 | −0.2 | 0.617 | 132 ± 12 | 25.9*** | < 0.001 |
LEFT/RIGHT indicates the stance feet; R/L is the direction of movement; Rotational test results are in degrees (Deg) and Reach test results in centimeters (cm).
Source: Authors’ contribution.
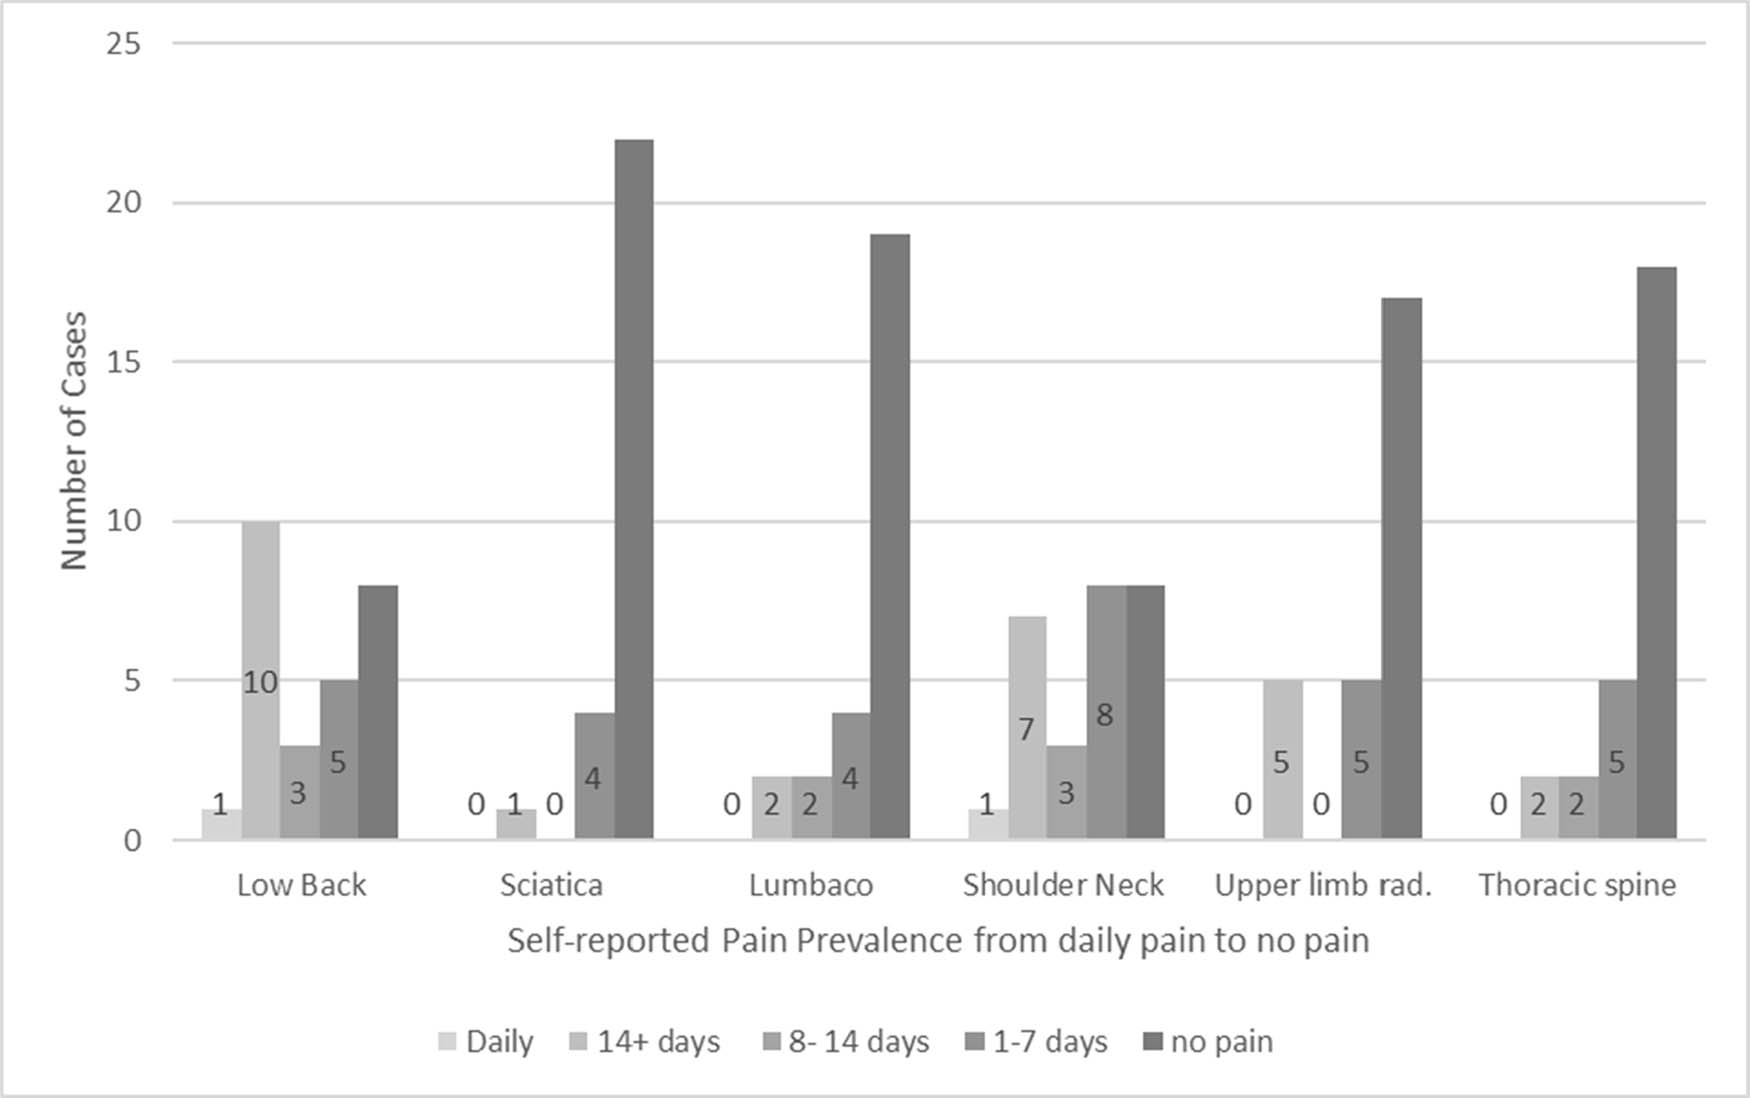
Figure 3
Self-reported pain prevalence
Source: Authors’ contribution.