
1. Introduction
The working environment of military helicopter crew is physically demanding. The crew is exposed to vibration, G-forces, loud noise levels, demanding weather conditions and unergonomic working positions (Bridger et al., 2002; Lopez-Lopez et al., 2001; Pelham et al., 2005). In addition, the workload is increased by a stressful work environment, irregular working hours, night work, and a high work pace (Bustamante-Sánchez & Clemente-Suárez, 2020). Several studies have been conducted on the workload of helicopter crews, from the perspective of work-related musculoskeletal disorders. These studies focus mainly on low back pain (LBP) and neck pain (NP) (Ang & Harms-Ringdahl, 2006; Bridger et al., 2002). Few studies also investigate the effects of physical training in relation to experienced pain (Ang et al., 2009; Andersen et al., 2017; Murray et al., 2017).
In the literature, the prevalence of LBP among helicopter crew is a well-documented topic with the highest rates of 61–80% (Cunningham et al., 2010, Bridger et al., 2002). Respectively, the prevalence of NP among helicopter crew varies between 20 and 80% depending on the length of surveyed period (Ang & Harms-Ringdahl, 2006; van den Oord et al. 2010a). Both LBP and NP have been associated with several factors, including flight duration, vibrational exposure, aircraft types, cockpit ergonomics, and seat design, in addition to the limited options for cockpit seat regulation. Particularly, NP has been related to the helmet complex of night vision goggles and helmet mounted displays , both of which increase the weight of a helmet and the awkward head postures performed during flight (Harrison et al., 2012). Anthropometric variables of pilots have also been examined, alongside the influence of body-mounted equipment utilized for safety (Harrison et al. 2012). Moreover, there has been an increasing focus on capability to endure the strain associated with prolonged sitting. Particularly the strategies aimed at enhancing muscular resilience to occupational stressors related to piloting has been suggested.
While sitting alone is not directly correlated with NP or LBP, extended periods of awkward or constrained sitting significantly heighten the risk of developing NP (Ang & Harms-Ringdahl, 2006) and LBP (Lis et al., 2007). Although static postures may be tolerated, prolonged durations necessitate change in seating angles and movement to ensure periodic relief (Davis & Kotowski, 2015). Thus, flight-associated LBP and NP may arise from poor posture and muscle fatigue due to extended static positioning (Simpson & Porter 2003; Nevin & Means, 2009). Although pain and fatigue can typically be mitigated by adjusting the sitting position, these opportunities are often limited in helicopter seats due to the presence of safety harnesses and body-mounted gear.
The relationship between physical condition and NP or LBP has been investigated, but the results have been conflicting. For instance, van den Oord et al. (2010b) found no association between NP and the strength of the neck muscles. The active muscular structures of cervical and lumbar trunk play a pivotal role in enabling motion in multiple planes. Further, the muscular structures operate synergistically with the spine, fascia, and ligaments to stabilize the cervical and the lumbar regions (Akuthota et al., 2008). According to literature, decreased strength and endurance of these muscles associate with LBP (Biering-Sørensen 1984) and NP (Reddy et al. 2021). There is evidence that NP can be mitigated by strengthening programs (Ylinen et al. 2003) among general population. Furthermore, several studies describe exercise and training programs for military helicopter pilots (Pelham et al., 2005; Brandt et al., 2015; Medeni et al., 2013; Murray et al., 2020). These studies focus on lumbar (Medeni et al., 2013; Nagai et al., 2015) and cervical (Ang et al., 2009) muscular endurance and on pain prevention outcomes such as pain or function (Brandt et al 2015, Medeni et al 2013; Murray et al., 2020). Nonetheless, there is a need for studies to evaluate in detail the impact of training programs on the physical performance and further, on the LBP and NP among helicopter crew.
The self-guided training is often cheaper, feasible, and easier to schedule, and therefore, it is important to know if the effects are equal to guided training. To the best of our knowledge, there is a gap in the literature providing the evidence of the effects of guided training compared to self-guided training. The primary purpose of the present study is to examine the effects of the tailored self-guided and the guided training periods on the physical performance of helicopter crew, and to compare the results of the guided training to self-guided training. The secondary outcome of the study is to investigate the relationship between physical performance and NP and LPB.
2. Material and methods
The current study was conducted within the Finnish Army Helicopter Battalion, and it focused on assessing the physical fitness of the participants in three testing points: prior and after individual and guided training intervals (Figure 1). The individual training (phase 1) was self-guided and there was no particular program to follow. Each participant was provided a physical training guidance material; however, they were instructed to train independently. The guided training (the phase 2) included similar instructions as the phase 2 with the exception of the possibility to participate to guided training (twice a week).
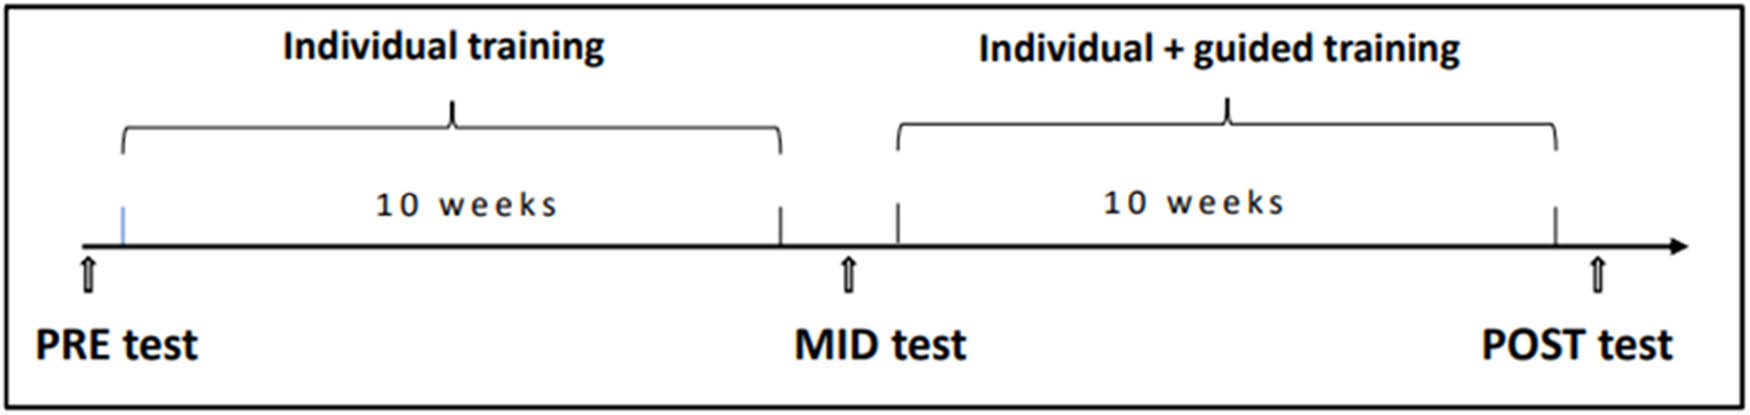
Figure 1
Study schedule
Source: Authors’ contribution.
Physical performance assessments included strength, mobility, and endurance tests. Strength tests included maximal isometric force, explosive power, and muscle endurance of the upper and lower extremities. An anaerobic endurance was evaluated through an evacuation test (Angeltveit et al., 2016), while mobility was assessed using the 1080 MAP mobility test (Eriksrud et al., 2017). Additionally, the participants completed a questionnaire that gathered background information, exercise habits, musculoskeletal injuries (MSKI), symptoms, and their subjective perceptions of their own fitness levels. Background information included also the results of annual running and bicycle ergometer test to reveal the physical fitness of participant before the study. Both of these tests are compulsory tests for the Finnish Army Helicopter Army Helicopter pilots and the tests were not performed as part of the study.
2.1. Participants
This study involved 33 helicopter crew members from the Finnish Army (age = 34 ± 6 years, height = 182 ± 6 cm, body mass = 84 ± 12 kg, running distance in 12 min = 2,821 ± 279 m). The participants were all male and included both pilots (n = 18) and other crew members (n = 15). Of the 33 participants, 19 completed testing at the initial and final timepoints, and 16 completed all testing at all three timepoints (initial, mid, and post). For further analysis, only those who completed at least two tests were considered, except for baseline analysis (N = 33). The study was conducted according to the Declaration of Helsinki, granted a statement from the Ethical Committee of the University Hospital of Helsinki (HUS/1131/2021), and approved by the Finnish Defence Forces (AR19228). All participants were informed of the experimental design, and the benefits and possible risks that could be associated with the study prior to signing an informed consent to voluntary participation in the study.
2.2. Maximal isometric force
Maximal isometric force of the upper and lower extremities was measured in a seated position using an electromechanical leg and bench press dynamometer manufactured and calibrated by University of Jyväskylä, Finland (Häkkinen et al., 1998). When measuring isometric force of the upper extremities (Figure 2a), the pushing bar was adjusted to the height of the participants’ shoulders, and the distance of the seat was set to maintain the elbow angle of 90°. For isometric force measurements of the lower extremities (Figure 2b), the seat was adjusted to maintain knee and hip angles of 107° and 110°, respectively. Participants had two warm-up trials and three actual measurement trials in both upper and lower extremity tests, separated by a minimum of 60–120 seconds for recovery. The participants were instructed to push the bar/pedals as fast as possible after a start command for 3 s. The peak force output from both tests were selected for further analysis.
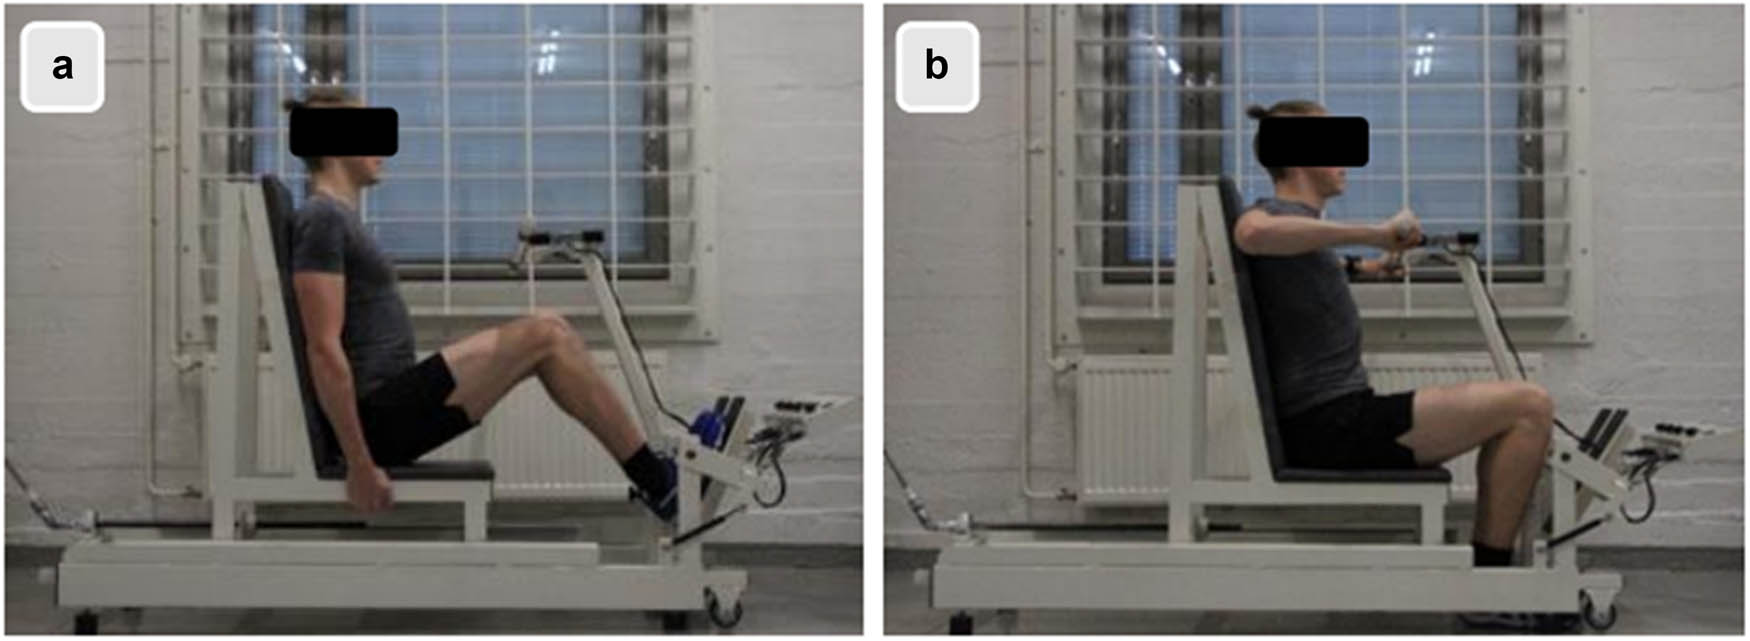
Figure 2
Maximal isometric force of upper (a) and lower (b) extremities
Source: Authors’ contribution.
2.3. Explosive strength
The explosive strength of the upper body was measured with a seated medicine ball throw (SMBT) (Foulis et al., 2017), whereas the explosive strength of the lower extremities was measured with a standing long jump (SLJ) (Taanila et al. 2010). In the SMBT, the participants were asked to sit on the floor with their backs firmly against the wall, legs extended and together. In the test, a 23 cm × 15 cm × 10 cm yoga brick made of foam was placed next to the wall. The participants sat on the floor with their lower back pressed against the yoga brick and their shoulders pressed against the wall. The participants were instructed to throw a 2 kg medicine ball off the chest with both hands, while keeping their back in contact with the wall. The distance was measured from the wall to the middle point of contact on landing using a measurement tape, which was placed and secured on the floor. The participants were allowed to practice 2–3 throws, followed by three maximal attempts which were measured, and the best result was selected for analysis. The SLJ was performed on a 9 mm thick plastic mattress designed for the purpose. The test was performed from a standing position, feet at pelvis to shoulder width. The participants were given two practice jumps before the actual three test jumps. They were allowed to have a minimum of 30 s recovery between the attempts, and the longest jump was selected for further analysis.
2.4. Muscle endurance
The modified abdominal muscle test and static extension tests were selected due to their long-term use in assessing core strength among Defense Forces pilots. In the abdominal muscle test, participants lay on their backs, feet flat on the floor with knees at a 90-degree angle, performing six sets of exercises, three with ankle support and three without (Honkanen et al., 2020). Each set consisted of 10 repetitions, except the final set, which has 20, totaling a maximum of 70 repetitions.
The test is divided into phases: (1) Repetitions 1–10: Arms straight on thighs, performing a crunch until wrists touch kneecaps, (2) Repetitions 11–20: Arms crossed on shoulders, elbows touch knees at the top position, (3) Repetitions 21–30: Hands on ears, elbows touching knees at peak. The final three phases were repeated without leg support. The test has no time limit, but movements must be continuous, ending if the subject fails to reach the top position or completes all 70 repetitions. The static back muscle test, adapted from the Biering-Sørensen test (Biering-Sørensen, 1984), measures static force production in the back and whole-body extensors and is used in pilot selections and various studies as well (Coleman et al., 2011; Honkanen et al., 2017; Pitcher et al., 2007). The participant lay face down on a step board, with hips at the edge and the assistant supports him or her. The test starts on “up,” and time is recorded until the upper body falls below the horizontal plane, with a maximum duration of 180 s (Honkanen et al., 2017).
2.5. Anaerobic endurance
An evacuation track was used to evaluate anaerobic endurance performance. The track is a test designed for the Norwegian Special Forces to measure anaerobic fitness, similar to the working environment (Angeltveit et al., 2016). The performance was started by running the 50 m track first without a load. After the first lap had been run, the subject grabs the evacuation dummy (85 kg) by the pull handle and pulls the dummy along the track. The final result was the duration of the entire performance. Carrying the dummy was prohibited, and the dummy could only be pulled by the handle on it. The dummy also had to pass each cone on the track without knocking them over (Angeltveit et al., 2016).
2.6. Mobility
The mobility test was performed with the hand reach star excursion balance test, which measures dynamic mobility and balance, and has been used in several studies (Eriksrud et al., 2017, 2019). The test is intended to measure the functional mobility of the whole body instead of measuring the mobility of individual joints. The results are measured in centimeters (cm) from the center point while in rotations in degrees from the perpendicular position (A0). The test was conducted on a 1080 MAP© measurement mat (Eriksrud et al., 2018). In total, the 1080 MAP mobility test includes 8 reach tests and 2 rotation movements, which are performed with both supporting legs, i.e., there are a total of 20 tests in the test. A total of 12 tests were selected for the study from these movements (Eriksrud et al., 2017). The reach directions of the movements were R45, L45, R135, L135 and the rotations were performed in both directions L and R. The movements were performed with both supporting legs, resulting in a total of 12 tests. During the mobility tests, the participants’ height, weight, limb lengths, and arm span were measured.
2.7. Questionnaires
The participants were asked about their background information and exercise habits, as well as the MSKI questionnaire (Honkanen et al., 2019) and exercise diaries. The MSKI questionnaire was administered only once, in the beginning of the study whereas, the exercise diaries were administered after both training periods. The amount of exercise (times/week) over the past year was asked and the question was divided into endurance training, strength training, and ball and racket games. The MSKI symptom questionnaire surveyed the number (days/year) of symptoms in the neck-shoulder region, thoracic spine, and lower back over the past year. The intensity of worst pain episode was surveyed with a scale of 0–10 over the past 6 months. In addition, questions were also asked about the injuries in other body areas, treatment received for them, and their impact on sick leave, as well as self-care for muscle function. Exercise diaries were completed using an Excel spreadsheet sent to the participants. Similar diaries were used during both (individual and guided training) phases. The exercise diary asked about daily exercise performance, such as running, cycling, gym, muscle fitness, and its duration in minutes. Furthermore, the daily physical workload on a scale of 1–10, where 1 meant the lightest possible workload and 10 the heaviest possible workload was also asked.
2.8. Statistical methods
The Shapiro-Wilk test and a careful examination of the scatter plots and histograms were performed to measure the distribution of the data. Since the variables could not be considered normally distributed, a non-parametric Wilcoxon test was used in the t-tests. The use of non-parametric tests is also supported by the small sample size. Spearman’s correlation coefficient was used to analyze the relationship between variables. The results have highlighted statistically significant relationships (p ≤ 0.05). The significance of changes between results was examined using the Wilcoxon signed-rank test between measurements. The threshold for statistical significance was (p ≤ 0.05). The IBM SPSS Statistics 29 software was used for analysis.
3. Results
Both muscle endurance test results and 7 of 12 mobility test results improved during the guided training (between the mid- and posttests). Whereas these tests did not improve between the baseline (pre-) and mid-test, in the exception of the sit-up-test, which improved both during the individual and the guided training period (Table 1) (pre and mid test). The isometric maximal strength test results of the lower limbs declined between the mid and posttests. Respectively, a statistically significant positive change of 7.8% (p < 0.001) in maximal muscle strength MVC (kg) occurred between the pre- and mid-tests.
Table 1
MVC, power, and endurance test results
| Pre-test (n = 29) | Mid-test (n = 26) | Post-test (n = 19) | |||||
|---|---|---|---|---|---|---|---|
| Test | Mean value ± SD | Mean value ± SD | ∆ MID (%) | p-value | Mean value ± SD | ∆ POST (%) | p-value |
| MVClegs (kg) | 348 ± 66 | 364 ± 67 | 7.8*** | <0.001 | 365 ± 82 | −4,7* | 0.011 |
| MVCarms (kg) | 109 ± 21 | 107 ± 19 | 0.3 | 0.588 | 113 ± 22 | 1.7 | 0.220 |
| SLJ (cm) | 242 ± 19 | 240 ± 18 | 0.2 | 0.670 | 242 ± 19 | −0.2 | 0.875 |
| Medicine ball throw (cm) | 678 ± 72 | 671 ± 70 | −0.2 | 0.850 | 674 ± 67 | 0.5 | 0.795 |
| Sit-ups (reps/min) | 44 ± 12 | 46 ± 14 | 6.0* | 0.012 | 51 ± 13 | 13.7** | 0.008 |
| Isometric back extension (s) | 159 ± 28 | 155 ± 32 | 0.0 | 0.778 | 171 ± 18 | 13.3* | 0.050 |
Between the pre- and mid-tests, 12 participants improved their results, while 3 participants deteriorated slightly in their results. Twelve participants achieved the same result in both tests. Between the mid- and posttests, 12 participants improved their results, 2 participants deteriorated in their results, and 4 people remained the same. For the static back muscle test, no change was observed between the pre- and mid-tests, while a statistically significant change was observed between the mid- and posttests (p ≤ 0.05). The result improved in six participants, deteriorated in two, and remained the same in eight participants.
The anaerobic test results showed a small (2.3%) decline in time between the pre- and mid-tests (p = 0.007), with 6 participants improved and 19 declined. No further changes were observed between the mid- and posttests.
In the mobility tests, improvement occurred at all measurement points between the mid- and posttests (Table 2), although all of them were not statistically significant. Improvements were noticed in the rotational movements (up to 30.1%, p < 0.001), while changes in the left L135 (p = 0.001) and right R135 (p = 0.012) tests showed improvements by 12.9% and 6.9%, respectively. The left R45 test also showed an improvement by 3.5% (p = 0.040).
Table 2
MAP360 mobility test result
| Pre-test (n = 29) | Mid-test (n = 26) | Posttest (n = 22) | |||||
|---|---|---|---|---|---|---|---|
| Test | Mean value ± SD | Mean value ± SD | ∆ MID (%) | p-value | Mean value ± SD | ∆ POST (%) | p-value |
| LEFT R45 (cm) | 85 ± 7 | 84 ± 8 | −0.5 | 0.554 | 88 ± 7 | 3.5* | 0.040 |
| RIGHT L45 (cm) | 86 ± 8 | 85 ± 8 | −0.7 | 0.279 | 87 ± 7 | 2.3 | 0.127 |
| LEFT L45 (cm) | 74 ± 10 | 76 ± 9 | 1.9 | 0.251 | 78 ± 8 | 1.6 | 0.587 |
| RIGHT R45 (cm) | 75 ± 9 | 75 ± 9 | 0.4 | 0.940 | 77 ± 8 | 2.3 | 0.459 |
| LEFT L135 (cm) | 85 ± 12 | 83 ± 11 | −1.0 | 0.351 | 94 ± 12 | 12.9*** | 0.001 |
| RIGHT R135 (cm) | 85 ± 12 | 84 ± 10 | 0.8 | 0.806 | 91 ± 12 | 6.9 | 0.012* |
| LEFT R135 (cm) | 63 ± 14 | 66 ± 14 | 5.5 | 0.094 | 68 ± 14 | 2.5 | 0.568 |
| RIGHT L135 (cm) | 68 ± 16 | 69 ± 14 | 2.3 | 0.421 | 72 ± 13 | 5.8 | 0.147 |
| LEFT Rot R (deg) | 110 ± 15 | 107 ± 14 | −1.0 | 0.277 | 134 ± 11 | 30.1*** | < 0.001 |
| LEFT Rot L(deg) | 111 ± 18 | 108 ± 16 | −2.2 | 0.111 | 130 ± 14 | 23.4*** | < 0.001 |
| RIGHT Rot R(deg) | 110 ± 15 | 105 ± 14 | −2.6 | 0.089 | 131 ± 14 | 26.6*** | < 0.001 |
| RIGHT Rot L (deg) | 110 ± 15 | 108 ± 13 | −0.2 | 0.617 | 132 ± 12 | 25.9*** | < 0.001 |
LEFT/RIGHT indicates the stance feet; R/L is the direction of movement; Rotational test results are in degrees (Deg) and Reach test results in centimeters (cm).
Source: Authors’ contribution.
The pain and symptom survey indicated that LBP and NP were the most prevalent issues among participants (Figure 3). Only eight respondents (29.6%) reported no pain in these areas over the past year. Notably, 10 individuals (37%) experienced LBP for more than 14 days a year, with one person reporting daily pain. Additionally, five participants (18.5%) reported sciatic pain related to lower back symptoms. In the neck region, 19 respondents (70.4%) reported pain, with 7 (25.9%) experiencing it for more than 14 days and one reporting daily pain. Among those with NP, 10 individuals (37%) noted radiation to the upper limbs. Fewer cases of thoracic spine pain were reported, with nine individuals (33.3%) indicating pain in the lower back and shoulder region. Only three respondents (11.1%) reported having no pain at all during the past year.
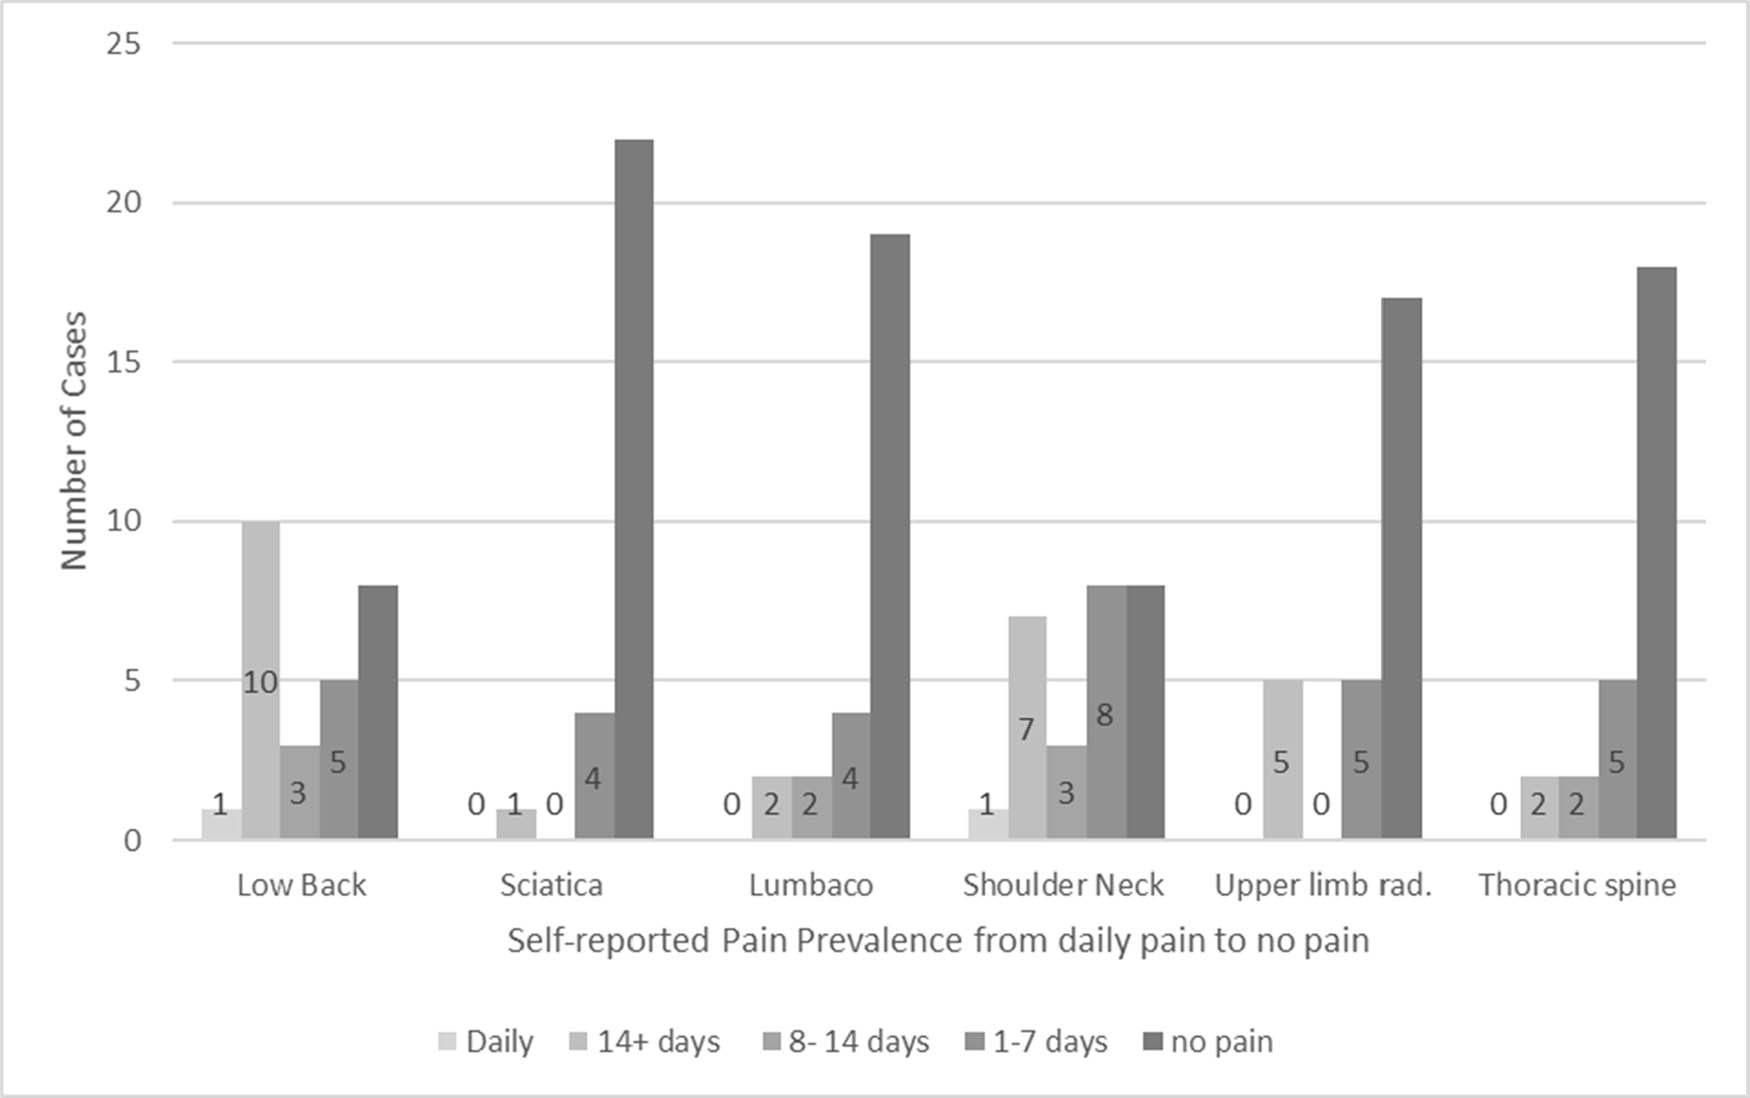
Figure 3
Self-reported pain prevalence
Source: Authors’ contribution.
In terms of pain intensity over the past 6 months, 10 individuals rated their LBP at 5 or higher on a scale from 0 to 10, while NP was generally rated lower, with 10 individuals scoring it only 1–4. Pain in the thoracic spine had a more varied distribution, with four individuals also reporting scores of five or higher.
When association between the symptoms at the baseline and physical fitness test results were analyzed, it was found that NP pain scores associated with the modified abdominal muscle test (r = −0.429, p = 0.026) and the static back muscle test results (r = −0.382, p = 0.049). Furthermore, LBP associated with the modified abdominal muscle test results (r = −0.399, p = 0.039).
In a survey on exercise habits, involving 27 participants, the participants responded as follows: 4 exercised about once a week, 5 twice a week, 13 three times a week, 2 four times a week, and 3 more than four times a week. Most common exercises included strength training (1.59 times/week on average), endurance training (1.48 times), and racket/ball sports (0.63 times).
During the individual training phase, 18 training diaries were collected, and only 9 for the guided training phase, so the return rate was low. Common activities were gym/strength training, running/walking, golf, and cycling. The reported average of exercise was 35.8 h (ranging from 7 to 91) during the first phase, and 39.9 h during the latter phase, respectively. Twelve participants met the Finnish Defense Forces’ minimum target of 2 h and 30 min of exercise in the first and only 6 during the latter phase. Twenty participants (69%) took part in the guided exercise: nine attended 1–3 sessions, eight attended 4–7, and three attended 9–11 sessions, while nine did not participate at all.
4. Discussion
The purpose of the study was to examine the effects of both individual and supervised exercise programs on the physical performance of the helicopter crew, and in addition, to investigate the participants’ exercise habits, MSKI symptoms, as well as participation activity in supervised exercise. During the guided training intervention, significant improvements were noted on physical performance, specifically in the abdominal and lumbar muscle strength, as well as in several mobility test results. The supervised exercises primarily focused on enhancing mobility and core stability, utilizing participants’ own body weight.
The study revealed considerable variability in physical fitness level in baseline, including both fit and less active individuals. On average, participants ran 2,821 m in their annual 12 min running test, and exercised three times weekly according to the questionnaire. Surprisingly, some participants did not meet the general recommendations for exercise guidelines of 2 h and 30 min weekly. Despite generally low and considerably variable physical activity levels over the last year, all participants met the 3.2 W/kg output required for helicopter crews in annual ergometer tests. The study findings demonstrate that all the personnels meet the bicycle ergometer fitness requirements; however, some individuals’ physical activity levels fall below general recommendations, indicating a need for increased activity. Enhancing physical activity could improve coping mechanisms and reduce sick leave (Kyröläinen et al., 2008). In crisis situations, personnel’s ability to cope becomes critical, as their physical and psychological demands are likely higher during peacetime, which has been supported by a previous study on military exercise stress (Ojanen et al., 2023).
During the second intervention, 18 guided exercise sessions were held, but participation was low. Namely, 9 individuals did not attend at all, 14 participated between 1 and 5 times, and 6 attended 6–11 times, with only 3 using more than half of the sessions. Survey results indicated a general dissatisfaction with personal participation (mean score of 2.2) and identified work responsibilities as a limiting factor (mean score of 4.5).
4.1. Muscular and aerobic fitness
Improvements in the maximal power of the lower extremities were noted between the pre- and mid-tests, but no further progress was observed by the posttest. The abdominal muscle test results showed that performance peaks at specific thresholds. Notably, most participants fell either below 50 or reached a maximum of 70 repetitions. The fact that many participants reached maximum score in the abdominal muscle test may indicate a ceiling effect that limits the overall analysis. The static back muscle test showed a similar ceiling effect, with multiple participants achieving maximum results across tests. High scores in the back-muscle test reflect positively on the participants’ muscular fitness levels overall.
Investing in core muscle development and guided exercise programs as preventive measures are warranted. However, further research is needed to evaluate different training methods for optimal outcomes. The current study showed improvements in core muscle strength and mobility despite low participation and limited training sessions. It is important to note that participants may have also exercised independently, which could not be verified due to the limited number of exercise diaries.
In comparing the present anaerobic test results to the reported annual running test results, a nonlinear relationship was observed, while weight and anaerobic performance exhibited a linear correlation: as weight increased, anaerobic performance improved. This finding is well in line with findings of Angeltveit et al. (2016). It is crucial to interpret these results cautiously, as the 85 kg dummy weight may have influenced performance, particularly among lighter participants. Nevertheless, the average anaerobic test result appears good compared to Angeltveit et al. (2016), who reported an average of approximately 50 s for Norwegian Naval Special Forces.
4.2. Mobility
The initial mobility test results show both improvements and declines compared to Eriksrud et al. (2019), who demonstrated better reach (2–8 cm) but poorer rotations (16–22 degrees) compared to present results. A significant development occurred in all rotations between the intermediate and final assessments, as well as in three other movements in the present study. However, no statistically significant changes were observed between the pre- and mid-tests. While guided exercise aimed to enhance body control and mobility, the overall staff participation does not entirely support this theory, as all individuals showed some improvement, despite inconsistencies in exercise diaries.
4.3. MSKI
A correlation has been established between static back muscle strength and modified abdominal muscle functionality in LBP. Previous studies indicate that strong core muscles may be linked to LBP symptoms (Biering-Sørensen, 1984; Honkanen et al., 2017). However, while some research examining physical training effects on pain in helicopter crews did not find statistically significant outcomes, they recognized a potential relationship (Murray et al., 2017). The challenging work environment exposes crew members to physical stressors such as non-ergonomic postures, gravitational forces, temperature extremes, whole-body vibrations, equipment weight – especially affecting the neck-shoulder area – prolonged static sitting, and high noise levels (Ang & Harms-Ringdahl, 2006; Bustamante-Sánchez & Clemente-Suárez, 2020; Lopez-Lopez et al., 2001; Pelham et al., 2005; van den Oord et al. 2014).
The prevalence of musculoskeletal symptoms in this study aligns with previous research (van den Oord et al., 2010a). High rates of lower back and neck-shoulder pain were reported, with 19 individuals experiencing pain in both areas. The intensity of lower back pain was notably concerning, with 10 participants reporting pain levels of 5–9. Neck-shoulder pain prevalence reached 70.4%, with 25.9% experiencing pain for over 14 days or daily, figures slightly above those found in the Dutch pilots (van den Oord et al., 2010a). Possible reasons for the higher prevalence among Finnish crews include helmet fit, accessory weight, and ergonomic issues related to helicopter design (Thuresson et al., 2003; van den Oord et al., 2012, 2014).
Despite an average age of 34 years, the prevalence of MSKI symptoms is alarming when compared to Finnish men (Koskinen et al., 2011) aged 30–44 years, where LBP was reported at 51.8% in helicopter crews vs 34.9% in the general population, and NP at 40.7% compared to 27.0%. These findings highlight the need for closer monitoring of MSKI symptoms among helicopter crews, with a potential focus on exploring the connection between core muscle condition and these symptoms.
4.4. Exercise habits
Exercise habits among the study group varied widely, with some participants working out over four times a week and others not exercising at all. This was reflected in the collection of 60 exercise diaries, which revealed that many participants were not actively maintaining their physical fitness, despite expectations. Only 19 diaries were submitted in summer and 9 in autumn, indicating a low return rate, which is common in such studies. Variability in diary completion was also evident, with some records lacking full details on duration and loads. The reasons for low exercise levels could include a lack of motivation and/or busy schedule.
The varied participation times complicate result analysis, making it hard to form comparable groups. Participants who engaged 9–11 times averaged only once a week in supervised exercises, indicating that overall exercise levels may be too low for meaningful development. Consequently, the analysis does not separate participants based on their involvement in supervised exercises.
4.5. Limitations
The study’s small sample size (n = 33) limits the reliability of evaluating participant development, particularly since some participants did not complete all tests. This issue had also arisen in previous studies (Andersen et al., 2017; Murray et al., 2017). Another limiting factor is the lack of a control group. Without a control group, it was difficult to analyze differences and encourage greater participation. While it is possible to identify non-exercisers, the small numbers mean a robust control group could not be formed, contributing to low exercise diary returns.
The voluntary nature of participation may also bias the results, but the group included some who do not exercise regularly. The main reasons for the small sample size are likely to be due to staff being busy and unwilling to take on additional tasks., as indicated in their feedback on guided exercises. Despite these limitations, the testing methods themselves are generally reliable.
The strength and endurance tests were consistently conducted by the same testers, enhancing reliability. Each session involved small groups of 3–9 participants and included a joint warm-up. Adjustable test benches were customized for each individual, with recorded adjustments for future tests. Previous research supports the reliability of these tests (Angeltveit et al., 2016; Biering-Sørensen, 1984). The mobility test, recognized for its reliability in assessing whole-body mobility (Eriksrud et al., 2017), involved one participant at a time.
The small number of exercise diaries limited quantitative analysis, and qualitative insights were undermined by too many variables, making it difficult to connect development to exercise participation. Using sports watches for data collection might improve data quality and participation in future studies. Variability in testing intervals and adherence to training principles like overload and progression also impacted development. The areas of improvement appeared aligned with the goals of the guided exercise content. Finally, the cross-sectional design when analyzing the association between pain and physical capacity is a limitation. The design does not allow to know whether low strength preceded the pain, or was indeed a result of such pain.
5. Conclusion
The guided exercise intervention showed a significant positive relationship between improvements in back and abdominal muscle strength and mobility. Over the past year, nearly three-fourths of the participants experienced neck-shoulder or lower back pain. Negative relationships existed between neck-shoulder pain and abdominal and back muscle strength, as well as between lower back pain and the modified abdominal test. Participation in the exercise program was low and one-third of the participants did not meet the general exercise recommendations. In conclusion, supervised exercise can improve physical performance and reduce pain symptoms among helicopter pilots and crew. It is, however, essential to increase guided exercise access and participation, especially for those with low activity levels.
Funding information
Authors state no funding involved.
Author contributions
Tuomas Honkanen and Tommi Ojanen took part in all elements of the study and drafted the manuscript. Atte Etula took part in data collection. Roope Sovelius and Heikki Kyröläinen contributed to the design of study and data interpretation and statistical analyses. Ilkka Laaksi contributed to the design of the study. All authors read and approved the final manuscript.
Conflict of interest statement
Authors state no conflict of interest.
Data availability statement
Data belongs to Finnish Defence Forces and it can’t be shared.